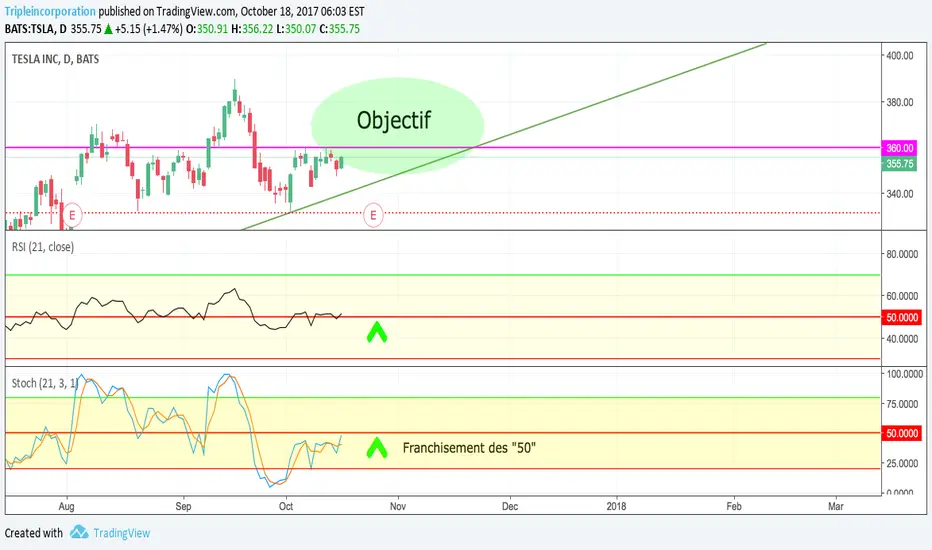
GBP USD expecting a short termed pullbackPrice has heading down to a support zone formed by structure and .618 fib retracement level of the bullish swing that started in 2016. I would expect short termed pullback. todays GBP data are not that bad for the market to simply blow through this important level. No trade set up yet. I will update as price action develops.
Dan
Change

Mr. Dow – uptrend in diversionHi,
I think the dow is in a strong bullmarket – superordinate. It seems that wave 4 (purple in brackets) has completet it‘s mission already and ended as a triangle.
But: On the short term, I see a possibility to short it. Startpoint: red box. Endpoint: green box.
So the green box then is the startpoint of the long call. It could be the last chance to get chaper in the market bevor wave 5 (purple in brackets) gets stronger with targets around 27.000 up to 30.000 points.
Take care,
tgo

ETH forming ihsI will be patiently watching how this ihs in formation unfolds.
Drop below right shoulder should indicate failure.


EURUSD AT A DAILY SUPPORT LEVEL SOON Looking at the daily chart of the EURUSD we see for now a clearly bearish trend. But with the upcoming support/resistance going hand in hand with the fibonacci level of 0.5 im looking for another bullish move. A trade setup could look like the green and red box with a pending buy limit order right on the levels.

EURGBP LONG ON DAILY BUT SHORT ON LOWER TIME FRAME?so eurgbp is on a daily/weekly support, but it seems to be it has closed below it; although price is too close to actually tell whether it is just a fakeout so be sure to wait for price action and retest of trendlines on lower time frame. Always react to market do not try to predict it.

Bitcoin BTCUSD Trying Hard to Change Trends Today Bitcoin BTCUSD Trying Hard to Change Trend
Bitcoin broke above the 9537 line here and then moved up to
testthe upper parallel, making an 02:15gmt/21:15est high
within the first hour of far East opening before falling away
\again to an 08:15gmt/03:15est low right on the blue support
line at 9373 before bouncing again on European interest at the
lower levels. Now it's bounced to touch the first line of
resistance at 9537 once more and day traders are taking a fast
200 point win and cashing back out again many of whom have
shorted at the usual 06:00gmt traditional short time and made
200 down and now 200 up again. At the moment Bitcoin is still
in day-traders' and scalpers' territory with no killer swings to
trade as yet. It's still trapped in a downtrend but is at least
trying to form a higher low so far today and therefore showing
first signs that this downwave is running out of downside
momentum. In very near term it's gone into a small
continuation pattern and is trying to break above the 9537
line where fixed and dynamics converge - tiny pins below and
above price forming on 15 minute chart meaninga big battle is
raging below the surface here.
Things only begin to turn positive again now when the 9537
line is retaken and held by the bulls - that will likely lead to a
test of the upper parallel again at 9682-9715 - and then the
big test...Bitcoin has to break and hold above the 9715 level
before the last bear will back off. It would be yet another
brilliant escape act by Bitcoin if it can manage this at any
point today, attracting every bull still left in town back to the
game and should be followed higher if we see this price action
develop.
But until then Bitcoin is effectively trapped at these lower
levels and the downtrend remains in force - but it's not super-
bearish here, just mildly so - and so we need to watch it here
to see if it tries to break above the smallest parallel of the
continuation pattern - if so can follow with stops below 9480.
Otherwise we wait for lower values still.

Well Well Well... BTC!Hello all and welcome to my little corner of the internet. It isn't big, nor is it fancy, but what about the chart art! Now I've warned of a correction for some time (quite a bearish outlook if you were to look back at my other publications... and give em a like) but it seems as though things are playing out as i stated. I hope that any who viewed my charts saw the drop coming a mile away as i did and took the correct precautions. Lets jump into the meat though. I'm still quietly confident BTC will drop to ~9.3k-9.7k (The wick low could be 9K) and i have arrived at this conclusion based on probability and the accuracy of my charting. Here's how it is - we're still in a bear market guys, it isn't hard to see that, but after this low we could very well be looking at a recovery and a TRANSITION. YES! a transition into the long awaited bull season. This is great news, now I'm not saying it wont go for another dip, in fact i expect it will - as is required to signal the return of a healthy bull market. Check out the green channel i have plotted on the chart: This is the healthy channel. This is the area we want to see BTC move in and when it makes a break above we simply say hallelujah and we sell (at the peak of course!). When it breaks below we double down and buy the dip, this is how money is made. There are lots of "analysists" out there that will feed you what you want to hear, because they want it too but the market cares not for your wants, dreams or aspirations. The market knows only what the whales want: either swim with them or get eaten. Now there's always the chance I'm way off, as i said the market doesn't care, but i make my calls based on probability and as such there's a good chance i have it pegged MOST times. Anyway, time for me to wrap this up so I'll leave you with this: REACT. always REACT. cover your butts because at the end of the day I'm not going to make you money, the other analysists aren't going to make you money - that's on you. So be careful in the worlds most volatile market. I wish you all the best fellow traders!

EURUSD and DXY confirming signal of change in trend for dollarEURUSD EURUSD and DXY
EUR is tracking an inverse set of parallels to DXY. When EUR
breaks lower it's a second sell/add shorts signal which must be
confirmed by DXY breaking above the upper parallel
containing this impulse wave from inception.
DXY has to break and hold above that parallel before the
bears will back off - but it's fighting here, where it should if
it's to turn back up from here. The confirming signal is the
break above the upper parallel.
DXY Dollar Index
Despite the spike and noise surrounding CPI numbers
yesterday DXY has been forced back down the same small
parallels it was travelling down before the numbers hit the
newsfeeds. As in last comment Dollar bulls still have the
double bottom on their side here. The last one was one week
apart, this one is 2 weeks apart. The Dollar is likely to hold
here at these lower levels and then begin to rally. It's waiting
on Wall St to open now but bears in London have failed to
push it below the double bottom. A sign of waning downside
momentum. Once it can break above the upper small parallel
guiding the descent it should attract more buyers and move
back up to test the 89.37 line where it will likely meet
resistance again...it has to push on through here during the
course of today for the bulls to gain more traction and flip
DXY into more positive mode from this point. This battle may
take some time to resolve - DXY has to fight its way through
three lines of near term resistance at 89.37, 89.51 and then
89.62 to turn back to positive again. Look to buy dips here
and on the pairs with stops under 88.40 on DXY for small loss
if wrong from here. Increase longs on move above the smaller
upper parallel.
On downside, DXY will have to break below 88.40 today to
change this view to near term negative but only back to 87.70
at lowest where DXY should find final support and begin to
rally again. But so long as 88.40 holds up today the Dollar's
downtrend is finally coming to an end.

XRP CorrectionThis is my way to indicate some possible changes.
I'm a novice, please dont put in financial orders.
Tips? welcome!

Data Stream CHANGE OF TREND IN THE NEXT 4-5 Hr.CHANGE OF TREND IN THE NEXT 4-5 Hr.
Possible breakdown of resistance:
You can buy at this time with a stop loss of 5% or wait for the break to be confirmed to buy.
target 1: .298
target 2: .35152
in case of falling below the support line we will be going down to .152 usd to .14

ATTENTION A SENTIMENT CHANGE AND POSSIBLE CHANNEL BREAKOUTThere is a head and shoulders pattern at the top here. A Break to the lower level of the right shoulder also followed by a rounded topping and now two clear channel top and double bottoms. Based on fib from the original fib breakout in the beginning of november I see a correction to around 12000...

Short Idea - A Possible Trend Change for #Japanese Yen. Recent price action may favor the short side of $USDJPY #FX #Forex $UUP $EWJ

EURUSD | Change your mind
READ DESCRIPTION on chart
Ask me if you have some question
Comment what you think about
Or just click Agree button
Thank you
~ Nika

Bearish (previously Bullish) CADJPY over next 6 hours1. Strong support levels via big green candles near to level
2. We enter this trade slightly earlier (as we want to head to bed earlier than usual) while possibly getting the same returns over 8 hours.
Will update soon!

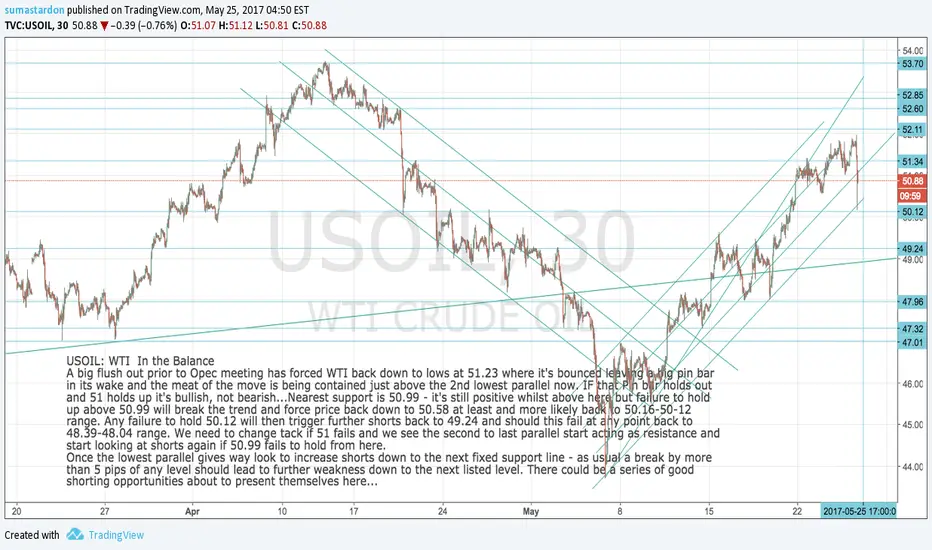
USOIL: WTI Beginning to break downWTI: USOIL Beginning to break down now and vulnerable whilst unable to clamber back above 51. Trend looks to be changing here so we move back to a bear tack looking for shorting opportunites whilst below 51 - stops for shorts need to be above 51.16 for now for small loss if wrong here

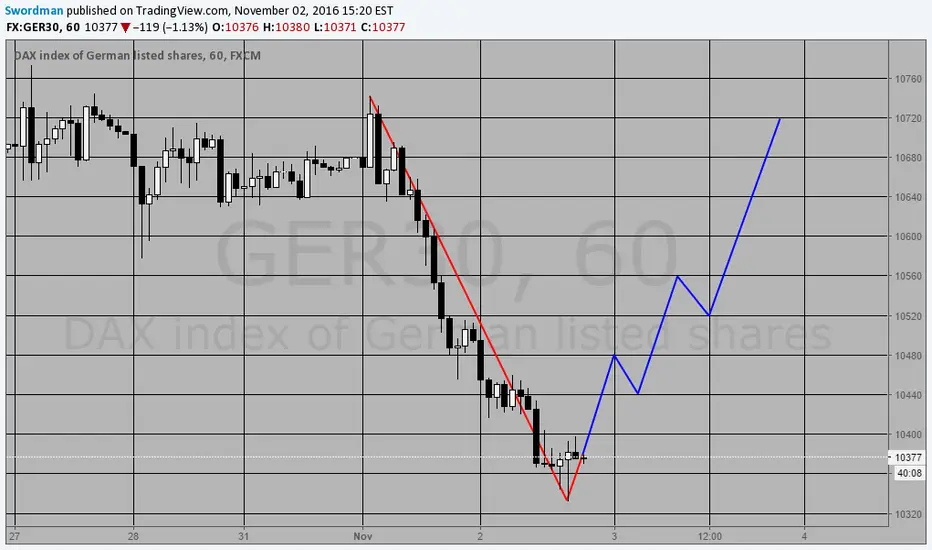
Time to change DAXNow Dax has on good strong level to change short to long. Tomorrow and friday go up and go up near to 10700. ( Blue has the probably long pattern)


DXY - USD Dollar Index could change Long RR Ratio >3:1DXY - USD Dollar Index could change Long RR Ratio >3:1

How to look at the impact of economic data on the marketEconomic data will accelerate the trend or change the trend, so do not bet on the data, unless you have a large floating profit
