Channel BreakoutThe Stock has given a channel breakout in April. It is currently in accumulation phase. Buy for the targets seen in the chart. Use a 1:3 risk reward ratio.
Channelbreak

RF 1D: Breakout or Just a Bullish Pause?Regions Financial (ticker: RF) finally escaped the descending channel it had been stuck in for nearly 8 months — like someone who missed their stop and woke up in a different state. The breakout came with volume and a hold above the 50-day MA, which technically gives the bulls a reason to stretch their legs — cautiously.
The price has already cleared the 0.618 Fibonacci level (~21.66), and is now pushing toward the 0.5 zone (~22.87). If momentum holds, the next key area is target 1 around 24.00–24.50. Beyond that — and this is where things get ambitious — we have target 2 in the 27.50–28.50 range, which aligns with pre-breakdown resistance from late 2024.
RSI is climbing into overbought territory but still confirms the breakout rather than warning of a top — at least for now.
On the macro side: U.S. regional banks have had a rough ride in early 2025, but RF has held up better than many peers. The recent earnings beat and visible uptick in volume suggest growing institutional interest. If bond yields keep cooling and risk appetite returns to the value sector, RF could remain in favor.
That said, bulls need to see a confirmed hold above 22.80. Otherwise, this could end up as another failed retest — and bears are always lurking just outside the channel.

USDCAD bearish view
OANDA:USDCAD again on this pair, first analysis accurate, in new look having bearish view, price in PA moving, still we having nice structure, price is now come back in channel, looks like breaking first channel, which will take for confirmation and sign for bearish expectations.
SUP zone: 1.37400
RES zone: 1.36400, 1.36100

Are we still in an oscillator?Been over a month in this channel now. Now clear signs of breaking up or down. We are likely headed back to the 30 day SMA, and from there who knows. I tend to like the upside here being above the SMA, but we all know it can crack down and retest the lows yet again. I'm saying we retest the highs first.

US DOLLAR: Sell opportunity following channel breakPrice on DXY recently broke above a sharp descending channel, but the move lacked presence. There was no real follow-through and certainly no conviction behind the candles. It felt hesitant, as this is a great indication for us to use.
Instead of accelerating upward, price now hovers just above the breakout, this kind of behavior suggests rather a random push than a shift in sentiment. Without the strength to sustain above structure, I think we will see the price come back to the channel's lower border.
And when breakouts fail, they often trap early longs, preparing for a more committed move in the opposite direction.
A rejection from this level could send price into the 0.85800 level.

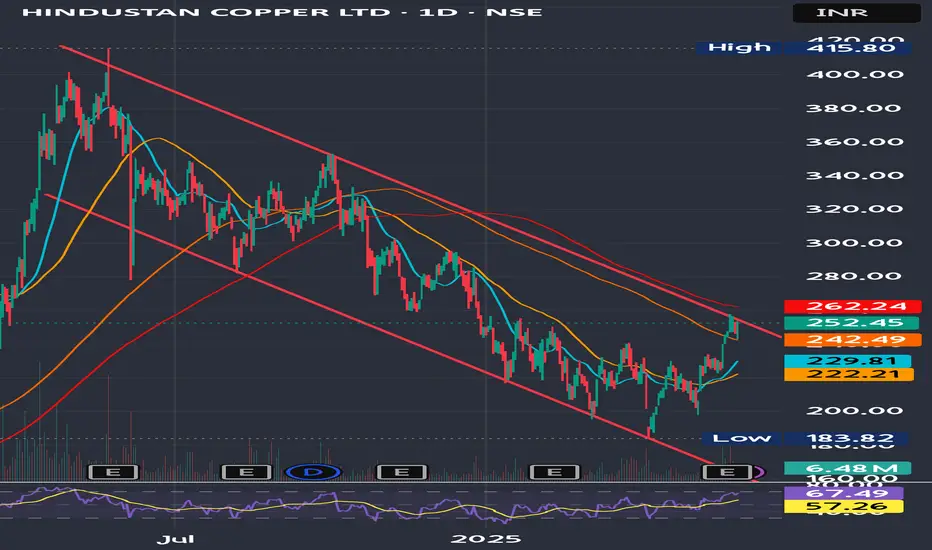
Hindcopper's Channel Breakout DueHindustan Copper Ltd. has recently garnered attention due to its strong financial performance and positive market sentiment.
Stock has broken out above key resistance around ₹240–₹245 with volume support.
Trend: Bullish
Indicators:
RSI ~67 (strong momentum)
MACD positive crossover
Above 50- & 200-DMA
Target Levels (Upside Potential)
Target Level Reason
270 Minor resistance zone (prior supply area)
292–295 Near-term swing high (Feb 2024 levels)
320+ Medium-term breakout target if momentum sustains
Stoploss Levels
Stoploss Type Level
Reason
Tight Stoploss 240 Previous breakout zone
Moderate SL 225 Near 50-day moving average
Positional SL 216 Breakdown confirmation below trend support
Buy on dips strategy around 245 -250 levels
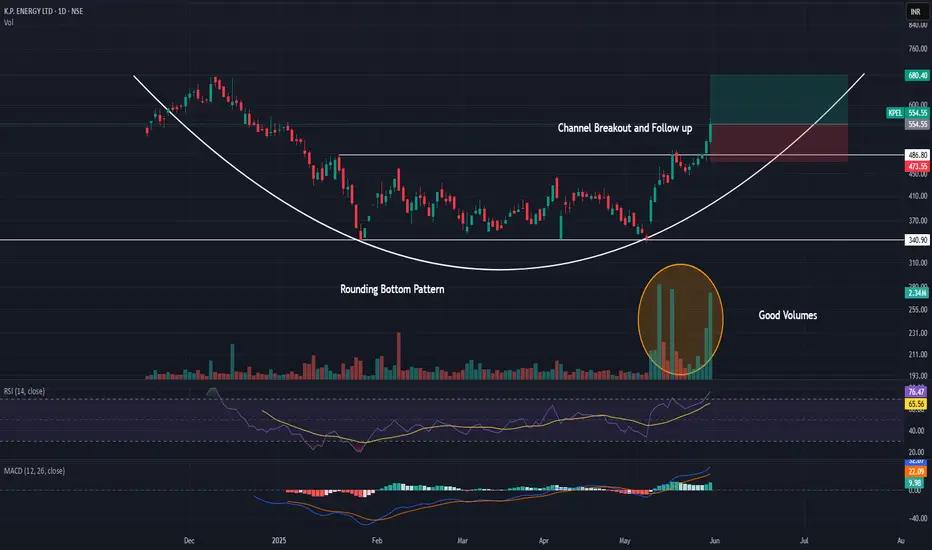
Momentum Breakout in KPEL1. Rounding Bottom Pattern Breakout
2. Channel Breakout and Follow Up
3. Good Volume
4. RSI above 70
5. MACD is green
JPYUSD Technical Analysis | (MMC) in Play + Target🟦 1. Structure & Price Action Overview
The chart is of JPY/USD on the 2-hour timeframe, showing a clear picture of price movement over several weeks.
We see three major market phases:
Range/Resistance Phase (Left side of chart)
Uptrend Phase (Middle – rising channel)
Reversal Setup (Right side – potential bearish move forming)
📈 2. Uptrend Channel (Accumulation to Expansion Phase)
From around May 13th, price started forming higher highs and higher lows, respecting a bullish channel (light blue shaded area).
This is a classic ascending channel, often seen during a controlled uptrend where buyers are still in control but momentum is slowing.
The channel took price directly into the resistance zone (marked in purple at the top).
🚫 3. Resistance Zone Rejection (Key Supply Zone)
Once price hit the resistance zone (~0.00705), it failed to break higher.
This level had previously caused sharp drops, so it's a well-established supply zone.
Price was rejected and dropped sharply, breaking out of the ascending channel – a strong bearish signal.
🔄 4. Mirror Market Concept (MMC) – Curve Bending Pattern
After the initial drop, price attempted a bounce, but couldn't even reach previous highs.
The curved arrow labeled "Curve Bending" shows how the market is “bending” its momentum – not pushing upward anymore but turning into a reversal.
This forms the mirror of the previous rise – indicating the market is ready to “mirror” that previous bullish leg, but to the downside.
🔄 5. SR Interchange (Support Flipped Resistance)
The previous demand zone (around 0.006950–0.007000), where buyers pushed price higher during the uptrend, is now acting as resistance.
This is called an SR Flip (Support becomes Resistance) – a very reliable technical sign of trend reversal.
🎯 6. Bearish Target Projection
Based on MMC and symmetry of past movements, the chart is projecting a strong drop toward the 0.006800 support zone.
This zone is also historically significant and acted as a demand area earlier.
The black arrow and target box show this expected move, which aligns with the mirror structure.
🧩 Conclusion & Trade Plan
Bias: Strong Bearish
Confirmation : Channel break + rejection at resistance + curve bending
Trigger: Price fails to reclaim 0.00700 and breaks below 0.006930
Target: 0.006800
Invalidation : Clean break & hold above 0.007050
🛡️ Pro Tips:
Don’t just jump in — wait for bearish confirmation (like a bearish engulfing candle, or a failed retest).
Always set your SL (Stop Loss) above the resistance zone (~0.007050).
Let the setup come to you — don’t force trades.

GlenMark Pharma, 1DChannel Pattern in Daily Time Frame, Breaking Out Look eye on this ,
It is at Retest Point
Nifty is Also Trending and Bullish
Risk Very low and Make More Out of it
Follow for More Ideas Like This

ETH Just Slapped Into an Order Block — Next Stop: Dump City?🔎 Ethereum Smart Money Sell Setup | May 17, 2025
The ETH/USD 30-minute chart just gave us a juicy bearish confirmation off a clean Order Block rejection, wrapped in a downward sloping parallel channel — exactly what smart money watches for. Here’s the breakdown:
🧩 1. SMC Narrative
Price tagged a bearish OB right at the mid-supply zone 🟣
Followed by strong engulfing rejection candle
Breakdown from the minor trendline support → confirms bearish shift
Order block lines up with the premium zone of the overall bearish channel
Retail might think this is support — we see liquidity 👀
🎯 2. Trade Specs
Entry: ~2,516.09 (OB upper edge)
SL: 2,520.00
TP Zones:
TP1: 2,476.99 ✅ (almost hit)
TP2: 2,450
TP3: 2,409.47 (final target at channel low)
Risk-to-Reward: Approx 1:4.5
🛠️ 3. Why This Setup Works
Price delivered a channel breakout + OB rejection combo
Strong volume spike during the OB touch = institutional activity
The bounce off the OB is weak — signaling exhaustion
All signs point to a grind down to lower channel support
If you know, you know — this is how banks exit in stealth mode 🚪👻
🎯 Bonus Tip:
If ETH retests the OB zone again with weak bullish candles — that’s your secondary sniper entry 🎯
📣 What’s your bias? Think bulls can reclaim this OB, or are we headed straight into deeper discount pricing?
📲 Follow @ChartNinjas88 for daily laser-focused setups, SMC concepts, and precision trading breakdowns!

ZECUSDT , 1HrPattern is looking Good , If BTC is Sustaining Above 1,06,834 this level then , This ZEC pattern will Give a Good Breakout ,
Enter only When Upper Trendline is Breakout
Take Your Own Risk According to your Capital .
Follow for More Ideas Like This

DLF BUILDING ABOVE CHANNEL RANGE DLF Limited is one of India's leading real estate development companies, founded in 1946 by Chaudhary Raghvendra Singh. It is headquartered in New Delhi and has developed residential, commercial, and retail properties across Delhi, Gurgaon, Haryana, and other regions.
Key Highlights:
- Industry: Real Estate
- Market Presence: Offices, apartments, shopping malls, hotels, and golf courses
- Major Projects: DLF Cyber City, DLF Mall of India, DLF Emporio, and various residential townships
- Revenue (2024): ₹6,958 crore (US$820 million)
- Net Income (2024): ₹2,724 crore (US$320 million)
Support & Resistance Levels
- Support: 670 INR
- Resistance: 695 INR (Potential breakout level)
- Next Target Levels: 740 INR and 800 INR (If breakout above 695 INR occurs)
Market Sentiment
- Overall Trend: Bullish
- Short-Term Outlook: Positive momentum with potential breakout
Short-Term Target Levels
- Immediate Resistance: 695 INR (Breakout level)
- Next Target: 740 INR (If breakout above 695 INR occurs)
- Higher Target: 800 INR (If momentum sustains)
- Support Levels: 670 INR (Key support zone)

GBPJPY Just Hit the Sweet Spot — High RRR or Fakeout Trap?💷 GBPJPY 30-Min Chart Breakdown — May 14, 2025
This setup is a banger for traders following structure, zones, and risk-reward logic. Let’s dissect the trade logic:
🔍 1. Market Structure
Price has been moving within a well-respected ascending channel (see black trendlines).
We just printed a short-term bearish pullback, with price dipping into a refined demand zone (highlighted pink/red).
The most recent bearish impulse looked like a liquidity sweep, not a structure break.
🧱 2. Smart Money Zone
Demand zone aligns with:
✅ Previous OB (order block)
✅ Mid-channel support
✅ Equal lows & trendline liquidity just below
Dark gray box = the exact entry block
Bulls stepped in right on time — classic mitigation + reaction setup
🎯 3. Risk-Reward
Entry: Around 195.380
SL: 195.110 (tight below the block)
TP: 196.575
RRR ≈ 1:5 — beautiful sniper entry with minimal exposure and max gain
🧠 4. What to Watch Next
Break above 195.900 = confirmation of bullish continuation
If price stalls again below midline, re-entry could come after another liquidity push
Clean break of 195.100 = invalidation (watch for potential short setups below)
🔁 Trade Management Tips:
Trail stops aggressively above 195.900
Scale out partials every 50 pips if you're trading it like a swing
Add confluence from DXY/Yen strength for better context
This one checks all the boxes: structure, zone, confirmation, and a clean RRR.
🚀 Tag a trader who loves tight stop, high-RR plays.
📲 Follow @ChartNinjas88 for more Smart Money scalps & swing setups!

Gold - Just Half Way To The Target!Gold ( TVC:GOLD ) still has a lot more upside potential:
Click chart above to see the detailed analysis👆🏻
Over the past couple of months, we saw an almost incredible breakout rally of about +75% on Gold. However, looking at technicals, there is a quite high chance that Gold will actually rally even more and retest the next upper resistance trendline, which would mean another pump of about +75%.
Levels to watch: $4.000
Keep your long term vision,
Philip (BasicTrading)

Gold - Heading Higher For Another +30%!Gold ( TVC:GOLD ) won't stop any time soon:
Click chart above to see the detailed analysis👆🏻
Back in 2015 we witnessed a significant rounding bottom formation on Gold, starting the next major bullrun. With the all time high breakout back in the end of 2023, this rally was just confirmed and after the recent trendline breakout, Gold can still head much much higher.
Levels to watch: $4.000
Keep your long term vision,
Philip (BasicTrading)

ETH - LOWER LOWS incoming - SELL OFF CONTINUESETH - Lower Lows possibly ahead given current BEARISH MARKET STRUCTURE.
From the break out below the channel, to the RETEST & CONTINUATION of BEARISH MOMENTUM / SELLS - there is a high chance these Red Candles will extend to the next PYSHC LEVEL OF 1,250
1,000 &
POSSIBLY TOUCH 750.
From there I'd prefer not to predict but I would not be surprised of a massive Bull Run off of those KEY LEVELS.
SAFE SL - ABOVE 2,000
TP1 - 1,674 - HIT
TP2 - 1,250
TP 3 - 800

AUDUSD bullish continuation still to expect
FX:AUDUSD we are have break of CHANNEL, break of long trend line, price is make revers, now its on strong sup zone and from here new bullish push expecting.
USD showing self weak still, continuation expecting, +we are not see some special moves here.
SUP zone: 0.62500
RES zone: 0.64400, 0.64900, 0.65400

TataSteel , 1WThe Channel Pattern Breakout is looking very Good ,
we can consider this Breakout at this point also because it is at 20 EMA Support
if you are not Confident wait for Proper Retest to enter or if you want to take some risk then You can Enter at this Place .
Follow For More Ideas like this Swing Trade Ideas

AUDNZD strong bullish expectations
AUDNZD pair which I am watching last 5 months, other my analysis on AUDNZD are attached, plus I am attach and CADCHF analysis its interesting to look, its almost same based on SYMMETRICAL TRIANGL.
AUDNZD price is make bounce on trend line, its break upper trend line-SYMMETRICAL TRIANGL, plus CHANNEL on 4h TF is visible and its also breaked.
Technicalls on medium and long term are strong bullish, when take all this parameters i am here still bullish.
SUP zone: 1.09200
RES zone: 1.11500, 1.12400

Gold - This Breakout Will Lead To $5.000!Gold ( TVC:GOLD ) is preparing a major breakout:
Click chart above to see the detailed analysis👆🏻
For more than one and a half decades, Gold has been respecting the structure of a rising channel pattern with one exception. Back in 2010 we saw a bullish breakout followed by a parabolic rally and as we are speaking, Gold is starting to break out of the channel once again.
Levels to watch: $2.900, $5.000
Keep your long term vision,
Philip (BasicTrading)

Ethereum - This Chart Just Doesn't Lie!Ethereum ( CRYPTO:ETHUSD ) remains in a bullish market:
Click chart above to see the detailed analysis👆🏻
Over the past three days - since the beginning of February - Ethereum "crashed" about -20% and we saw a significant manipulation last night with Ethereum crashing -25% in a matter of minutes. Looking at the chart though, this price behaviour was not unexpected at all.
Levels to watch: $2.000, $4.000
Keep your long term vision,
Philip (BasicTrading)

AAVEUSDT Breakdown Imminent ? Bearish Setup AAVE/USDT perpetual contract on the 2-hour timeframe presents a descending channel formation in the. The price has been respecting the upper and lower trendlines, showing multiple rejections at both levels. Currently, the price is testing the lower boundary of the channel, and a breakdown could trigger further downside momentum.
The short setup suggests a bearish continuation if the price breaks below the lower trendline. The entry point is positioned around the 264.57 level, with a stop-loss placed above the recent swing high to manage risk. The take-profit zone is projected toward 221.84, aligning with the next significant support level.
Key factors to consider
The price is forming lower highs and lower lows, confirming the downtrend structure.
The red zone represents the stop-loss area, ensuring risk management in case of reversal.
The blue zone marks the potential profit-taking region, which aligns with a strong demand zone.
If a breakdown occurs with strong bearish volume, it could accelerate the move toward the target zone.
A potential retest of the broken support level could offer additional confirmation before further downside.
Traders should monitor volume and market sentiment before entering the trade, ensuring that bearish momentum supports the continuation of the trend.

EURUSDHey Traders, what you think of this trade?
Price has broken the bearish channel.
Price retraced to yesterday low demand zone and bouncing to this week high to test or break.
Thank you
