Channelbreak


BTCUSD Bull 3000 test - break out of down channelWe've just broken out of the down channel by C, D, that came to be as a result of the coiling by the triangle formation after first pull back from 3000, lines A and B. So, this will be the last leg of the trade from
Ichimoku on 1,5,15,30min have crossed over and candles are punching out through the wall of the channel, pointing up and away. There is of course still a risk that we pull back into the down channel, but ... nah. I don't see that happening. Too much FOMO going on for that. We are doing the last crossings of the channel wall now due to the immense volatile nature of BTCUSD and the many swing traders.
Its important that we cross through the blue resistance line as that's the past top. We've already established a "higher low" of the bigger picture with our touching of 2200 forming a trend line F, but we must now also establish a higher high at 2770.. set alarms here! If we don't, then this will turn bearish very fast for another test downwards, so this will be critical. I will take profit at 2770 for sure and wait and see until north of there.
MACD and RSI on 4hr scale has plenty of gas to give for pedal to the metal type of action full throttle, let's go up. The velocity could either be that of the past 3000 rally or that of the past up trend, line B.
The Ichimoku 4hr and 1day will follow soon enough as we pierce upwards. Now its only a question how far and fast which is mostly determined by the momentum available from RSI - i.e.. you guys out there being bullish buyers - but the setup is clear. BTCUSD want's to test 3000. Its like a child and candy - there's just no control ;-) ... it will be driven by FOMO and all the good news lately of various governments establishing blockchain projects, India regulating bitcoin etc. etc. (I'm hoping to go there and check it out - PM me!).
I went long shortly after we broke out at 2420 and unless I feel like swing trading on the potential Elliott waves and other ABCDE zig zags MACD type of stuff - maybe 5-15min scalping on EMA just to play with timing skills ... then I will stay long.
All other crypto pairs are clearly correlated to BTCUSD so they will follow suit +/- as the BTC is the main wealth creator until ETH takes over.
Have a nice ride and as always - the above is contingent on probabilities easiest modelled by Fibonacci Retracements and of course that none of the ICOs currently ending their fundraising period aren't 100% scams or crash and burn type of things. That could shed away a lot of new investors.
Hedge Fund: finally - some friends and I are starting a hedge fund with these trade setups as model. PM me, just FYI.
BITFINEX:BTCUSD

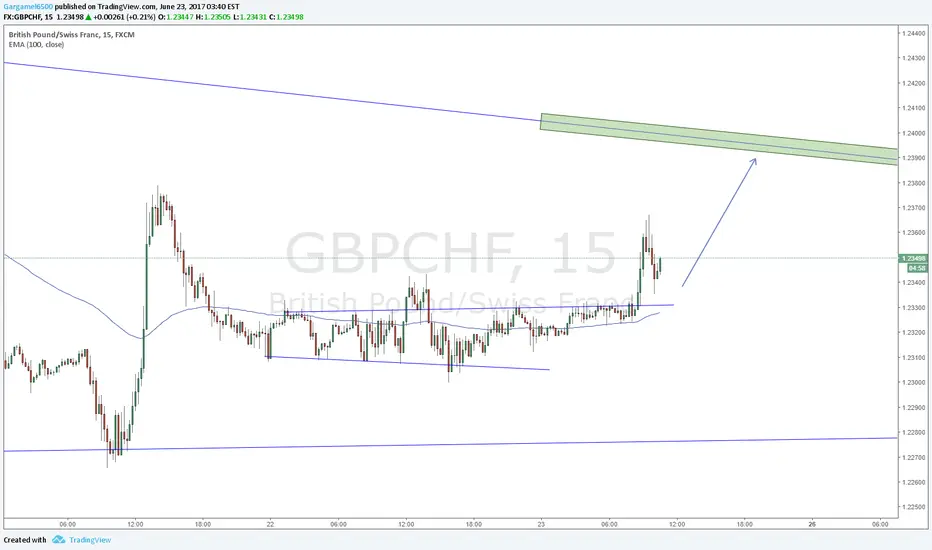
GBPCHF Trend ContinuationConsolidation breakout + break of 15 and 30 min 100 EMA.
Target trend line 4h chart.
EURUSD Two Trades1. Short term trend continuation setup; waiting for break of trend line
2. Breakout of channel, waiting for retest and confirmation that price will move lower.

Triangle pattern with target in ResistanceLooking at a pattern that forms in trednphases, Triangle (sometimes in form of channels, wedges or flags)
These triangles tend to breakout into the direction of the underlying trend (here long) for more or less the same distance than the initial impulse move. In my understanding the psychology is somewhat like the ABCD pattern. So here we chase the D point. Looking at a 100% projection of A to B we see that this harmonic move ends in a Swing High resistance wich acts like a magnet to price action.
Personally, I am not waiting anymore for the price to breakout of such triangle becasue most potential profit will be gone so I postioned now.
Once the Target is hit, we will change side and be sellers going for a retracement bounce out of resistance.

Break of Channel on RBA meet?GBPAUD is trading in a channel since long time and is trying to push on the upside.
While looking at the strength of the bulls and the resistance to take support it is likely that it may break on the upside on RBA rate meeting!
Due to the uncertain nature of markets, enter according to the price action.


USDJPY Wedge Pattern UpdateRetest of old support. Bearish divergence 30 min, 1h, 2h chart.
Will look for a break of the trend channel.

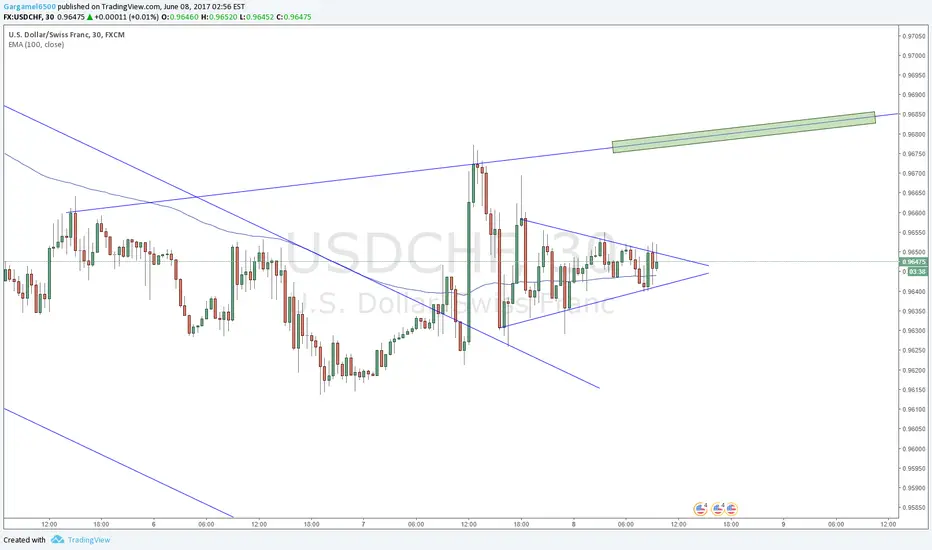
USDCHF Channel Breakout+TriangleTriangle has formed after channel-break, consolidating at 30 min 100 EMA. Waiting for a breakout, should it break out to the upside-> targeting trend line or 2h 100 EMA.
short audusd we have breakout this up channel.
we have triangle here .
we can sell now or after breakout this triangle,
i prefer w8 for breakout.


XRP potential breakout and new trend.What a pattern breakout, then a channel breakout could look like. A buy on channel breakout confirmation, hold til 25k.

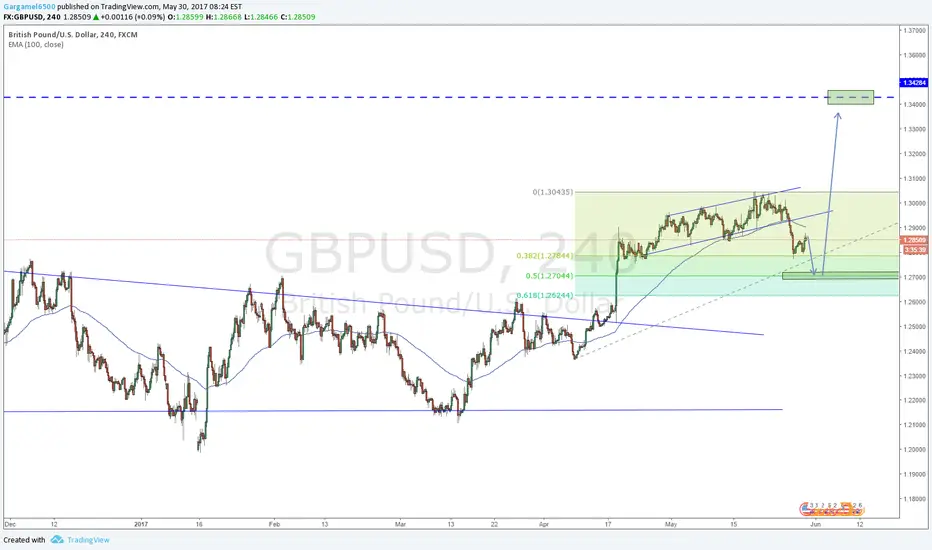
GBPUSD Two TradesShort: Channel breakout, retested 100 EMA in 1h chart. Target: EMA D or Fib. 50%
Long: Rejection of 100 EMA in D chart, after wedge breakout. Target: Structure resistance
XRP longshot inverse h&s and channel break.At best 50/50 and I'm not a fan of h&s on this time frame, but XRP is going to pop soon, just a matter of catching the setup when it does.

AUDUSD Channel Break + Double TopWill watch out for news in an hour and hopefully get an opportunity to trade.

NZDJPY - Potential Breakout of Sideways Channel One of the pairs looked at in tonight's video was the NZDJPY which features a sideways channel directly after creating a new structure high. As I mentioned to our traders, both simple & advanced pattern formations don't necessarily have very high win rates. In fact, i would argue that most strategies, in general, don't complete at the levels that you here certain internet guru's bragging about.
The real gem to setups like this are the risk-reward that is given and as you can see, in a situation like this that offers an 8:1 ratio....you don't really have to be right that often to be profitable.
*Obviously the risk reward levels on this chart are just ideas & not actual levels that you should put your entries, stops & targets at*
Akil


USDCAD break below channelPrice broke below the consolidation channel, has retest the broken structure and took the heading to the lower structure


EURJPY Channel Breakout Lower highs in 1h chart, channel Breakout, bearish engulfing candlesticks in 4h chart.
Seems possible that the megaphone (link below) retest is going to happen.

