Buy GBP/CAD UK GDPThe GBP/CAD pair on the M30 timeframe presents a potential buying opportunity due to a recent upward breakout from a well-defined bullish channel pattern. This breakout suggests a shift in momentum towards the upside and a higher likelihood of further price gains in the coming hours.
Key Points:
Buy Entry: Consider entering a long position (buying GBP/CAD) above the broken resistance level of the channel, ideally around 1.7120 after confirmation of the breakout. This offers an entry point close to the perceived shift in momentum.
Target Levels: Initial bullish targets lie at the following points, based on the channel and recent price movement:
1.7181: This target is obtained by measuring the height of the channel (from the base to the breakout point) and adding that distance to the breakout price.
1.7215: This is a further extension of the upside target, based on roughly twice the height of the recent price movement before the breakout.
Stop-Loss: To manage risk, place a stop-loss order below the broken resistance line of the channel, ideally with some buffer around 1.7105. This helps limit potential losses if the price unexpectedly reverses and breaks back downwards.
Thank you.
Channelbreak

Sell USDJPY Channel BreakoutThe USD/JPY pair on the M30 timeframe presents a potential shorting opportunity due to a recent downward breakout from a well-defined bearish channel pattern. This breakout suggests a shift in momentum towards the downside and a higher likelihood of further declines in the coming hours.
Key Points:
Sell Entry: Consider entering a short position (selling USD/JPY) below the broken support level of the channel, ideally around 155.60 after confirmation of the breakout. This offers an entry point close to the perceived shift in momentum.
Target Levels: Initial bearish targets lie at the previous support levels within the channel, now acting as potential resistance zones:
154.74: This represents the first level of support within the channel.
154.27: This is a further extension of the downside target, based on the height of the recent price movement before the breakout.
Stop-Loss: To manage risk, place a stop-loss order above the broken support line of the channel, ideally around 156.60. This helps limit potential losses if the price unexpectedly reverses and breaks back upwards.
Thank you

Nvidia - Another push higher from here?Hello Traders and Investors, today I will take a look at Nvidia .
--------
Explanation of my video analysis:
Nvidia stock has been trading in a rising channel formation for a couple of years. We saw the last retest of support in the beginning of 2023 which was followed by an unbelievable rally of 625% towards the upside. At the moment Nvidia is retesting the upper resistance but we might see a retest of the psychological $1.000 level first and then a correction.
--------
Keep your long term vision,
Philip (BasicTrading)

Sell EURCAD Channel BreakoutThe EUR/CAD pair on the M30 timeframe presents a potential shorting opportunity due to a recent downward breakout from a well-defined bearish channel pattern. This breakout suggests a shift in momentum towards the downside and a higher likelihood of further declines in the coming hours.
Key Points:
Sell Entry: Consider entering a short position (selling) below the broken support level of the channel, ideally around 1.4730 after confirmation of the breakout. This offers an entry point close to the perceived shift in momentum.
Target Levels: Initial bearish targets lie at the previous support levels within the channel, now acting as potential resistance zones:
1.4677: This represents the first level of support within the channel.
1.4645: This is a further extension of the downside target, based on the height of the recent price movement before the breakout.
Stop-Loss: To manage risk, place a stop-loss order above the broken support line of the channel, ideally around 1.4745. This helps limit potential losses if the price unexpectedly reverses and breaks back upwards.
Thank you.

Buy BTCUSDT Channel BreakoutThe BTC/USDT (Bitcoin) pair on the M30 timeframe presents a potential buying opportunity due to a recent upward breakout.
Key Points:
Buy Entry: Consider entering a long position (buying) above the broken resistance level of the channel, ideally around 5900 after confirmation of the breakout. This offers an entry point close to the perceived shift in momentum.
Target Levels: Initial bullish targets lie at the following points, based on the channel and recent price movement:
62274: This target is obtained by measuring the height of the channel (from the base to the breakout point) and adding that distance to the breakout price.
63830: This is a further extension of the upside target, based on roughly twice the height of the recent price movement before the breakout.
Stop-Loss: To manage risk, place a stop-loss order below the broken resistance line of the channel, ideally around 56500. This helps limit potential losses if the price unexpectedly reverses and breaks back downwards.
Thank you.

Sell GBPCHF Channel BreakoutThe GBP/CHF pair on the M30 timeframe presents a potential shorting opportunity due to a recent downward breakout from a well-defined bearish channel pattern. This breakout suggests a shift in momentum towards the downside and a higher likelihood of further declines in the coming hours.
Key Points:
Sell Entry: Consider entering a short position (selling) below the broken support level of the channel, ideally around 1.1500 after confirmation of the breakout. This offers an entry point close to the perceived shift in momentum.
Target Levels: Initial bearish targets lie at the previous support levels within the channel, now acting as potential resistance zones:
1.1430: This represents the first level of support within the channel.
1.1395: This is a further extension of the downside target, based on the height of the recent price movement before the breakout.
Stop-Loss: To manage risk, place a stop-loss order above the broken support line of the channel, ideally around 1.1515. This helps limit potential losses if the price unexpectedly reverses and breaks back upwards.
Thank you.

Sell EURCAD Channel BreakoutThe EUR/CAD pair on the M30 timeframe presents a potential shorting opportunity due to a recent downward breakout from a well-defined bearish channel pattern. This breakout suggests a shift in momentum towards the downside and a higher likelihood of further declines in the coming hours.
Key Points:
Sell Entry: Consider entering a short position (selling) below the broken support level of the channel, ideally around 1.4660 after confirmation of the breakout. This offers an entry point close to the perceived shift in momentum.
Target Levels: Initial bearish targets lie at the previous support levels within the channel, now acting as potential resistance zones:
1.4616: This represents the first level of support within the channel.
1.4588: This is a further extension of the downside target, based on the height of the recent price movement before the breakout.
Stop-Loss: To manage risk, place a stop-loss order above the broken support line of the channel, ideally around 1.4682. This helps limit potential losses if the price unexpectedly reverses and breaks back upwards.
Thank you.

Buy EURAUD Channel Breakout The EUR/AUD pair on the M30 timeframe presents a potential buying opportunity due to a recent upward breakout from a well-defined bullish channel pattern. This breakout suggests a shift in momentum towards the upside and a higher likelihood of further gains in the coming hours.
Key Points:
Buy Entry: Consider entering a long position (buying) above the broken resistance level of the channel, ideally around 1.6300 after confirmation of the breakout. This offers an entry point close to the perceived shift in momentum.
Target Levels: Initial bullish targets lie at the previous resistance levels within the channel, now acting as potential support zones:
1.6402: This represents the first level of resistance within the channel.
1.6456: This is a further extension of the upside target, based on the height of the recent price movement before the breakout.
Stop-Loss: To manage risk, place a stop-loss order below the broken resistance line of the channel, ideally around 1.6290. This helps limit potential losses if the price unexpectedly reverses and breaks back downwards.
Thank you

Buy XAUUSD Channel BreakoutThe XAU/USD pair (spot gold) on the M30 timeframe presents a potential buying opportunity due to a recent upward breakout from a well-defined bullish channel pattern. This breakout suggests a shift in momentum towards the upside and a higher likelihood of further price increases in the coming hours.
Key Points:
Buy Entry: Consider entering a long position (buying) above the broken resistance level of the channel, ideally around 2320 after confirmation of the breakout. This offers an entry point close to the perceived shift in momentum.
Target Levels: Initial bullish targets lie at the following points:
2373: This represents the height of the channel, measured from the channel's base (opposite trendline) to the breakout point, projected upwards from the breakout.
2410: This is a further extension of the upside target, based on the height of the recent price movement before the breakout.
Stop-Loss: To manage risk, place a stop-loss order below the broken resistance line of the channel, ideally around 2290. This helps limit potential losses if the price unexpectedly reverses and breaks back downwards.
Thank you.

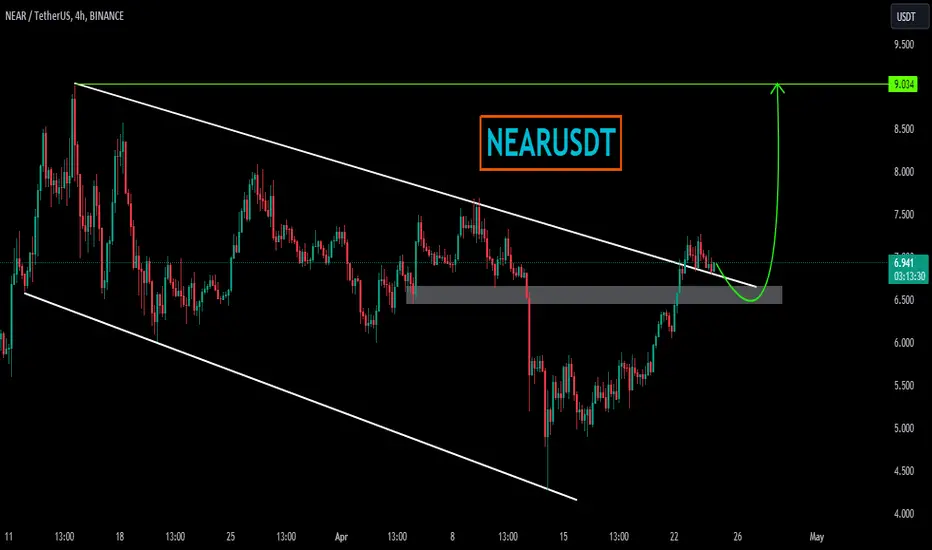
NEARUSDTNEARUSDT was trading under the declining trendline. The price was reacting well the support and resistance of trendline
Currently the price has given the breakout from declining trendline with confluence to strong bullish divergence and now seems like the bulls are getting ready for some strong upside movement.
If the bulls sustain to upside the optimum target could be 9.5
What you guys think of this idea?
Sell CHFJPY Channel BreakoutThe CHF/JPY pair on the M30 timeframe presents a potential shorting opportunity due to a recent downward breakout from a well-defined channel pattern.
Potential Short Trade :
Entry: Consider entering a short position (selling) below the broken support line of the channel after confirmation. Ideally, this would be around 169.90 or lower if the price continues to decline.
Thank you.

80% move up on VUL?VUL has broken out of descending wedge and has also broken out of a channel going back to mid 2023 with bullish RSI divergence. It is now retesting strong support of the channel trend and previous swing high if it can make a higher low here we will be off to the races 🚀 Good luck 🍀

Buy GBPCAD Channel BreakoutThe GBP/CAD pair on the M30 timeframe presents a potentially interesting situation with a bullish channel breakout pattern.
Potential Long Trade :
Entry: Above the broken resistance line of the channel, ideally around 1.7175 after confirmation.
Target Levels:
1.7244: This represents the height of the channel, measured from the apex (highest point) to the base (opposite trendline), projected upwards from the breakout point.
1.7272: This is a further extension of the upside target, based on the height of the recent price movement.
Stop-Loss: Place a stop-loss order below the broken resistance line of the channel, ideally around 1.7145. This helps limit potential losses if the price fails to break out and reverses downwards.
Thank you

SPY Channel BreakThe S&P500 opened and closed below the lower support line of an uptrend channel. This in itself is excuse to sell or go short, but generally you want to see 2-3 days of price below or above a channel before considering it a trend shift. Most likely first level of price support to watch for if price does head lower is $500. Nice round number and a psychological level for traders especially going into the end of the week. If bulls are still serious about the bull market they'll defend $500.
The PPO trend indicator shows the green PPO line trending below the purple signal line which indicates a short-term bearish bias in price. The trend would be considered bearish in the medium to long-term if both lines cross below the horizontal 0 level.
The TSI momentum indicator shows the green RSI line trending below the purple signal line which indicates a short-term neutral trend or slowdown in momentum. The RSI line crossing below the horizontal 50 level also indicates a short-term slowdown in momentum. The green RSI line is also trading below its lower Bollinger Band; in general you want to be short when the RSI line is below the lower BBand.
With the hot inflation numbers that came out traders are probably starting to realize that there likely won't be a rate cut by the Federal Reserve in June, and maybe no cuts at all this year. The Fed is responsible for maintaining steady prices and low unemployment. Until unemployment rises the Federal Reserve is not likely to cut rates with persistent inflation.

Gold's Ultimate Destination: Breaking Down Critical Levels
Trend
-- The price has surpassed the healthy channel from the end of 2022.
-- It is possible that the momentum move is nearing its end and entering an overbought zone.
100% Symmetrical Projection: Uptrend "N" Patterns
There are two "N" Patterns: a Large Purple N and a Small Orange N.
N Pattern's Target Price & Fibonacci Price Cluster
-- The target price of $2356 (Orange N) almost perfectly aligns with two other Fibonacci levels.
-- The target price of $2480 (Purple N at 1.5X) matches with two other Fibonacci levels.
To determine the significance of each target price, a Fibonacci retracement was conducted:
-- Testing from $1810.4 to $2356 (Orange N): few validated price reactions to key levels were observed.
-- Testing from $1984 to $2480 (Purple N at 1.5X): minimal price reaction to key levels was observed.
Conclusion
-- The $2356 target price (Orange N) represents a critical pressure level and may serve as the main target price of this momentum move.
-- In other words, for the momentum to continue, the price must surpass the critical pressure level at $2356.
-- At that point, we will then turn our attention to the second target price of $2480.
Not Financial Advice
The information contained in this article is not intended as, and should not be understood as financial advice. You should take independent financial advice from a professional who is aware of the facts and circumstances of your individual situation.

Sell XAUUSD Channel BreakoutThe XAU/USD (spot gold) pair on the M30 timeframe presents a potential shorting opportunity due to a recent downward breakout from a well-defined bullish channel pattern. However, a cautious approach is advised due to gold's safe-haven status.
Why Caution is Advised:
Gold's Safe-Haven Status: Geopolitical tensions, economic uncertainty, or risk-off sentiment can trigger sudden buying sprees in gold, potentially invalidating the short trade.
Sell Entry: Below the broken support level of the channel, ideally around 2290. This offers an entry point close to the perceived shift in momentum.
Target Levels:
2265: This represents the previous resistance level within the channel, potentially acting as initial resistance now.
2248: This is a further extension of the downside target, based on the height of the recent price movement.
Stop-Loss: Place a stop-loss order above the broken resistance line of the channel, ideally around 2307. This helps limit potential losses if the price unexpectedly rallies.
Thank you.

Buy GBPJPY Channel BreakoutThe GBP/JPY pair on the M30 timeframe presents a potential buying opportunity due to a recent upward breakout from a well-defined bullish channel pattern. This suggests a shift in momentum towards the upside and a higher likelihood of further gains in the coming hours.
Key Points:
Buy Entry: Consider entering a long position (buying) above the broken resistance level of the channel, ideally around 190.50. This offers an entry point close to the perceived shift in momentum.
Target Levels: Initial bullish targets lie at the previous resistance levels within the channel, now acting as potential support zones:
191.25: This represents the first level of resistance within the channel.
191.61: This is a further extension of the upside target, based on the height of the recent price movement before the breakout.
Stop-Loss: To manage risk, place a stop-loss order below the broken resistance line of the channel, ideally around 190.25. This helps limit potential losses if the price unexpectedly reverses and breaks back downwards.
Thank you.

Sell USDCAD Channel BreakoutThe USD/CAD pair on the M30 timeframe presents a potential selling opportunity due to a recent downward breakout from a well-defined bearish channel pattern. This suggests a shift in momentum towards the downside and a higher likelihood of further declines in the coming hours.
Key Points:
Sell Entry: Consider entering a short position (selling) below the broken support level of the channel, ideally around 1.3580. This offers an entry point close to the perceived shift in momentum.
Target Levels: Initial bearish targets lie at the previous support levels within the channel, now acting as potential resistance zones:
1.3530: This represents the first level of support within the channel.
1.3511: This is a further extension of the downside target, based on the height of the recent price movement before the breakout.
Stop-Loss: To manage risk, place a stop-loss order above the broken support line of the channel, ideally around 1.3590. This helps limit potential losses if the price unexpectedly reverses and breaks back upwards.
Thank you

#CADCHF bullish continuation moveIn the 4-hour timeframe, it seems like the long-term corrective move that started last month on the same day is over, suggesting that we could expect more bullish moves in this pair.
If you've found this analysis helpful, please take a moment to like, comment, or share your thoughts with me.

VINC continuation play LONGHere on the 30-minute chart is my idea for the continuation of my VINC idea posted here before
the current breakout. Price is presently in a consolidation ascending regression channel .
The choices for a play are to wait for a break above or below the channel or alternatively
play the price action inside the channel. Since price is currently at the bottom of the channel
I will go long with a stop loss under the channel. Upon reaching the top of the channel I will
close half the position and then watch for a break of resistance or a rejection down and then
trade accordingly. Overall, I believe that this is a high-tight flap pattern and VINC is
accumulating gradually and will move higher when the accumulation saturates as per
Wychoff's theory.

QQQ Falling Out of Channel on Quad Witching DayQQQ is down over 1% today and falling out of the channel it's been in since October. It's quad witching today so could not be a coincidence that the market might be changing phases. An obvious spot for support would be the 50 EMA down between $425-$427.

#AUDUSD inverted Head & Shoulder patternNot only price managed to break above long term bearish daily channel but also seems like price completed a reverse head & shoulder pattern by breaking above the neckline as you can see in the chart.
As a result we can expect to have a bullish continuation move at least towards the bearish trendline on red.
Pull back to the broken neckline would be most favorable setup to go long in this pair.
If you've found this analysis helpful, please take a moment to like, comment, or share your thoughts with me.

Sell USDCHF Channel BreakoutThe USD/CHF pair on the M30 timeframe presents a potential selling opportunity due to a recent downward breakout from a well-defined bearish channel pattern. This technical setup suggests a shift in momentum towards the downside and a higher likelihood of further declines in the coming minutes or hours.
Key Points:
Sell Entry: Consider entering a short position around the current price of 0.8830, positioned close to the breakout level. This offers an entry point near the perceived shift in momentum.
Target Levels: Initial bearish targets lie at the previous support levels within the channel, now acting as potential resistance zones: 0.8798 and 0.8770. Further downside targets could be determined using other technical analysis methods like Fibonacci retracements or extensions.
Stop-Loss: To manage risk, place a stop-loss order above the broken support line of the channel, ideally around 0.8855. This helps limit potential losses if the price unexpectedly reverses and breaks back upwards.
Thank you
