Amd - This starts the next +200% rally!Amd - NASDAQ:AMD - is preparing a major rally:
(click chart above to see the in depth analysis👆🏻)
It has - once again - not been unexpected at all that we now see a major reversal rally on Amd. After the harsh drop of about -65%, Amd retested a significant confluence of support and already created bullish confirmation. It is quite likely that this now starts the next bullrun.
Levels to watch: $100, $300
Keep your long term vision!
Philip (BasicTrading)
Channeltrend

BERGEPAINT at Best Support !!This is the Daily Chart of BERGEPAINT .
BERGEPAINT having good law of polarity at 540-545 range.
EMA is also providing support for the stock around the 545 range.
If this level is sustain the , We may see higher price in BERGEPAINT.
Thank You !!

BAJAJ FINANCE 's Key Resistance Zone This is 4 hour chart of BAJAJ FINANCE
BAJAJ FINANCE having good Resistance at 9800 and 10200 range.
If this level is sustain , then we may see lower prices in BAJAJ FINANCE.
Thank You !!

BAJAJ HOUSING FINANCE at Support Zone !!This is the Daily chart of BAJAJ HOUSING FINANCE .
BAJAJHFL is trading near in an ascending parallel channel and it's Support zone at 116-120 range.
If this level is sustain , then we may see higher in the BAJAJHFL.
Thank You !!

Make it Break it Situation!FCCL Closed at 46 (25-03-2025)
Bearish Divergence is there.
Important to Sustain 45.80 at least
on Weekly basis for upside move.
Otherwise, Important Support levels seems
to be around 43.30 - 43.50 & then 41.30 - 41.50.
41.30 - 41.50 is also a Channel bottom that can
be respected.
Upside move can be up to 49 -50 initially &
Channel top is around 52.

MPHASIS at Key Zone !!This is Daily chart of MPHASIS.
MPHASIS having a good law of polarity at 2700-2720 range.
If MPHASIS gives a breakout, the potential upside targets are 2,840 and 3,000 levels.
If L.O.P is sustain then , we may see lower prices in MPHASIS.
Thank You !!

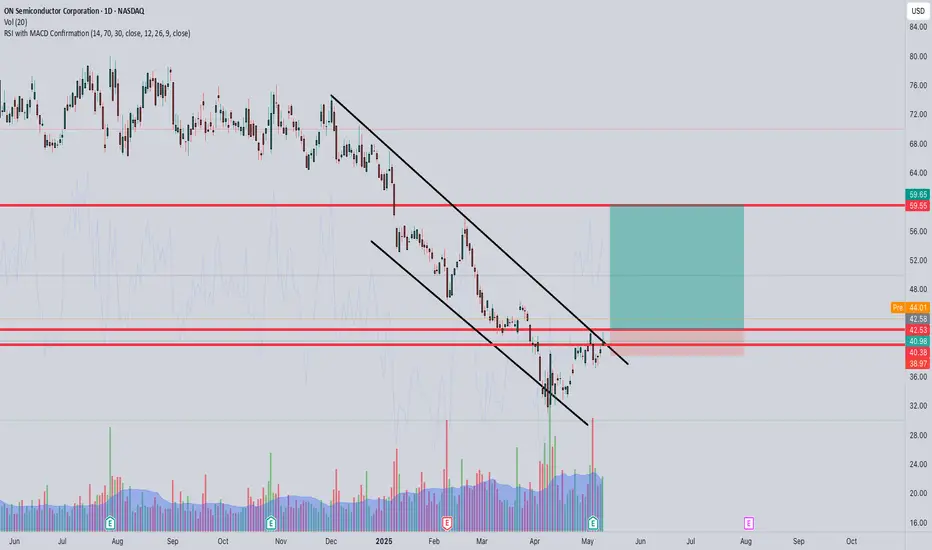
ON is on!!We are opening at 44 which is the contracts the flow picked up (once again they were right)
But this chart is showing a lot of potential, as we broke above the trendline, i will watch 45 for an entry with a possible $60 target
TSLA: Uptrend channel bounce, trading between 50 and 200-day SMAHey guys/gals!
So we all know that Tesla took a massive drop last week. It fell about 14%, and was down even 3% after hours at one point. I think we can all agree this crash wasn't technicals driven - it was clearly headline impacted. This was a clear black swan even t, and even in my case, nothing like this has ever happened to me as a trader. It was unforeseeable, forced me to hedge overnight and I'm still having nightmares (lol). Definitely one to remember as I don't think something like this would happen with any other stock. Tesla is truly unique in this sense.
But looking at the bigger picture, the bounce that we experienced on Friday must've been technicals driven, and psychologically influenced, as I am almost certain that the crash was a massive overreaction. People woke up the next day and thought this was severely discounted over a couple social media tweets (I won't go into the politics of things).
As you see on the chart, Tesla may in a new upward channel. At first I figured this may be a bear flag, however due to the upcoming catalyst like the Robotaxi launch - this would likely only be a bear flag if prices crashes below the lower support trend line.
As long as price is within the channel, I'd say things are holding up. We'd likely see a jump towards the upper side of the channel - however it's important to note that $300 and £360 are major resistance points. Robotaxi launch and any future tweets will definitely move price, and I think those will be a factor in determining whether price goes up or crashes below the trend line.
Another thing to point out is that price is currently trading between the 50-day and 200-day moving averages. The 50-day SMA is acting as vital support, whereas the 200-day SMA is the resistance. If there is a break above the 200-day SMA, price will likely go higher. The opposite may happen if price crashes below the 50-day SMA.
Either way, headlines and technicals mentioned above will continue to influence price.
Note: not financial advice.

Intel - This might be the bottom!Intel - NASDAQ:INTC - might create a bottom:
(click chart above to see the in depth analysis👆🏻)
For almost an entire year, Intel has been consolidating at a major horizontal support. Considering the previous significant bloodbath, Intel might soon find its bottom, which is inevitably followed by a major bullish reversal. After all, market structure is slowly shifting bullish.
Levels to watch: $20.0, $25.0
Keep your long term vision!
Philip (BasicTrading)

TATA STEEL at Resistance ZoneThis is Daily Chart of TATA STEEL.
Tata steel having good Law of Polarity at 163-168 range.
If this level is sustain , then We may see lower prices in the stock again.
Tata steel is a good support zone at 125-130 range.
Two EMAs are also supporting the stock, with the first EMA positioned at ₹140 and the second at ₹129.
THANK YOU !!

Nasdaq - The final bullrun breakout!Nasdaq - TVC:NDQ - might break above all structure:
(click chart above to see the in depth analysis👆🏻)
It is quite incredible how volatile stocks have been lately, especially considering that fact that the Nasdaq is about to create new all time highs again. Consequently, we are about to witness a significant structure breakout, which would ultimately lead to another rally of about +30%.
Levels to watch: $21.000
Keep your long term vision!
Philip (BasicTrading)

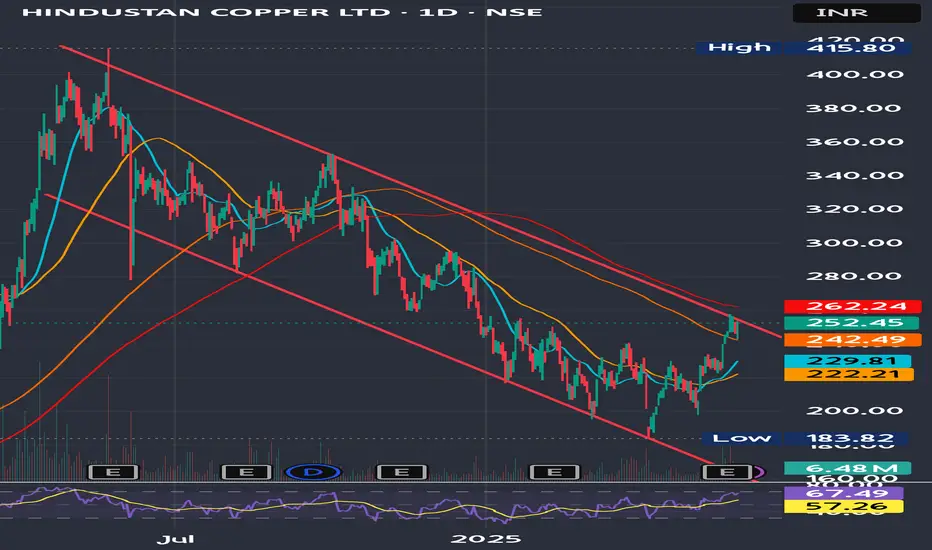
Hindcopper's Channel Breakout DueHindustan Copper Ltd. has recently garnered attention due to its strong financial performance and positive market sentiment.
Stock has broken out above key resistance around ₹240–₹245 with volume support.
Trend: Bullish
Indicators:
RSI ~67 (strong momentum)
MACD positive crossover
Above 50- & 200-DMA
Target Levels (Upside Potential)
Target Level Reason
270 Minor resistance zone (prior supply area)
292–295 Near-term swing high (Feb 2024 levels)
320+ Medium-term breakout target if momentum sustains
Stoploss Levels
Stoploss Type Level
Reason
Tight Stoploss 240 Previous breakout zone
Moderate SL 225 Near 50-day moving average
Positional SL 216 Breakdown confirmation below trend support
Buy on dips strategy around 245 -250 levels
Tesla - Don't get confused right here!Tesla - NASDAQ:TSLA - is about to create the bullish reversal:
(click chart above to see the in depth analysis👆🏻)
2025 has been a rough year for Tesla so far. With a drop of about -50%, Tesla is clearly breaking the average retail trader. But the underlying trend is still quite bullish and if position strategy, risk execution and mindset control are all mastered, Tesla is a quite rewarding stock.
Levels to watch: $275, $400
Keep your long term vision!
Philip (BasicTrading)

Amara Raja Energy & Mobility Limited Trend Reversal On ChartAmara Raja Energy & Mobility Limited, a flagship company of the group, is India’s largest manufacturer of automotive and industrial batteries. The company also produces Li-ion cells and battery packs for electric vehicles and the telecom industry.
At current price it looks very attractive for short term gains .
Short term target may show Up move to 1100 levels and initial support at 996
long term target intact 1700-1860 levels.

Bitcoin - All time highs will come next!Bitcoin - CRYPTO:BTCUSD - prepares a significant move:
(click chart above to see the in depth analysis👆🏻)
Over the past couple of months, we basically only saw sideways price action on Bitcoin. However, this does not mean, that Bitcoin is now slowing down; actually the opposite is true and Bitcoin is setting up for a major move higher. New all time highs will come very soon.
Levels to watch: $100.000
Keep your long term vision!
Philip (BasicTrading)

Bearish Divergence has appeared.
Bearish Divergence has appeared.
Better to wait for a better price
zone and a Support around 134-135
(if it comes).
Channel bottom is around 124 - 125 but
it seems unlikely so far. However, possibility
is still there.

Taking Support from a Strong Trendline
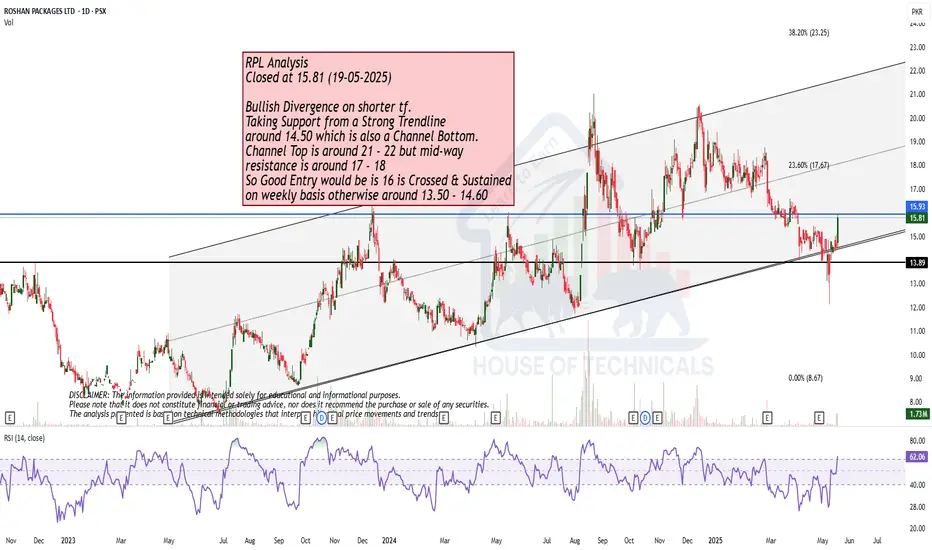
Bullish Divergence on shorter tf.
Taking Support from a Strong Trendline
around 14.50 which is also a Channel Botom.
Channel Top is around 21 - 22 but mid-way
resistance is around 17 - 18
So Good Entry would be is 16 is Crossed & Sustained
on weekly basis otherwise around 13.50 - 14.60
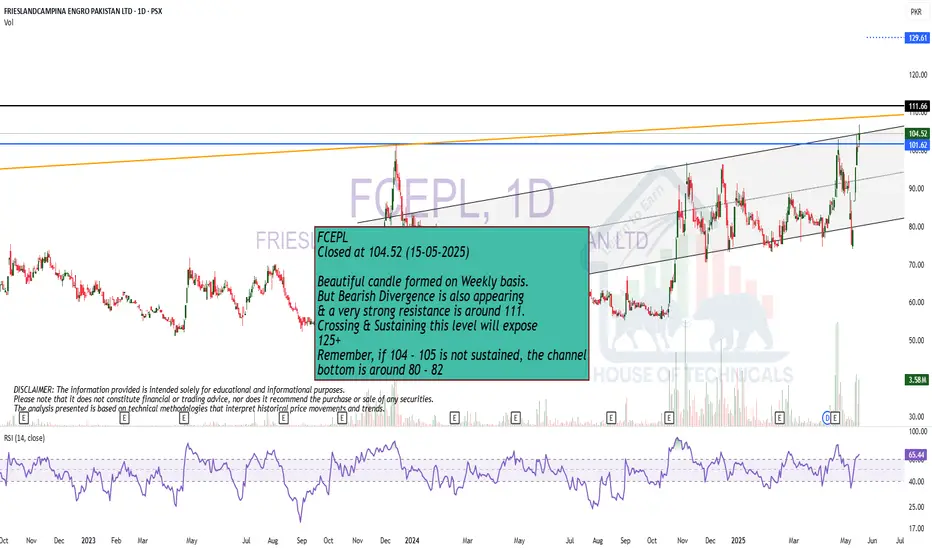
Beautiful candle but Bearish Divergence is also there..
Beautiful candle formed on Weekly basis.
But Bearish Divergence is also appearing
& a very strong resistance is around 111.
Crossing & Sustaining this level will expose
125+
Remember, if 104 - 105 is not sustained, the channel
bottom is around 80 - 82
a Very Strong Weekly Bullish Candle; but
a Very Strong Weekly Bullish Candle; but
there is a Resistance around 240 - 245.
Crossing this level may hit 290+
On the flip side,
though Channel Support s around 165 - 170 but
we also have a Strong Support around 190.

S&P500 - The bottom we have been waiting for!The S&P500 - TVC:SPX - officially created the bottom:
(click chart above to see the in depth analysis👆🏻)
This month we officially saw one of the craziest stock market fakeouts of the past decade. With a drop and reversal rally of about +15%, the S&P500 is about to even close with a green monthly candle, which then indicates that the stock market bottom was created.
Levels to watch: $120, $250
Keep your long term vision!
Philip (BasicTrading)

Monthly Closing above 7.50 - 7.60 will be very healthy!
Monthly Closing above 7.50 - 7.60
would be a very healthy sign.
We may then easily witness upside
towards 8.70 - 9.10 & then 10.50 - 11
Remember it is in a long consolidation
with Slowly moving in an Upward Channel.

GBPNZD | 1H | SELL ZONEHey There,
After reaching my GBPNZD sell level, my target is now 2.23855.
Your likes keep me motivated to share my analyses, and I truly appreciate the support.
Big thanks to everyone showing love

Amazon - Look At This All Time High Retest!Amazon ( NASDAQ:AMZN ) will create the bottom soon:
Click chart above to see the detailed analysis👆🏻
The trend on Amazon is clearly towards the upside and the recent correction of about -30% did not change that at all. Rather, we are now witnessing an extremely bullish all time high break and retest and therefore, if Amazon actually creates bullish confirmation, this could form a bottom.
Levels to watch: $180
Keep your long term vision,
Philip (BasicTrading)
