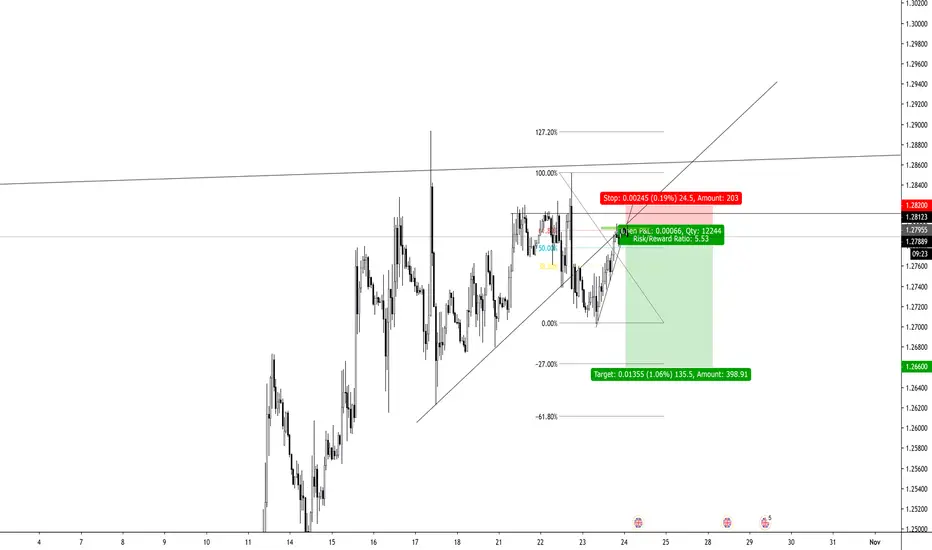
PAIR AUDUSD....ANALISA TEKNIKAL 16-20 DIS,2019FUNDEMENTAL ANALISA :
AUD telah memotong Interest Rate Sebanyak 3 Kali pada tahun 2019 dan 2020 pula ada laporan mengatakan RBA akan memotong lagi dari 0.75% kepada 0.50% . Dijangka AUD akan terus melemah pada tahun 2020. AUD dijangka akan membuat BEARISH TREND berterusan sehingga 2020. Justeru Pair AUDUSD akan meneruskan DOWN TREND (Bearish)....T.Kasih to Ahmad Faizuddin (Mentor Perdagangan Malaysia 2019-2020)
........................................................................................................................................
BBMAOA
MN : RE SELL
WK1 : MHV SELL
D1 : EXTRM SELL
H4 : CAK SELL
ENTRY: Tunggu candle membuat formation RE di TF H4 atau pasang PO SELL layer daripada Mid BB hingga Top BB.
-------------------------------------------------------------------------------------------------------------------------------------------
FIBO RETRACEMENT (FiboCircle)
D1
CS Daily telah reject LEVEL Strong Support (63.8%) dan candel telah tutup dibawah level tsb.
...........................................................................................................................................
SNR + EQ CHANNEL
D1
CS Daily reject strong SNR dan membuat shadow yg panjang.
.........................................................................................................................................
KESIMPULAN:
Sedia sekurang2 dua Strategi Dagangan untuk SELL AUDUSD:
1.SELL 1: SL kotak Merah, TP kotak Hijau
2.SELL 2: SL kotak Merha, TP kotak Hijau
Channeltrend

Twilio Inc. (TWLO) - Put it on your Watchlist!With analysts maintaining a $155 price point for TWLO it'd be in your best interest to keep an eye on this one.
Take your time with your entry and let the stars align. With a beautiful looking retracement following a tight channel, watch for the breakout! Couple this with a crossover of the weekly MACD and generally low RSI and you've got all signals pointing up.

USOIL: A broader look at the last 6 monthsHappy Black Friday oil traders! I hope everyone had a wonderful Thanksgiving! I deleted all of my other channel lines to take a fresh look at what oil has been doing and what to possibly expect for December. I am assuming the US Stock Market is going to boom today because of Black Friday, but I am not sure oil will follow. President Trump is now pushing China on Hong Kong, which they do not like so that may play a factor in oil prices in the short term.
But if we look back on the daily to the lowest close in the last 6 months at $51.06 on June 12th, and then at the highest close of $60.93 on July 11th (a difference of $9.87), discounting the False Positive of the Saudi oil field attack on September 16th, we see a slow narrowing channel. Oil now seems to be hitting resistance in the $58.30 area and it has been a while since we have seen a major correction. That being said, I am expecting December to be a slow month for oil and by the end of the month return to the $53.00 area before going back up.
If this interests you or you agree, please click the like button! Thanks and have a wonderful weekend!

GBPAUD Short SellThe bears managed to keep This down channel in motion and arent showing any signs of slowing down.Thus we can expect price to continue falling at least until its reaches the green zone between 1.85620-1.85318 before expecting bulls to intervene.

Sp500 Enters Bearish ZoneWhat’s up Traders!
Sp500 is getting pretty close to a channel roof where inside bars have been printed last Friday. If we look back 4 trading sessions ago there was a bearish pin bar but there was no volume and also we weren't really in a bearish zone yet IMO.
We also have some wicks to the upside suggesting supply is coming to the market. Just remember that smart money can NOT get rid off their positions quickly due to the size their trades. Therefore they always have to sell in smaller tranches.
I am now looking here to see some bearish price action around 3100$- bearish fakey + high volume would definitely tease me to short it.
Good luck!

EURGBP monthly channel bounce ? looks like a good swing...
I'm not rly a swing trader, so I'm not quite sure what would be the confirmation of this trade and how to trade it ...but it looks like a buy

Cardano. Bullish. Lets pitchfork it!double bottom cup and handle 2nd level support. Either we go down once more or we take off from here.
I call the latter with a nice fake out pull down to the blue eyes or a trend continuation off .04300
Seems we got a lovely double bite spike for a pitchfork high low. This is a good indication we are playing off this for a rising channel. A breakout above this channel makes us very bullish :)


EURUSD is close to 2,5-Years Resistance!EURUSD can bounce from Key Level 1.10212.
We can open Sell after the false breakout.
Potential profit will be in 3...5 times bigger than risk.
Before to trade my ideas make your own analyze.
Write your comments and questions here!
No need to write it in PM.
Thanks for your support!

Gold is in the Channels! At the opening of the market, gold has gapped due to a reaction to the troops that trump sent out after market close and carried on with the uptrend which has formed into channel, rejecting the resistance zone that isn’t on my chart.
Looking to open a sell around the top of channel.

EUR/AUD BUYBuying off the trendline first target is recent swing high second target is top trendline

BTC falling to retest?Looks like BTC will fall to retest the most recent support levels...
Also, my previous EURUSD Long has been closed. Profits were taken & I’m now short, expecting a new weekly low next week... or bounce off the most recent low, at which I will reverse to go long for at least the next month.

EURUSD Trade is in profitI previously posted a LONG entry on the eurusd. Entry was at a 1 min double bottom, just before price crossed & held the pink downward sloping, dashed line. 1st profit target is the purple line, unless the 1st box cannot be passed & price holds above. In which case I’ll exit & reverse for a SHORT to the bottom red line.


USDCHF ShortWait for break (channel)
Short to complete 3 touch flag/ defending channel
daily chart look promising with small tweezer top

P&G- How Micro Patterns Create Long Term Trends: PGIn this illustration, we observe how various micro patterns can translate into a longer-term macro pattern. With the case of PG, for prevailing micro patterns have progressed in what appears to be a bullish rising channel which has recently broken through. As the longer-term trend unfolds, the micro patterns will form in series of periods of high volatility and low volatility. Each pattern gives us an idea into the minds of the collective market consensus. Let’s examine what each pattern tells us in terms of an observational standpoint.
ABCD:
the ABCD pattern is commonly referred to as a reversal pattern. This is because the ABCD typically occurs at key turning points within a stock’s prevailing trend. The ABCD represents between B&C that light selling activity has commenced. The overall formation depicts a weakening of bullish accumulation and that although prices continue to raise exhaustion of buyers will likely proceed.
Rising channel:
The rising channel pattern is a highly reliable pattern that is typically considered one of the safer longer-term patterns to examine. The rising channel is characterized by a series of price changes which occur at intervals in between symmetric areas of support and resistance where the price respects these areas and makes sharp or distinct changes in between the zones. The rising channel displays that traders have a clearly defined consensus of the future value of the security, and that reasonable amounts of selling and buying activity is occurring meaning there is interest and activity and therefore opportunity.
Pennant:
The pennant pattern can occur in numerous phases. Typically, the phases are characterized by the ascending or descending slope of the support or resistance lines. The pennant pattern commonly occurs at consolidation zones or within the boundaries of macro patterns. Tenants represent an overall tightening and narrowing of volatility and can be used to pinpoint key turning points either bullish or bearish regarding the stocks long-term trend.
Symmetric Broadening Wedge:
the symmetric broadening wedge at any point in the stocks long-term trend represents an expansion of volatility. In the case of the symmetric broadening wedge, the battle between the Bulls and Bears is considered more volatile than in the case of a standard broadening wedge. Indicated by the slope of the support and resistance lines, a standard broadening wedge will likely display a flat support or resistance line and a slanted support or resistance line a symmetric broadening wedge displays two sloped lines and therefore demonstrates a maximum expansion of volatility.
By examining the chart of PG, it is much easier to determine that micro patterns do in fact subsequently lead to longer-term macro patterns. PNG appears to be bullish dominated and experiencing increased accumulation over time. Although 2018 was more turbulent than two years prior, 2019 yielded favorable results for the security along with other existing industry leaders.

Anticipating SHORT in EUR/USDCurrent trading levels in EUR/USD. I just got into a quick scalp long. Will reverse & go short at the 1st sign of weakness at the top of this channel or wait for a retest of the current high for a larger move.

Don’t predict. Project & anticipate.There’s no need for a trader to “predict” what future price will be. Though this is entertaining, it’s not practical. As more & more traders begin to see the same picture/projection on their charts, the professional trader’s job is to simply enter & hold, forcing price to move in an AGREED direction at any given time.

Possible BUY on EURUSDBearish channel
Daily pin bar created at daily support
entry on 1.097
target 1.139
safe sl@1.08
alternative sl@1.089


AUDNZD Bullish Channel AUDNZD is moving up nicely so far with in its new created channel, I believe this is still going higher and there is still money to be made here if you play it right.
Buying low at the bottom of the channel can be a good idea if it holds, I have taking profits at the top of the channel and Im looking to reenter at the bottom, if it shows me a buy signal, one of the things I will look for is a increase in buying Volume at the bottom of the channel where it currently is.
If it break down I'm still bullish but in the short term it might make a deeper retracement, AUDNZD if you look back at the past you will see that its very aggressive when going up so im expecting this to be no different.
I hope you found this post valuable.
Best of Luck With Your Trading.
