EUR/USD Bullish Reversal Pattern Targets 1.1695The EUR/USD 30-minute chart shows a completed ABCD harmonic pattern with a sharp bounce from the 1.1600 support zone. Price action suggests a bullish reversal toward the projected target of 1.1695, supported by strong demand at point D and a break above minor resistance. Traders may watch for confirmation on pullbacks before continuation.
1. Pattern Structure – ABCD Harmonic
The chart outlines an ABCD harmonic pattern, with points labeled A, B, C, and D.
Point D aligns with a strong horizontal support level around 1.1600, suggesting a potential reversal zone.
2. Trend Context
The pair had been in an uptrend from August 6–8, followed by a correction forming the ABCD structure.
The correction ended with a sharp drop from point C to D, creating an oversold condition.
3. Support & Reversal Zone
Point D is positioned at a confluence of prior lows and trendline support, increasing the probability of a bounce.
The recent candles show stabilization and early bullish pressure.
4. Projection & Target
The pattern projects a potential upward move toward 1.16952.
This aligns with previous swing highs and offers a realistic short-term bullish target.
5. Trade Implication
A break above minor consolidation near 1.1625 would add confirmation.
Risk management should place stops below 1.1600 in case of a false breakout.
Chartanalysis

Gold Price Eyes Bullish Rebound After Triangle BreakoutGold (XAU/USD) is showing signs of a potential upward reversal after bouncing from the $3,350 support zone. The earlier symmetrical triangle (A-B-C-D) breakout led to sideways consolidation before a retracement. Price action now suggests bullish momentum could target $3,385, with strong support holding near $3,340. A break above the short-term resistance could confirm the rebound toward higher levels.
1. Symmetrical Triangle Breakout – The A-B-C-D pattern indicated price compression, followed by an upside breakout, showing bullish bias.
2. Support Zone – Strong support is established around $3,340–$3,350, holding despite recent selling pressure.
3. Retracement Phase – Price pulled back after peaking near $3,400, creating a lower-high sequence.
4. Bullish Reversal Signal – Recent bounce from support suggests buyers are stepping back in.
5. Upside Target – Immediate resistance lies near $3,385; a break above could lead toward the $3,400 zone.
6. Risk Factor – Failure to hold above $3,340 could open the door for further downside correction.

GOLD - Cut n Reverse Region? Holds or not??#GOLD.. .market just reached at his current major supporting area/region.
That is around 3340-45
Keep close and stay long above that.
NOTE: we will go for cut n reverse below 3340 on confirmation.
Good luck
Trade wisely

GBPAUD: Possible bounce at supportI am watching for a possible reversal GBPAUD, expecting a rejection with a upside target at around 2.073.
This area is where it can become a decision point, either price finds support and bounces, or it breaks below, and the move can start to extend lower.
Just sharing my thoughts for the charts, this isn’t financial advice. Always confirm your setups and manage your risk properly.
Disclosure: I am part of Trade Nation's Influencer program and receive a monthly fee for using their TradingView charts in my analysis.

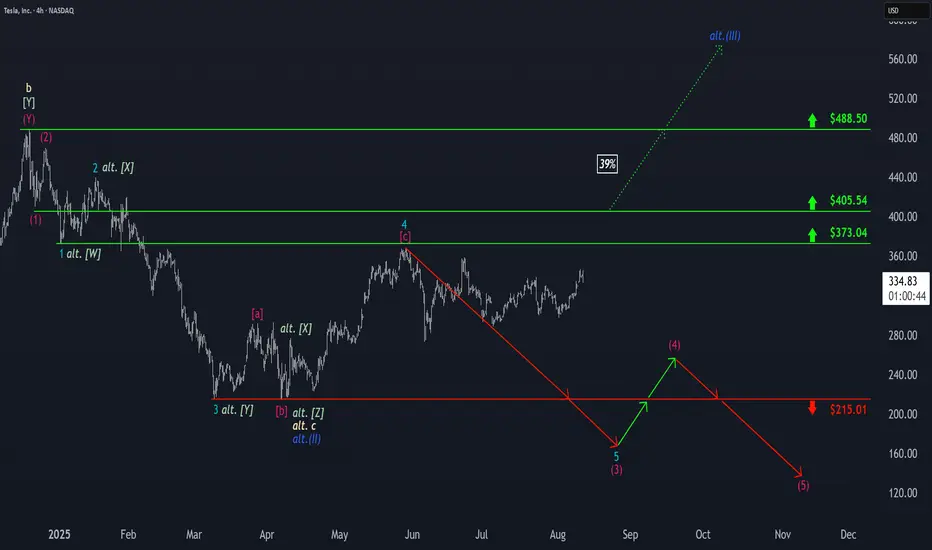
Tesla: Upward Pressure, but Bears May Soon Regain ControlTesla has once again faced upward pressure, which pushed the stock toward resistance at $373.04. However, our primary expectation is that the bears will soon regain control, setting off further sell-offs within the ongoing downward impulse. Step by step, this magenta five-wave move is expected to break below support at $215.01. If price moves above the $373.04 level, our alternative scenario will become significantly more relevant. If the stock even surpasses the higher threshold at $405.54, we will ultimately shift to this alternative view and classify Tesla as being in a sustained uptrend of blue wave alt.(III) , which would extend beyond $488.50. In this 39% likely scenario, wave alt.(II) would already be complete.
XAUUSD Gold Trading Strategy August 12, 2025XAUUSD Gold Trading Strategy August 12, 2025:
Gold prices were under pressure on Monday (August 11) and recovered in the morning trading session today (August 12). US President Trump clearly stated that he would not impose import tariffs on gold, dispelling previous market concerns about disruptions to the global gold supply chain.
Fundamental news: Investors are paying attention to the Federal Reserve's interest rate outlook. Gold is entering a correction phase after tariff concerns are resolved, and price movements may be more influenced by Dollar and inflation data.
Technical analysis: Gold prices continue to correct downwards following the trend from last week, with MA lines still acting as resistance. Currently, the RSI H1 frame is approaching the oversold zone, and there is a high possibility that gold will recover this weekend. Resistance and high liquidity areas such as 3354 - 3359 and 3370 - 3375 will be very good trading areas.
Important price zones today: 3354 - 3359, 3370 - 3375 and 3318 - 3323.
Today's trading trend: SELL.
Recommended orders:
Plan 1: SELL XAUUSD zone 3357 - 3359
SL 3362
TP 3354 - 3344 - 3334 - 3324.
Plan 2: SELL XAUUSD zone 3373 - 3375
SL 3378
TP 3370 - 3360 - 3340 - 3320.
Plan 3: BUY XAUUSD zone 3318 - 3320
SL 3315
TP 3323 - 3333 - 3343 - 3363 (small vol).
Wish you a safe, successful and profitable trading day.🌟🌟🌟🌟🌟

Ethereum Eyes Breakout Toward $4,434 After ConsolidationEthereum (ETH/USD) is consolidating near $4,230 within an upward channel, hinting at a potential breakout toward the $4,434 target. Short-term price action suggests buyers may be preparing for a bullish push after holding above key trendline support.
2. Current Price Zone – Price is hovering around $4,230, holding near the midline of the channel, suggesting support is intact.
3. Bullish Setup – The projected path on the chart shows a short dip followed by a rally toward $4,434, indicating bullish sentiment.
4. Key Resistance – The $4,434 level is highlighted as the next major resistance, aligned with the channel’s upper boundary.
5. Support Zone – The trendline from August 9–10 acts as immediate support, keeping the bullish structure valid.
6. Volume/Volatility Signal – The lightning bolt icon may indicate an upcoming high-volatility event, potentially acting as a catalyst for the move.

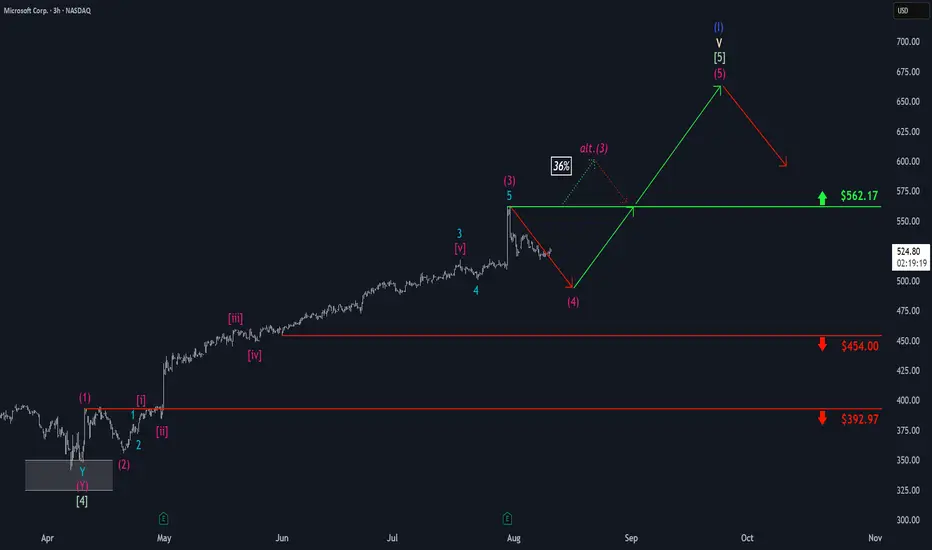
Microsoft: Wave (3) Complete – Wave (4) Pullback in ProgressAs Microsoft has reached a pronounced peak, followed by a notable move to the downside, er now consider wave (3) finished. Thus, we see price currently in the corrective phase of wave (4), which still has some immediate downside potential but should hold above support at $454. The subsequent wave (5) is expected to mark the high of the broader blue wave (I). At this point, we assign a 36% probability to the scenario where wave alt.(3) makes a higher high above the new resistance at $562.17.
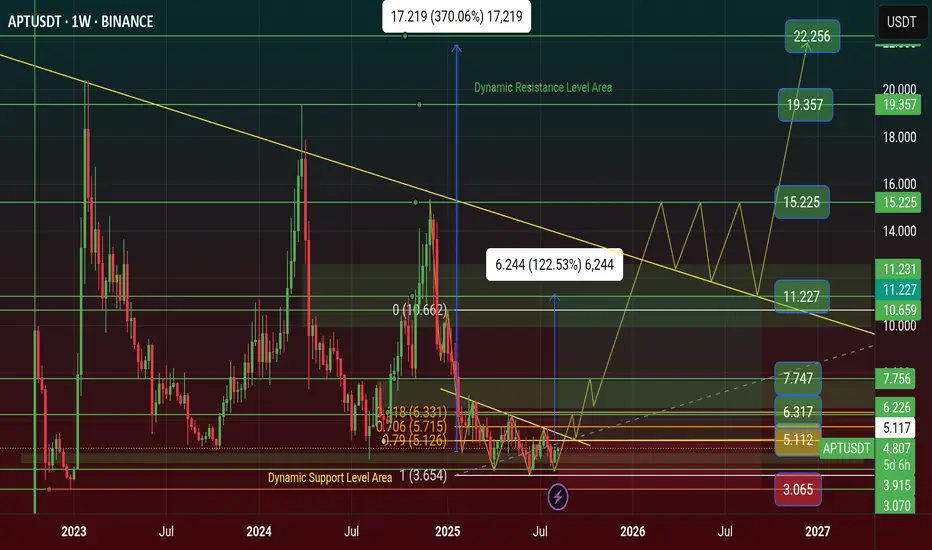
$APT Price Prediction will be reach $22 this Year 2025APT price is Showing Triple Bottom Pattern on Chart. it's a Reversal Pattern for APT price Manipulation. Time for Bull Run on APT and 12 aug unlocked 11.31M APT token and 2.20% of released supply $51.35M Dollar.
APT Price now Bottom area of Major Support Level area. At first the price will Hit $7 and if it's touch $11 price and if it's Breakout this Resistance it will be happened APT $22 Price.
🚦Aptos (APT) - 11.31M Token Unlocked worth of $51.35M - 12 Aug 2025
On 12 August 2025, Aptos will unlock 11.31 million new tokens. This event adds more APT tokens into the market supply at one time. Many traders watch token unlocks because more supply can bring price down if holders decide to sell quickly. Also, if most tokens go to teams or early backers, there might be more selling.
However, if unlocks are well planned and market demand is high, the price may not fall much. This event could be a catalyst for price change based on how the market reacts.
🚦 Aptos’ DEX trading volume reached $9 billion in the first half of the year, and the market value of stablecoins increased to $1.2 billion
PANews reported on August 12th that a Messari report showed that Aptos made significant progress in on-chain performance, DeFi ecosystem, and technological innovation in the first half of 2025. Transaction fees dropped to $0.00052, DEX trading volume reached $9 billion, and the stablecoin market capitalization increased to $1.2 billion.
On the technical side, projects such as Shelby and Decibel were launched to improve network performance. The Aptos Foundation invested $200 million to promote ecosystem development and consolidate its position as a global transaction engine.
🚦 UPCOMING EVENTS APT 11 SEPTEMBER
Total 11.31M APT Token Unlock worth of $54.51M and 2.15% of released supply
#Write2Earn #BinanceSquareFamily #BinanceAlphaAlert #APT #SUBROOFFICIAL
Disclaimer: This article is for informational purposes only and does not constitute financial advice. Always conduct your own research before making any investment decisions. Digital asset prices are subject to high market risk and price volatility. The value of your investment may go down or up, and you may not get back the amount invested. You are solely responsible for your investment decisions and Binance is not available for any losses you may incur. Past performance is not a reliable predictor of future performance. You should only invest in products you are familiar with and where you understand the risks.
XAU/USD Intraday Plan | Support & Resistance to WatchGold is consolidating just under the $3,353 level after yesterdays drop from $3,399.Price is holding below both the 50MA (pink) and 200MA (green), keeping the short-term bias tilted bearish.
If buyers manage to reclaim $3,353 and close back above the 200MA, the first upside target would be $3,380, followed by $3,399 and $3,422 if strength builds.
Failure to reclaim $3,353 could see sellers retest $3,329, then the $3,313-$3,295 Secondary Support Zone. A deeper breakdown would expose $3,281-$3,254 Higher Timeframe Support Zone.
📌 Key Levels
Resistance:
‣ $3,353
‣ $3,380
‣ $3,399
‣ $3,422
Support:
‣ $3,329
‣ $3,313
‣ $3,295
‣ $3,281
‣ $3,254
🔎 Fundamental Focus
All eyes on today’s U.S. CPI release.
⚠️ CPI days often see false breaks and whipsaws — let the market settle before taking positions.

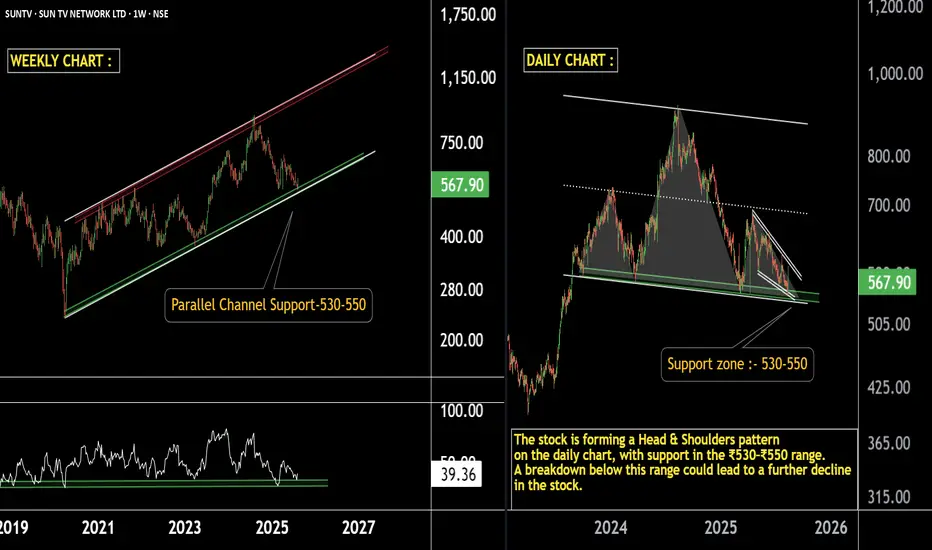
Support or Breakdown? Sun TV at Crucial JunctureSun TV Network – Technical Outlook
Weekly Timeframe:
The stock is trading near the parallel channel support zone of ₹530–₹550.
Weekly RSI indicates that the stock is taking support at this level.
Daily Timeframe:
The stock is also taking support around ₹530–₹550.
However, it is forming a Head & Shoulders pattern — a breakdown below this level could trigger a major fall.
If the ₹530–₹550 support zone holds, we may see higher prices in Sun TV Network.
Stay connected for further updates.
Thank you!!
XAUUSD Gold Trading Strategy August 11, 2025
At the beginning of the new week's trading session, the gold price fell sharply from the 340x area to the current 335x area.
Basic news: The US Dollar Index (DXY) fell to around 98 last week, unable to stay above 100. Although the 10-year Treasury yield rose to 4.285%, the Dollar remained under pressure, reflecting market concerns about political risks in the United States.
Technical analysis: After the price met the 340x resistance area, it fell sharply. Currently, the H1 frame MA lines have turned into resistance, but the H4 frame is still support. The H1 frame RSI is showing signs of increasing again and moving towards the average line; the H4 frame RSI is adjusting towards the oversold area. We will wait at the resistance areas and liquidity areas to trade.
Important price zones today: 3375 - 3380, 3350 - 3355 and 3395 - 3400.
Today's trading trend: SELL.
Recommended orders:
Plan 1: SELL XAUUSD zone 3378 - 3380
SL 3383
TP 3375 - 3365 - 3355 - 3330.
Plan 2: SELL XAUUSD zone 3395 - 3397
SL 3400
TP 3392 - 3382 - 3362 - 3330.
Plan 3: BUY XAUUSD zone 3353 - 3355
SL 3350
TP 3358 - 3368 - 3378 - 3390 (small volume).
Wish you a safe, successful and profitable new trading week.🥰🥰🥰🥰🥰

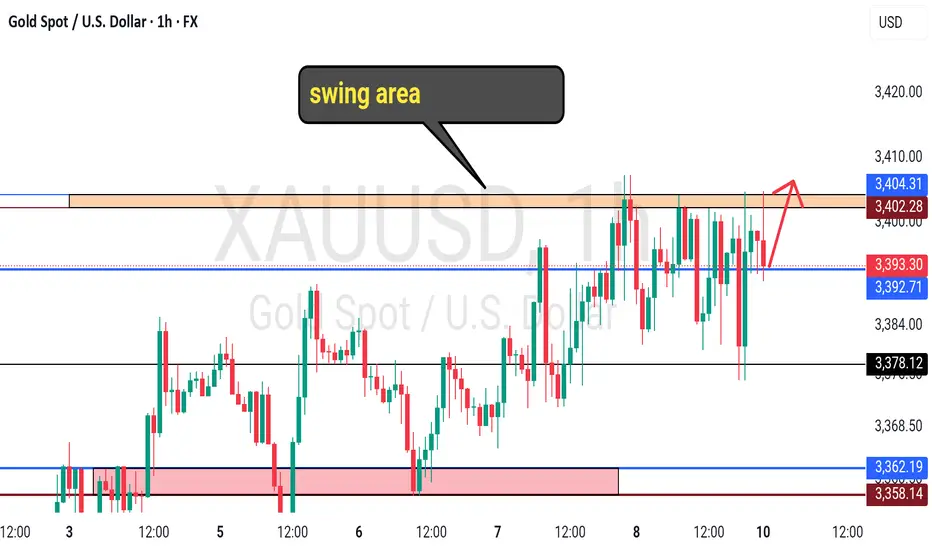
GOLD - at support ? What's next??#GOLD... Perfect move as per our video analysis and now market just at his current immediate supporting level.
That is 3392-93
Keep close and if market hold it in that case we can expect bounce otherwise not..
NOTE: we will go for cut n reverse below 3392-93 on confirmation.
Good luck
Trade wisely
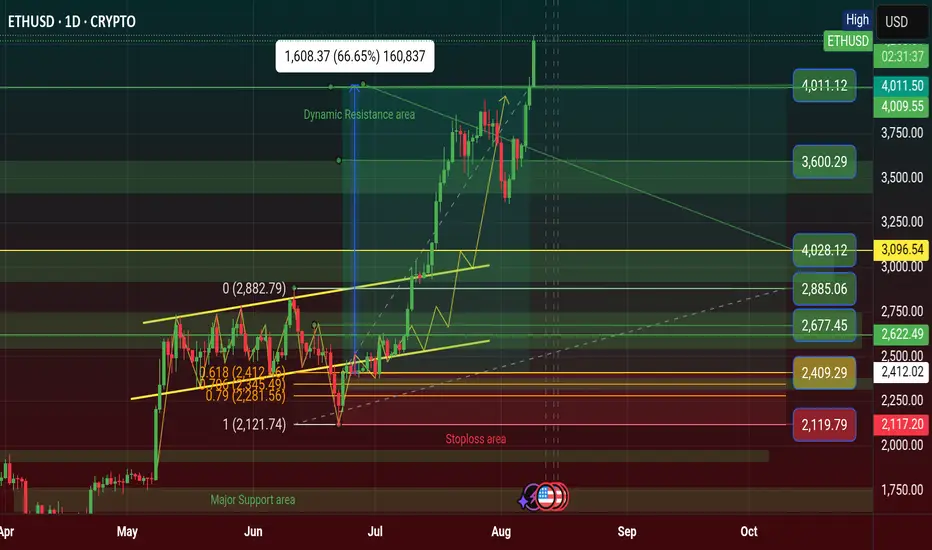
$ETH Finally $4,011 Profit Done Again, Breakout $4K price areaIf CRYPTOCAP:ETH price will be touch $4.5K and it's Breakout it will be happened $5K of new historical ATH.
Ethereum Price Target $4K as Trader Plans Partial Exit
Ethereum Maintains Market Leadership
The Ethereum Price Target $4K narrative is gaining traction as ETH continues to outperform the broader crypto market. Despite volatility, Ethereum’s resilience and strong fundamentals have kept it at the forefront of investor attention.
One experienced trader noted that ETH is “still the strongest asset in the crypto market,” following their lower time frame (LTF) plan closely. They believe the market could be nearing a local top, potentially with a brief spike — or deviation — above the $4,000 level.
Planned Exit Strategy Between $4K and $4.3K
The trader shared a specific strategy: selling 50% of their spot Ethereum holdings between $4,000 and $4,300. This position has been held for nearly two years, with an average entry price of around $2,400, meaning the planned sale would lock in substantial profits.
Such an approach reflects disciplined risk management — capturing gains after a strong rally while maintaining exposure in case the trend continues higher.
What This Means for the Market
If Ethereum does approach the $4K–$4.3K range, several scenarios are possible:
A deviation above $4K followed by a retracement could confirm a local top.
Sustained momentum beyond $4.3K could signal a stronger-than-expected breakout.
Broader crypto market sentiment will likely play a major role in price direction.
With ETH’s fundamentals stronger than ever and network upgrades continuing, the medium- to long-term outlook remains bullish — even if short-term corrections occur.
#highlights #BinanceSquareFamily #Binance #ETH #SUBROOFFICIAL
Disclaimer: This article is for informational purposes only and does not constitute financial advice. Always conduct your own research before making any investment decisions. Digital asset prices are subject to high market risk and price volatility. The value of your investment may go down or up, and you may not get back the amount invested. You are solely responsible for your investment decisions and Binance is not available for any losses you may incur. Past performance is not a reliable predictor of future performance. You should only invest in products you are familiar with and where you understand the risks. You should carefully consider your investment experience, financial situation, investment objectives and risk tolerance and consult an independent financial adviser prior to making any investment.
$BTC Finally Historical Profit Done at $122K & Now $123K of ATH CRYPTOCAP:BTC tying to push price upward movement and if it's Breakout the $120K-$122K Price Level area than it could be reached $128K - $136K price level area.
I'm guess it will be happened. Always Pattern indicate and say price movement of Bitcoin. I was many Prediction of popular coin and i will succeed in 2025. I'm long term analyst of long term investment of Traders.
🚦From News: Bitcoin Holds Firm Above $115K Support as Charts Point Toward $150K Target
Bitcoin holds above $115K support with charts pointing to a potential $150K Elliott Wave target.
Hashrate hits all-time high as energy value model places BTC valuation 45% above current price.
U.S. policy shift enables 401(k) crypto access, opening a $9 trillion market for Bitcoin adoption.
Bitcoin has held firm above the $115,000 support and is now showing signs of a large move on the charts. Price patterns and rising adoption trends are aligning as BTC prepares for a possible rally. At the time of writing, BTC was trading at $116,620, showing steady upward momentum.
Technical Structure Points Toward Upside Continuation
According to an analysis prepared by Lau, Bitcoin has taken the $115,000 support and may be preparing to break its all-time high. On Binance, the BTC/USDT daily chart displays a breakout from resistance near $116,438.79. The price reached a new high before retracing to $111,917.37, where it found support.
BTC’s price structure continues to show higher lows, aligning with the Elliott Wave pattern that targets $150,000. Key support levels remain at $98,385.45 and $89,326.51, confirming a strong technical base. According to Daan Crypto Trades, Bitcoin is steadily rising toward the $120,000 zone, where a cluster of stop losses and liquidation points may fuel further upside.
The current bullish flag formation is still intact, supported by the 50-day SMA at $113,154. The RSI has moved to 54, indicating recovering momentum without being overbought. Analysts view a break above $117,350 as a key signal for another upward push.
On-Chain Metrics and Market Drivers Support Growth
Bitcoin’s energy value stands at $167,800, which is around 45% above the current market price. According to Charles Edwards, founder of Capriole Investments, “Hash rates are flying and Bitcoin Energy Value just hit $145K.”
This model links BTC’s value to miner energy inputs and network security. Bitcoin’s hashrate reached an all-time high of 1.031 ZH/s on August 4, based on data from Glassnode. Alongside this, adoption is growing in the U.S. market.
President Trump’s policy allowing 401(k) crypto inclusion has opened a $9 trillion market. Crypto-linked equities and ETFs have also seen strong inflows, supporting long-term price action.
#highlights #everyone #premium #BinanceSquareFamily #Binance #BTC☀ #SUBROOFFICIAL
Disclaimer: This article is for informational purposes only and does not constitute financial advice. Always conduct your own research before making any investment decisions. Digital asset prices are subject to high market risk and price volatility. The value of your investment may go down or up, and you may not get back the amount invested. You are solely responsible for your investment decisions and Binance is not available for any losses you may incur. Past performance is not a reliable predictor of future performance. You should only invest in products you are familiar with and where you understand the risks. You should carefully consider your investment experience, financial situation, investment objectives and risk tolerance and consult an independent financial adviser prior to making any investment.

$BTC Finally Historical Profit Done at $123K Price of ATH CRYPTOCAP:BTC tying to push price upward movement and if it's Breakout the $120K-$122K Price Level area than it could be reached $128K - $136K price level area.
I'm guess it will be happened. Always Pattern indicate and say price movement of Bitcoin. I was many Prediction of popular coin and i will succeed in 2025. I'm long term analyst of long term investment of Traders.
🚦From News: Bitcoin Holds Firm Above $115K Support as Charts Point Toward $150K Target
Bitcoin holds above $115K support with charts pointing to a potential $150K Elliott Wave target.
Hashrate hits all-time high as energy value model places BTC valuation 45% above current price.
U.S. policy shift enables 401(k) crypto access, opening a $9 trillion market for Bitcoin adoption.
Bitcoin has held firm above the $115,000 support and is now showing signs of a large move on the charts. Price patterns and rising adoption trends are aligning as BTC prepares for a possible rally. At the time of writing, BTC was trading at $116,620, showing steady upward momentum.
Technical Structure Points Toward Upside Continuation
According to an analysis prepared by Lau, Bitcoin has taken the $115,000 support and may be preparing to break its all-time high. On Binance, the BTC/USDT daily chart displays a breakout from resistance near $116,438.79. The price reached a new high before retracing to $111,917.37, where it found support.
BTC’s price structure continues to show higher lows, aligning with the Elliott Wave pattern that targets $150,000. Key support levels remain at $98,385.45 and $89,326.51, confirming a strong technical base. According to Daan Crypto Trades, Bitcoin is steadily rising toward the $120,000 zone, where a cluster of stop losses and liquidation points may fuel further upside.
The current bullish flag formation is still intact, supported by the 50-day SMA at $113,154. The RSI has moved to 54, indicating recovering momentum without being overbought. Analysts view a break above $117,350 as a key signal for another upward push.
On-Chain Metrics and Market Drivers Support Growth
Bitcoin’s energy value stands at $167,800, which is around 45% above the current market price. According to Charles Edwards, founder of Capriole Investments, “Hash rates are flying and Bitcoin Energy Value just hit $145K.”
This model links BTC’s value to miner energy inputs and network security. Bitcoin’s hashrate reached an all-time high of 1.031 ZH/s on August 4, based on data from Glassnode. Alongside this, adoption is growing in the U.S. market.
President Trump’s policy allowing 401(k) crypto inclusion has opened a $9 trillion market. Crypto-linked equities and ETFs have also seen strong inflows, supporting long-term price action.
#highlights #everyone #premium #BinanceSquareFamily #Binance #BTC☀ #SUBROOFFICIAL
Disclaimer: This article is for informational purposes only and does not constitute financial advice. Always conduct your own research before making any investment decisions. Digital asset prices are subject to high market risk and price volatility. The value of your investment may go down or up, and you may not get back the amount invested. You are solely responsible for your investment decisions and Binance is not available for any losses you may incur. Past performance is not a reliable predictor of future performance. You should only invest in products you are familiar with and where you understand the risks. You should carefully consider your investment experience, financial situation, investment objectives and risk tolerance and consult an independent financial adviser prior to making any investment.

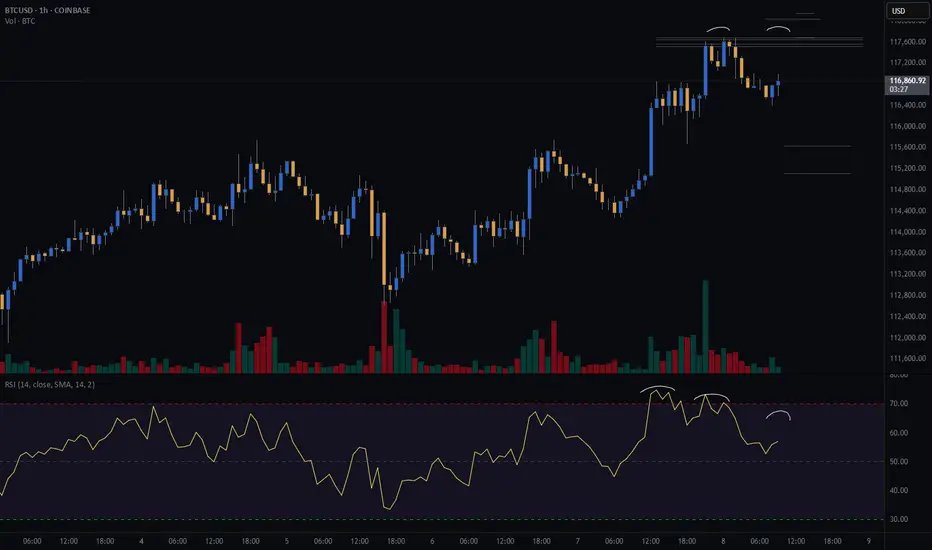
Bitcoin Bears Lining Up? My Short PlanBitcoin is flirting with a potential pullback, and I’ve got my eyes locked on this short setup.
The setup is a double top on the hourly chart.
📊 Risk/Reward: 3.7
🎯 Entry: 117 515
🛑 Stop Loss: 118 033
💰 Take Profit 1 (50%): 115 629
💰 Take Profit 2 (50%): 115 116
Seeing negative rsi divergence on the hourly chart, signaling slowing buying momentum.
I am looking for the hourly candle to close within the range drawn on the chart with lower volume.
I’ll be scaling out at TP1 and letting the second half ride if the bears get their way.
📅 Will today be the start of a deeper drop?
📍 I’m documenting my trades as part of my live trading journey – follow along to see how this one plays out and catch my next setups in real time.
Not financial advice – just my personal analysis.
Engine Started! Tata Motors Buying Opportunity Ahead !!This is the daily timeframe chart of Tatamotor.
TATAMOTORS haing a good support near at 630 level .
TATAMOTORS is making AB=CD pattern and it's pattern is compliting near at 630 level , may this level act as the support now.
F.I.B golden ratio is also indicating that 630 may act as the support level.
If this level is sustain then we may see higher prices in TATAMOTORS.
Thank You.

Dow Jones Industrial Average (DJIA) – 1H Chart Analysis | Aug 8,Current Structure:
Price is trading between 44,119 resistance and 43,816 support, consolidating after a sharp drop and partial recovery.
Resistance Zone:
The 44,119 level is acting as immediate intraday resistance; a clean breakout could push toward 44,514.
Support Zone:
43,816 remains a strong floor; below this, 43,524 is the key level where last strong bullish reversal started.
Momentum Outlook:
Recovery candles are showing smaller bodies with upper wicks, suggesting buyers are cautious and momentum is fading.
Trading Bias:
Bullish: Break above 44,119 → target 44,514.
Bearish: Break below 43,816 → retest of 43,524 likely.

GBPUSD – DAILY FORECAST Q3 | W32 | D8 | Y25📊 GBPUSD – DAILY FORECAST
Q3 | W32 | D8 | Y25
Daily Forecast 🔍📅
Here’s a short diagnosis of the current chart setup 🧠📈
Higher time frame order blocks have been identified — these are our patient points of interest 🎯🧭.
It’s crucial to wait for a confirmed break of structure 🧱✅ before forming a directional bias.
This keeps us disciplined and aligned with what price action is truly telling us.
📈 Risk Management Protocols
🔑 Core principles:
Max 1% risk per trade
Only execute at pre-identified levels
Use alerts, not emotion
Stick to your RR plan — minimum 1:2
🧠 You’re not paid for how many trades you take, you’re paid for how well you manage risk.
🧠 Weekly FRGNT Insight
"Trade what the market gives, not what your ego wants."
Stay mechanical. Stay focused. Let the probabilities work.
FX:GBPUSD

XAUUSD Bearish SMC Analysis – Institutional RejectionXAUUSD Bearish SMC Analysis – Institutional Rejection from Supply Zone
Gold (XAUUSD) is showing a clear bearish structure after rejecting a major supply zone at premium pricing. This setup is aligned with Smart Money Concepts (SMC) and reflects how institutions manipulate liquidity and order flow before major price moves.
🔍 Market Structure Context:
The market had been trending upward with higher highs and higher lows, until it approached a key premium supply zone near $3,420.
At this level, price stalled, creating internal Equal Highs (liquidity) — a common trap used by institutions to grab orders before reversing.
🔄 Change of Character (CHoCH):
A clear CHoCH was printed when price broke below the most recent higher low, signaling a shift from bullish to bearish structure.
This change marked the first early signal that institutional order flow has flipped bearish, and distribution is underway.
📉 Break of Structure (BOS):
Following the CHoCH, the market confirmed intent with a clean BOS to the downside.
This structural break confirms bearish control and validates short bias.
🧲 Liquidity Engineering:
Equal Highs were swept at the top, indicating a liquidity grab before institutions drove price downward.
This move traps breakout buyers and provides large players with sell-side execution at premium pricing.
🧱 Fair Value Gap (FVG) & Supply Zone Mitigation:
After BOS, price retraced into a Bearish Fair Value Gap (FVG) and the origin of the supply zone, offering a high-probability entry.
The rejection from this zone showed imbalance was respected and no bullish continuation existed — further validating the short setup.
🔍 Confluences for the Bearish Bias:
Confluence Confirmation
CHoCH Structure flipped bearish
BOS Bearish continuation confirmed
Liquidity Sweep Equal highs taken
FVG Retest Smart Money re-entry signal
Supply Zone Mitigation Institutional reaction confirmed
📘 Educational Summary:
This setup exemplifies a complete Smart Money bearish reversal model:
Premium pricing ✅
Liquidity taken ✅
Structure flipped (CHoCH + BOS) ✅
Supply & FVG respected ✅
It reflects how institutions build positions quietly, using engineered liquidity to trap retail traders, and then drive price with high-volume imbalance moves.

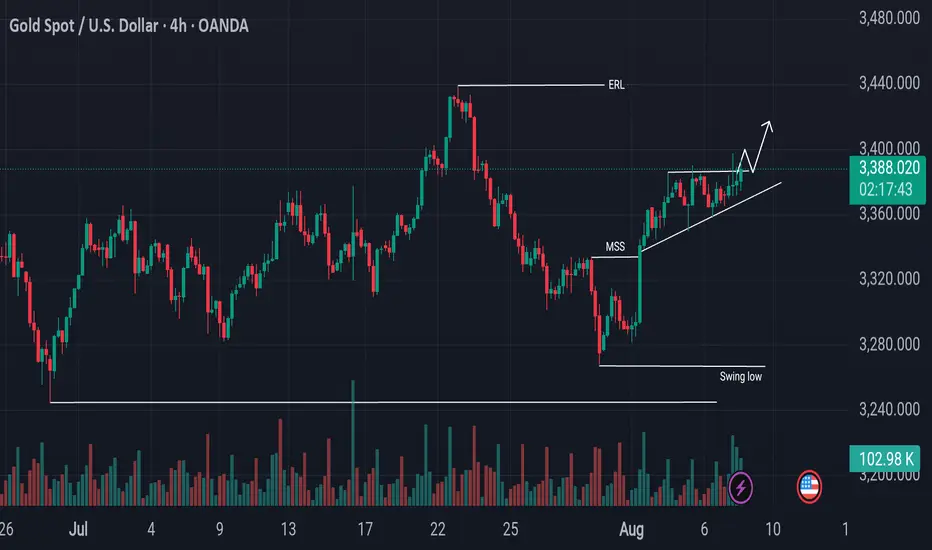
Bullish Shift in Gold Breakout in Sight?The gold market has recently confirmed a Market Structure Shift (MSS), signaling a bullish transition in the current trend. Price action is currently moving upward but has entered a key engulfing sell zone, where sellers have previously shown strong interest. The market is now testing a significant resistance level around 3385, which has temporarily capped further upside momentum.
If a decisive candlestick closes above the 3385 resistance zone, it could confirm bullish strength and open the door for a potential continuation to the upside. In such a scenario, a retest of the broken level may provide a high-probability entry point for further bullish targets, as the market aims to sweep higher liquidity levels.
As always, Do Your Own Research (DYOR) before making any trading decisions. Market conditions can shift rapidly, and risk management remains essential.
Technical Analysis of US100 on TradingView A trader is analyzing the US100 (Nasdaq 100 Index) using a 4-hour chart on TradingView. The chart displays a clear upward channel, with price action bouncing off the lower boundary and heading toward the upper trendline. A blue arrow indicates a bullish prediction, anticipating further upward movement. Support and resistance zones are highlighted, and the setup suggests a continuation of the bullish trend.
📊 Chart Overview:
Timeframe: 4-hour (H4)
Instrument: US100 (Nasdaq 100 Index)
Platform: TradingView via Capital.com
Date/Time in Chart: 25th August, 10:00 (likely UTC)
---
📈 Trend Analysis:
The price is moving within an upward parallel channel, indicating a strong bullish trend.
The chart shows multiple touches of both the upper and lower bounds of the channel, confirming its validity.
---
🟩 Support and Resistance:
Support Zone: Around 22,850–23,050 (highlighted by the green rectangular box).
Price bounced sharply from this area, showing buyers are defending it.
Resistance Area (Projected): Upper bound of the channel, which aligns with the 24,000 level.
---
🕊️ Current Market Behavior:
The price recently bounced off the lower channel boundary and the key support zone.
A strong bullish candle broke through a mini pullback area, suggesting momentum is favoring buyers.
The blue arrow indicates an expected continuation upward toward the upper resistance line.
---
📌 Technical Implications:
Bullish Bias: As long as price remains inside the channel and above the support zone, the bullish trend is intact.
A retest of the upper channel line (~24,000) is a realistic target if momentum continues.
Invalidation Level: A clean break below the support zone (~22,850) and out of the channel could shift sentiment to bearish.
---
✅ Possible Trade Idea (for Educational Purposes):
Entry: Around 23,400–23,500 (already in motion)
Target: 23,900–24,000 (upper channel line)
Stop-loss: Below 22,850 (beneath the support zone)
