Caterpillar: Countertrend ActionCaterpillar’s green wave has further room to run. However, this rise represents only an internal countertrend – the broader correction in beige wave IV is still ongoing. Under our primary scenario, we expect the price to form another low before launching into a sustained advance, which should ultimately push above resistance at $409.40. Meanwhile, our alternative scenario—carrying a 38% probability—suggests that beige wave alt.IV has already bottomed. If that’s the case, the correction is complete, and a direct breakout above $409.40 could follow.
📈 Over 190 precise analyses, clear entry points, and defined Target Zones - that's what we do.
Chartanalysis

BONK/USDTThis time, we reached a resistance area for this currency and I think this currency has the potential to be bullish. I have specified the target for you. Remember, this is an analysis, not an entry point. Tell me your opinion.

TMGH Rebound AnalysisTMG Holding trend is reaching a new peak zone at the resistance line 58.624. Historically, it is expected to rebound to the support line at 58.538, then the support line 58.452 and finally 56.734. In conclusion, it increased by 0.17%.

₿ Bitcoin: Push to the Upside! Bitcoin has made a significant push to the upside, which brought it closer to the upper blue Target Zone between $117,553 and $130,891, where we primarily expect the corrective rise of green wave B to conclude. We consider this price range an opportunity to take partial profits or to open short hedges for tactical protection of existing long positions — thus, we don't plan to sell all our Bitcoin holdings there. Potential short hedges could be secured with a stop 1% above the upper edge of the zone since there's a 30% chance that price could exceed this zone to develop a new high for blue wave alt.(i) before reversing later. Primarily, however, green wave C should commence in the upper blue zone and drive BTC down into the lower blue zone between $62,395 and $51,323—and thus to the low of orange wave a.
📈 Over 190 precise analyses, clear entry points, and defined Target Zones - that's what we do.

Tencent: Searching for Wave A’s LowTencent’s corrective A-B-C structure is struggling to finish wave A. Our primary scenario calls for a drop toward support at HK$364.80, where wave A should bottom. That should open the door for wave B, followed by a deeper leg down in wave C—into the magenta Long Target Zone between HK$325.60 and HK$229.00. This zone should mark the completion of wave (2), setting up a long-term bullish reversal in wave (3), which may eventually target resistance at HK$715. However, if price breaks below HK$188.60, our wave alt. scenario will take over (36% probability), signaling an even deeper low before the next bullish impulse.
📈 Over 190 precise analyses, clear entry points, and defined Target Zones - that's what we do.

1,505% from $0.20 to $3.21 on massive 1+ Billion volume $KLTOWOW 🤯 1,505% from $0.20 to $3.21 on massive 1+ Billion shares traded 🚀 NASDAQ:KLTO
I sent out 2 Buy Alerts for everyone to get paid nicely ✅
This will trigger more runners, premarket already got movers NASDAQ:MEGL , NASDAQ:MRIN , NASDAQ:EVGN

EURJPY Technical Breakdown (MMC Strategy) : Target Zone 🧠 Concept Focus: MMC – Mirror Market Concept
The Mirror Market Concept (MMC) helps identify pattern inversions, price reflection zones, and structural symmetry that hint at upcoming market turns. This chart reflects a curve-based reversal logic rooted in smart money behavior, volume analysis, and pattern exhaustion.
📊 Technical Structure Breakdown
🔹 1. Volume Contraction + Breakout (June 6–7)
Early signs of bullish pressure were detected with volume contraction, forming a tight range wedge/triangle.
This is often a liquidity trap where weak hands sell into strength.
Smart money absorbed sell-side liquidity before impulsively breaking out.
This is a common MMC move: contract > trap > expand.
🔹 2. 50% Area Used – Smart Money Trap (June 9)
After the breakout, price tapped into the 50% equilibrium zone of the previous major move.
This level often acts as a liquidity sweep zone, ideal for smart money to unload or build counter positions.
The rejection wick here confirms that institutional traders reacted at this level.
🔹 3. Curve Bending Pattern – Exhaustion in Play
The market has now entered a curve bending phase, visible with the arching price movement.
This signifies momentum exhaustion, where bullish attempts get weaker.
Think of this curve like a mirror ceiling — as each high gets tapped, it bends, showing the market can't sustain higher levels.
🔹 4. Next Reversal Zone (Projected Target: ~164.150–164.200)
Based on MMC symmetry and previous demand zones, the area highlighted as Next Reversal is a key structure zone.
This is where we expect price to react — either bounce (for buyers) or break (for continuation shorts).
A clean bounce here could mirror the earlier pattern in reverse, hence the Mirror Market Concept.
🔁 Summary of Market Psychology
🧲 Volume contraction signals manipulation.
🎯 50% zone rejection shows trap completion.
🪞 Curve bending shows buyers losing strength.
🔻 Price likely to drop into the reversal zone, completing the mirror leg.
🧩 What Traders Should Watch
Indicator/Zone Notes
50% Area Used Smart Money Exit or Entry Trap
Curve Bending Reversal Geometry (Momentum Exhaustion)
Next Reversal Zone Smart Money Demand Zone (~164.150)
Break Below 164.100 Confirms deeper bearish continuation
🎯 Trading Strategy Outlook
🔍 Short Bias: Look for confirmation (e.g., bearish engulfing, BOS on lower TFs) to enter shorts below curve zone.
🛑 Invalidation Level: Clean breakout above 165.500 would invalidate the mirror structure and shift to continuation long.
🎣 Reversal Scouting : If price respects the Next Reversal Zone, there could be a potential long scalp back into mid-range.
🧠 Educational Note: MMC in Action
The Mirror Market Concept is powerful for intraday trading. It uses pattern reflection, liquidity logic, and price symmetry to forecast reversals before typical indicators catch up. If mastered, this concept can give early reversal entries and trap avoidance.

EURUSD Analysis (MMC Strategy) : Structure Mapping + Target🧠 Overview
This analysis is based on the MMC (Market Mapping Concept), combining smart money principles, structure mapping, and price behavior analysis. EUR/USD has been showing strong bullish activity over the past few months, but we are now approaching a critical decision zone. Let’s break it all down.
🔹 1. Arc Structure – Accumulation Phase (Dec 2024 – Feb 2025)
The chart starts with a well-defined Arc formation, signaling accumulation by large players.
Price showed a series of higher lows within the arc, compressing volatility.
This is where smart money quietly loads positions before pushing price.
Key Insight: This arc often precedes an impulsive breakout, as seen next.
🔹 2. Central Zone Breakout (Feb – Mar 2025)
The price exploded out of the arc, breaking through the central compression area.
Marked as the Central Zone, this acted as both support and a launchpad.
This phase included imbalance filling, reaccumulation, and clean price action.
Observation: Notice the aggressive bullish candles—clear indication of institutional interest.
🔹 3. Structure Mapping & QFL Zone (April 2025)
A classic QFL (Quick Flip Level) was formed after the initial rally.
Price pulled back into a structure support zone, respected it cleanly, and bounced back.
This gave a textbook smart money entry.
Structure Mapping highlights how each leg of the trend is forming based on supply/demand reaction.
🔹 4. Major BOS – Break of Structure (May 2025)
Price broke the previous swing high, giving us a Major Break of Structure.
This BOS confirms a change in character (CHOCH) from ranging to trending.
After BOS, the market retested the breakout zone—providing a second ideal long entry for continuation traders.
🔹 5. Minor Resistance Zone (Current Price)
Currently, price is testing a Minor Resistance zone around 1.1400–1.1450.
This level acted as resistance earlier and may slow price down temporarily.
However, there’s still room for bullish continuation unless reversal patterns emerge.
Key Watch Point: If price shows weakness here (e.g., rejection wicks, bearish engulfing), short-term retracement may follow.
🔹 6. Next Reversal Zone (Projected Target: 1.1700–1.1800)
The green box above marks the Next Reversal Zone, based on historical supply, Fibonacci extension levels, and structure analysis.
Expect this area to act as strong resistance unless momentum is very strong.
This is a potential TP zone for long traders or an area to scout for short opportunities if reversal signals appear (divergence, order block rejection, liquidity grab).
📌 Key Levels
Zone Price Range Role
Central Zone 1.0800–1.1000 Support/Accumulation
Minor Resistance 1.1400–1.1450 Immediate Hurdle
Next Reversal Zone 1.1700–1.1800 Target / Short Setup
QFL Zone 1.1100–1.1200 Smart Money Entry Point
🧠 Strategy Outlook
✅ Bullish Bias: Structure is clearly bullish. Buyers are in control.
🕵️♂️ Watch for Reaction at Minor Resistance – a clean break = continuation, rejection = short-term pullback.

USDJPY Analysis: MMC Resistance vs Major BOS (Technical View)🔍 Chart Summary:
The USDJPY pair is currently trading around 144.58, showing strong signs of structural buildup as it approaches a critical inflection point. This analysis leverages MMC (Market Mapping Concept) and price action structure to identify two possible directional outcomes — each grounded in key technical levels.
🧠 Key Technical Highlights:
📌 1. Expanding Wedge Pattern:
Price previously formed an expanding structure, signaling volatility and accumulation.
Expansion typically precedes major directional breakouts — either trend continuation or reversal.
📌 2. Downtrend Break Test:
A long-standing descending trendline has now been tested multiple times.
A confirmed breakout would be significant, indicating a major shift in market momentum.
📌 3. Resistance Zones:
Minor Resistance Zone around 158.00–160.00 marks a key supply area.
Watch for price action behavior if this level is tested — possible rejection or breakout continuation.
📌 4. Major Support Zone:
Support near 139.00–140.00, where price previously bounced, represents a solid floor and demand zone.
📌 5. BOS (Break of Structure):
Two BOS levels are marked:
Minor BOS (Around 146.00): Immediate reaction level to watch.
Major BOS (Around 149.00–150.00): If broken, could lead to sharp bullish continuation.
🔮 MMC Forecast Scenarios:
✅ Condition 1: Bullish Breakout Scenario
Price breaks above the descending trendline and clears the Minor BOS.
Target zone: 158.00–160.00 resistance.
Structure confirms bullish dominance if Major BOS is cleanly broken and retested.
⚠️ Condition 2: Bearish Rejection Scenario
Price rejects from current trendline or Minor BOS and reverses.
Potential drop toward Major Support around 140.00.
Watch for reversal confirmation with bearish engulfing candles or re-entry into expanding zone.
🧭 MMC Outlook Summary:
The chart is setting up for a key decision point. The market will either validate a bullish breakout structure or revert back into bearish continuation. These scenarios align with the MMC mapping method, providing clear conditions for traders to follow without bias.

Gold (XAUUSD) Technical Analysis : MMC Setup Confirmed + Target📊 1. Market Structure Overview
After a strong rally earlier this month, XAUUSD entered a corrective phase and formed a descending trendline which acted as resistance for multiple days. This trendline has just been tested and broken, suggesting that the correction may be coming to an end.
At the same time, price is showing signs of strength by bouncing off the lower boundary of a long-standing parallel ascending channel—a structure that has acted as dynamic support over the past two weeks.
🧱 2. Key Technical Elements
🟦 Support/Resistance Interchange Zone (S/R Flip)
Price recently interacted with a horizontal S/R interchange zone around the $3,310–$3,330 area.
This zone served as resistance during the earlier part of the trend and is now acting as support after the breakout.
It also overlaps with the mid-section of the ascending channel, adding confluence to this support area.
📐 Descending Trendline Break
The break above the descending trendline signals a potential shift in momentum.
Traders often view this kind of breakout as an early indicator of bullish continuation, especially when combined with volume or retests.
🟩 Next Reversal/Target Zone
A green box is highlighted around the $3,345–$3,355 zone, which could act as the next resistance or reversal level.
This is based on prior market structure and Fibonacci extension zones.
This area may offer a take-profit level for longs or a short-term reversal zone for countertrend traders.
🔍 3. What to Watch
✅ Bullish Scenario
If the price sustains above $3,310 and holds above the broken trendline, we could see a push toward the $3,345–$3,355 area.
Ideal long entries may occur on a retest of the trendline or the S/R flip zone, confirming it as support.
❌ Bearish Scenario
Failure to hold above the $3,300–$3,310 support region would invalidate the breakout.
A clean break below this zone could result in a drop back to the lower parallel channel boundary near $3,270 or even lower.
⚙️ 4. Trading Plan & Bias
Short-term Bias: Bullish (Trendline break + support hold)
Mid-term Bias: Cautiously Bullish (until major resistance is tested)
Risk Management: Stop-loss for long entries should be placed below $3,300 with targets near $3,345 and $3,355.
💬 Conclusion
This setup presents a classic case of trendline breakout + S/R flip confluence, which often leads to favorable risk/reward opportunities. Gold traders should monitor the retest behavior around current levels closely, as it will likely determine the next directional move.
📌 Always wait for confirmation, manage risk, and don’t chase moves—especially near major zones.

CHAMBAL FERTILIZERS FOR SWING TRADECHAMBAL FERTILIZERS a good opportunity for swing trade plan, entry and exit point mention, add your watchlist and observe.
This is for Education purpose only...

BEST XAUUSD BUY AND SELL SETUP FOR TODAY 📉📊 Gold (XAU/USD) Analysis – Key Levels in Focus! 📈🧐
Gold is currently trading around the 3,326 zone after a recent pullback. Price is approaching the key support level at 3,310, where a potential bullish bounce may occur, targeting the next resistance near 3,350. 🛑 However, if price fails to hold above 3,310, we may see further downside movement towards the 3,293 support. 📉 Traders should watch for reaction and confirmation around these zones before taking entries. ⚠️💡 A bullish reversal could trigger strong buying momentum, while a bearish break may lead to deeper correction. 🎯💰

BIG 441% Monday from $0.60 to $3.25 $OMH🔥 BIG 441% Monday from $0.60 to $3.25
Easiest money made today was on NASDAQ:OMH buy before halt, then once it came out of halt it was just gapped up into 💸💸💸

AARTI DRUGS at Best Support !!This is the Weekly chart of AARTI DRUGS.
AARTI DRUGS having good law of polarity at 425-440 range.
If this level is sustain then we may see higher prices in AARTI DRUGS.
Thank You !!

Google (Alphabet): Overarching Downside PotentialAlphabet (GOOGL) hasn’t been able to reclaim its May 22 high and has settled into a consolidation range around the $170 level. Still, under our primary scenario, we expect the current corrective upswing to continue for a bit before turquoise wave 3 resumes the downtrend. That move should break below $138.35 and carry the price into the magenta Target Zone between $123.92 and $98. After that, a rebound within wave 4 is likely, though it probably won’t be strong enough to retake the $138.35 level. A final leg down in wave 5 should then complete the correction, driving the price deeper into the zone and establishing the low of green wave . This area also marks a potential turning point for the next major move upward. Meanwhile, a detour above resistance at $209.28 for a new high of magenta wave alt.(B) is 24% likely.
📈 Over 190 precise analyses, clear entry points, and defined Target Zones - that's what we do.

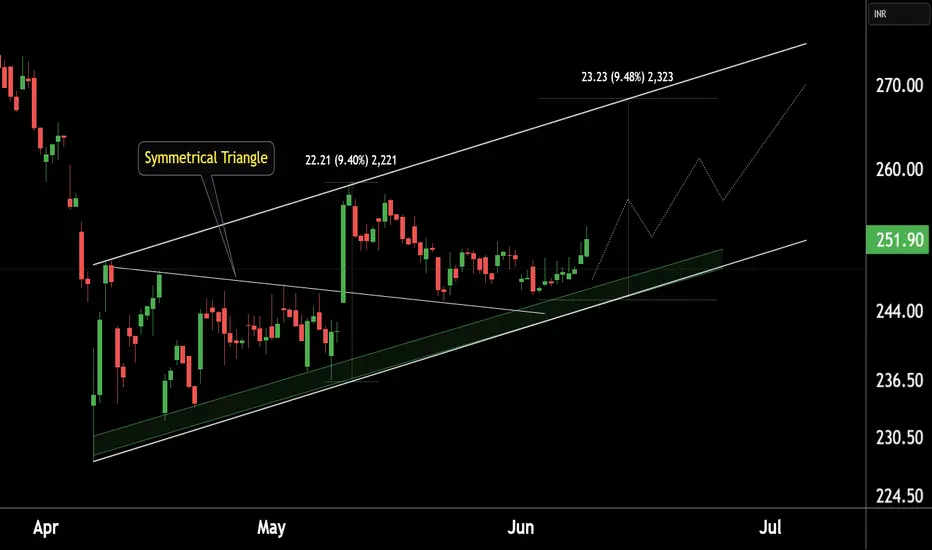
WIPRO at Best Support !!This is the 4 hour chart of Wipro ltd.
WIPRO has a strong support zone in the 245–248 range.
WIPRO is forming a symmetrical triangle pattern, with a potential target of 268, which also aligns with the channel's resistance zone at 268-270."
If this level is sustain , we may see higher prices in Wipro !!
Thank You
₿ BTC: Upside Potential Remains IntactBTC posted modest gains over the weekend, but more upside is expected in our primary scenario. We continue to track a corrective advance in green wave B, with the potential to extend into the upper blue Target Zone between $117,553 and $130,891. From that top, wave C should initiate a downward move into the lower blue zone between $62,395 and $51,323—completing orange wave a. Subsequently, we anticipate a bounce in wave b, followed by another decline in wave c, which should conclude the larger correction of blue wave (ii). There is still a 30% chance that blue wave alt.(i) could make a new high, extending beyond the Target Zone and delaying the broader corrective sequence.
📈 Over 190 precise analyses, clear entry points, and defined Target Zones - that's what we do.

VEDANTA LTD KEY ZONE..This is the 1 hour chart of VEDL.
VEDL is currently trading near its pattern (Broadening) resistance zone in the 462–465 range.
The stock is trading with in a channel, with its support zone in the 440–445 and resistance zone 485-495 range on the hourly chart.
If this level is sustain,we may see higher prices in VEDL
If VEDL breaks below its support zone, we may see lower levels around 415-405 range .
THANK YOU !!

APE/USDT"APE coin could potentially reach the current resistance level first, and then move toward the next targets. Let me know what you think!"

CORRECT WAY OF WATCHING YOUR SCREENI believe if you really wanna achieve success in trading it is very important to see how you are looking your charts, while watching your charts your love curves should be easily visible. Creating that perception is trading. On a serious note Gold movement is amazing.

Coca-Cola: IndecisiveCoca-Cola continues to trade sideways, still failing to confirm either of our scenarios definitively. The primary scenario envisions that wave III in beige will post another high within the beige Target Zone ($76.58–$81.51), which offers a potential setup for short positions. Following that, wave IV in beige should begin a substantial correction. However, if the stock fails to overcome resistance at $74.38, it could indicate that the top of wave alt.III in beige is already in. A decline below the $66.05 support level would activate the alternative scenario (35% probability), implying a drop below $60.62.

₿ BTC: Delay Tactics in Wave B Bitcoin dropped hard yesterday, throwing a wrench into the expected climb toward the top of green wave B. This bounce was supposed to stretch into the upper blue Target Zone between $117,553 and $130,891, which we flagged as a smart area to take partial profits or layer in short hedges. That zone still stands—BTC just isn’t ready to hit it yet. The current pullback suggests we’ll see more sideways-to-lower price action before green wave B wraps up. Once it does, green wave C should drag Bitcoin into the lower blue Target Zone between $62,395 and $51,323. That’s where we’re looking for orange wave a to complete. After that, a countertrend rally in wave b could pop up—before wave c wraps the entire corrective cycle and finishes blue wave (ii). We’re also watching an alt.(i) breakout scenario (30% probability). In that case, BTC would blow through the $130,891 level early, bypassing the expected dip and reaching new highs faster than projected.
📈 Over 190 precise analyses, clear entry points, and defined Target Zones - that's what we do.

TATA STEEL at Resistance ZoneThis is Daily Chart of TATA STEEL.
Tata steel having good Law of Polarity at 163-168 range.
If this level is sustain , then We may see lower prices in the stock again.
Tata steel is a good support zone at 125-130 range.
Two EMAs are also supporting the stock, with the first EMA positioned at ₹140 and the second at ₹129.
THANK YOU !!
