BTC: Facing Resistance?Bitcoin recently encountered renewed selling pressure, stalling the anticipated continuation of green wave B. Under the primary scenario, this corrective upward movement should still extend into the upper blue Target Zone between $117,553 and $130,891, where the price is expected to reverse and initiate green wave C. That move should complete with a low in the lower blue Target Zone between $62,395 and $51,323, thereby finalizing orange wave a. Following a corrective advance in wave b, the larger wave (ii) should reach its conclusion. There remains a 30% probability for the alternative scenario, in which BTC pushes above the upper blue Target Zone, establishing a new high in blue wave alt.(i)— which would delay the expected pullback.
📈 Over 190 precise analyses, clear entry points, and defined Target Zones - that's what we do.
Chartanalysis

GOLD - Reached at ultimate Resistance? whats next??#GOLD. market perfectly bounced above our area that was 3382
now market just reached at his today most expensive region that is 3402-04
keep close that region and if market hold it in that case we can expect drop from here..
keep close it.
NOTE: keep in mind that above 3402-04 we will go for cut n reverse on confirmation.
good luck
trade wisely

Alibaba: Intermediate Correction in ProgressAs Alibaba has remained below resistance at $121.28, we’ve ultimately chosen to consider the high of orange wave x as established. Thus, we currently place the stock in bearish wave y, which should conclude the corrective structure of the larger blue wave (ii). From that point, BABA should reverse, climb back above the $121.28 resistance, and move to significantly higher levels—initially completing blue wave (iii), and eventually the larger turquoise wave 3. However, there’s still a 34% chance that our bearish alternate scenario will play out. In that case, the stock would fall between the two support levels at $80.05 and $58.01, where the low of turquoise wave alt.2 would form.
📈 Over 190 precise analyses, clear entry points, and defined Target Zones - that's what we do.

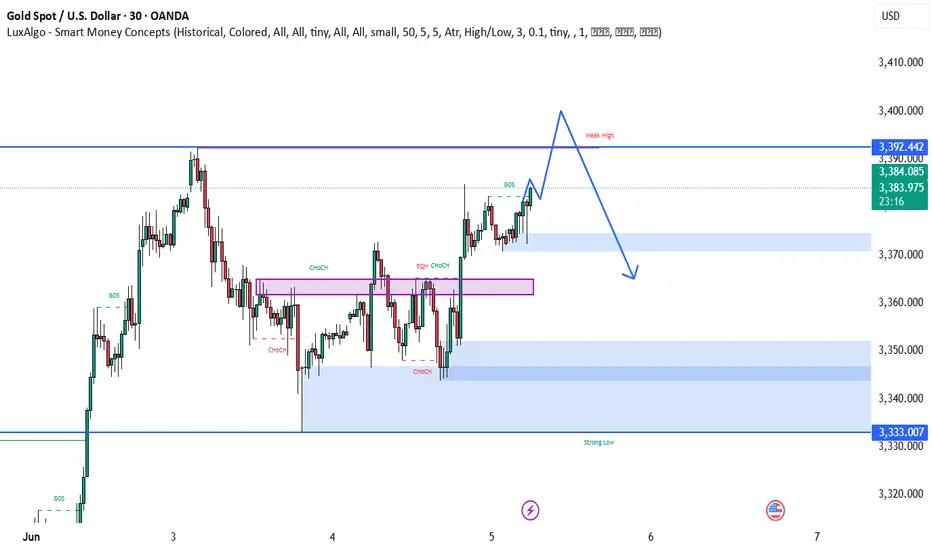
BEST XAUUSD M30 BUY AND SELL SUTUP FOR TODAY📊 Gold is currently showing bullish strength with a break above key structure levels and multiple CHoCH confirmations. Price is approaching a weak high near 3,392, which may act as a liquidity target before potential reversal. 🔄 After sweeping this high, a bearish move could unfold, aiming for the demand zones between 3,350–3,333 where buyers may step back in. 🧠 Traders should prepare for a liquidity grab scenario, with bullish continuation likely invalidated if price closes below the strong demand. ⚠️ Watch price action closely near the weak high and key imbalance zones. 🚀🔁📉
BTC: Maintaining Strength Bitcoin continues to hover around the $105,000 level. In line with the primary scenario, we expect the advance in green wave B to extend toward the upper blue Target Zone between $117,553 and $130,891. This zone can be used to lock in partial gains or establish hedges via short positions. From there, a corrective wave C is likely to follow, driving prices lower into the blue Target Zone between $62,395 and $51,323 — marking the end of the larger wave a. A corrective bounce should unfold next, ahead of the final selloff completing blue wave (ii). The alternative scenario, with a 30% probability, envisions a breakout above $130,891 and the establishment of a new high as part of blue wave alt.(i).
📈 Over 190 precise analyses, clear entry points, and defined Target Zones - that's what we do.

S&P500: Approaching the 88.70% RetracementThe S&P 500 continued its climb, nearing the 88.70% Fibonacci retracement level. The top of magenta wave (B) has not yet been confirmed, so under the primary scenario, we continue to expect further upside into the magenta Target Zone between 5,880 and 6,166. Once that zone is reached, wave (C) is expected to take over and drive the index into the next Target Zone — the green zone between 4,988 and 4,763. Short positions initiated within the upper zone remain viable and can be protected with a stop 1% above the top of the range. The alternative scenario — assigned a 40% probability — assumes the rally will continue directly into wave alt.(III) in blue, with a breakout above the 6,675 resistance. Over the long term, we continue to expect one final impulsive leg higher in blue wave (III) once the broader green wave correction is complete. This should take the S&P 500 well above the 6,166 mark.
📈 Over 190 precise analyses, clear entry points, and defined Target Zones - that's what we do.

AMD: Short-term Upward PotentialAMD has continued to face downward pressure, preventing further progress in green wave . While this wave still has room to rise, its top should form below resistance at $141.16. Once wave completes, wave should follow—finishing the larger green impulse to the downside and completing the corrective structure of blue wave (II). This move is expected to conclude in our blue Long Target Zone between $62.82 and $35.19. That said, we continue to monitor a 30% alternative scenario: it suggests that wave alt.(II) has already bottomed at $76.12. In that case, AMD wouldn’t visit the blue zone but instead break out directly above the resistances at $141.16 and $174.98—marking the beginning of wave alt.(III).
📈 Over 190 precise analyses, clear entry points, and defined Target Zones - that's what we do.

BEST XAUUSD M30 SELL SETUPNFOR TODAY 📉 Gold Analysis Summary – Bearish Setup Alert ⚠️
Gold is currently showing signs of weakness after a strong bullish push. A Change of Character (CHOCH) has confirmed a potential shift in trend. Price is approaching a supply zone (highlighted in purple), and rejection from this level could trigger a downward move. 🔄 The projected path suggests a potential lower high formation, followed by a drop towards the 3,348 and 3,331 key demand levels. 🧠 Watch for bearish confirmation near resistance before entering short positions. 📊💥

HUGE $5 to $49 today +900% vertical $MCTR told you early!HUGE 🤯 $5 to $49 today +900% vertical 🚀 shared a chart with you early before it went on a power squeeze NASDAQ:MCTR

$5 to $19 or +300% vertical! Catching a safe piece of $MCTR$5 to $19 🚀 Catching a safe piece daily from the move like that is all you need to keep the job away 💯 NASDAQ:MCTR

Procter&Gamble: Short-Term Strength Still Fits the PlanPG has extended its rally, pushing turquoise wave C higher. While some selling pressure is starting to show, we’re sticking with our primary view: the stock should still break above $180.43 to complete beige wave b before turning lower. However, in our 37% likely alternative scenario, beige wave alt.b would have already topped, and the stock would next drop below $148.87.
📈 Over 190 precise analyses, clear entry points, and defined Target Zones - that's what we do.

AVAX: Low in Sight?AVAX continued its expected decline into the magenta Target Zone between $24.42 and $13.31, before reversing course over the weekend with a modest bounce. While it's possible that this marked the low of the wave ii correction, we're not ruling out the potential for another dip within the zone. For now, the setup remains open-ended. Once orange wave ii has been confirmed as complete, we expect a strong rally to follow in wave iii, likely driving the price beyond resistance at $49.95.
📈 Over 190 precise analyses, clear entry points, and defined Target Zones - that's what we do.

BTC: Still in the Grip of Wave BBitcoin is holding steady near the same levels seen at the time of yesterday’s update — and so is the structure. According to our primary scenario, we expect the current corrective wave B to complete soon within the blue Target Zone between $117,553 and $130,891. Once that happens, a wave C selloff should follow, likely targeting the lower blue Target Zone between $62,395 and $51,323. That said, our alternative scenario (30% probability) remains intact. In that case, the high of blue wave (i) has yet to form — a breakout above $130,891 would confirm that view and open the door to further upside before a correction resumes.
📈 Over 190 precise analyses, clear entry points, and defined Target Zones - that's what we do.

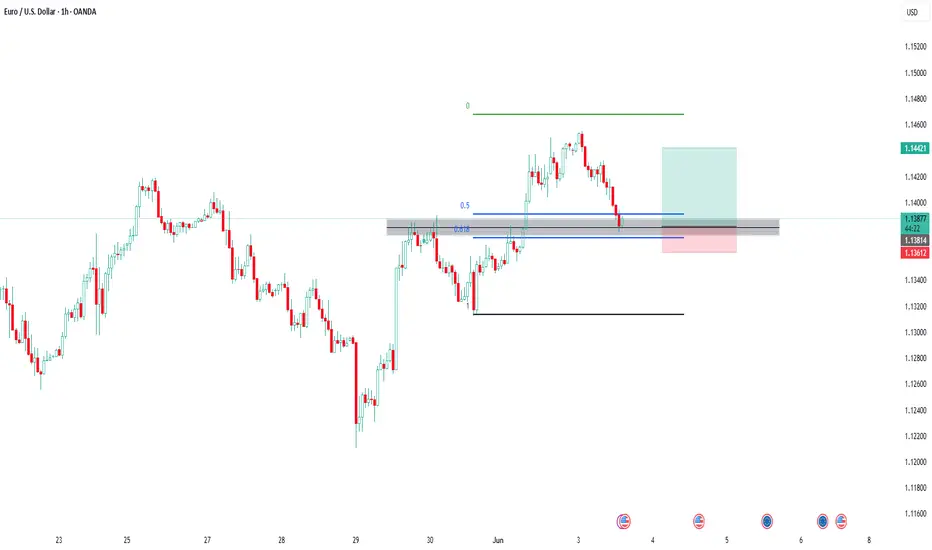
EUR USD Trade Setup 1 hour timeframe EUR USD Trade Setup 1 hour timeframe
EUR USD has formed a Bullish Break and Retest pattern on the 1 hour timeframe and the price is currently at the retest level.
Full trade plan with exact prices laid out ahead of time!After shortsellers forcefully pushed NASDAQ:MODV down from mid $2's I said this will most likely result into powerful squeeze.
I said buy at the dip $2.31 exactly, waited to get filled, double dip to $2.31 happened to get a full position and from there straight up to mid $3's, took profits in 2 parts and sent out messages live as it was happening so everyone that followed along knew what to do.
Solid +30% gain in minutes, taking safest piece of the 200% move the stock made before focus shifted elsewhere.
That's how it's done, in and out at highly predictable levels, then moving on to the next stock because NASDAQ:NIVF NASDAQ:EYEN NASDAQ:REVB are already up and hot this morning, not marrying it and holding & hoping forever.

ECB Signals More Action as Eurozone Outlook WaversECB Signals More Action as Eurozone Outlook Wavers
EUR/USD rebounded to near 1.1370 in Monday’s Asian session as the US Dollar weakened after legal shifts in tariff rulings. On Thursday, the US Court of Appeals backed Trump’s tariff policy, overturning Wednesday’s lower court decision that had declared his April 2 executive orders unlawful.
Trade tensions escalated as Trump announced plans to double tariffs on steel and aluminum imports to 50%. In response, the European Commission warned it would retaliate, despite both sides agreeing to accelerate talks after extending the EU tariff deadline to July 9.
Meanwhile, Eurozone economic concerns persist. ECB’s Klaas Knot cited inflation uncertainty, while François Villeroy de Galhau said policy normalization is likely not finished, suggesting more action ahead.
The key resistance is located at 1.1460 and the first support stands at 1.1300.

Yen Rises Amid Trump Tariff Threat and China DisputeThe Japanese yen rose to around 143.5 per dollar on Monday, marking its third straight session of gains as rising global trade tensions lifted demand for safe-haven currencies. The move followed President Trump’s threat on Friday to double tariffs on steel and aluminum imports to 50% starting June 4. Japanese steelmakers like JFE Holdings and Kobe Steel fell, while Nippon Steel was less affected after Trump praised its planned merger with U.S. Steel. Meanwhile, U.S.-China tensions grew as China denied Trump’s claim of breaching a recent Geneva trade agreement. On the domestic front, Japan’s Q1 capital spending beat expectations, with investment rising across both manufacturing and services, reflecting solid internal momentum.
The key resistance is at $143.50 meanwhile the major support is located at $143.00.

BTC: Slowing DownBitcoin managed to stabilize over the weekend after its recent slide, nudging slightly higher from local lows. We continue to expect the current rebound—interpreted as wave B—to stretch into the blue Target Zone between $117,553 and $130,891. Once that move tops out, the next leg lower should follow, with wave C driving the price into the lower blue zone between $62,395 and $51,323. That would likely complete wave a in orange and pave the way for a temporary recovery before wave b rolls over into the final drop of wave (ii). The alternative scenario, which we’re still assigning a 30% probability, assumes Bitcoin is already in wave alt.(i) in blue—a more bullish path that would extend the rally well beyond $130,891 without another major correction first.
📈 Over 190 precise analyses, clear entry points, and defined Target Zones - that's what we do.

Mastercard: Approaching the Top of Wave BMastercard has rebounded after a brief cooling period, and we now expect turquoise wave B to complete just below resistance at $620. Once that top is in, wave C should drive a meaningful retracement, ending with the low of magenta wave (4). Alternatively, if turquoise wave alt.(4) has already bottomed — which we estimate as a 40% probability — then a direct breakout above $620 would suggest a shift toward a much more aggressive advance. That path would take the stock straight into magenta wave (5), completing blue wave (I) with a strong rally.
📈 Over 190 precise analyses, clear entry points, and defined Target Zones - that's what we do.

Uber: Topped out Already?Uber sold off sharply after topping out at $94.10 – thus, our short-term alternative scenario needs to be considered. In this view (35% probability), turquoise wave alt.3 has already concluded, and the stock is headed toward a pullback in wave alt.4 . That retracement would likely bottom in the turquoise Target Zone between $65.94 and $57.24 — a potential setup for long entries. The primary scenario remains more bullish: we expect a renewed push above $94.10 to complete the regular turquoise wave 3.
📈 Over 190 precise analyses, clear entry points, and defined Target Zones - that's what we do.

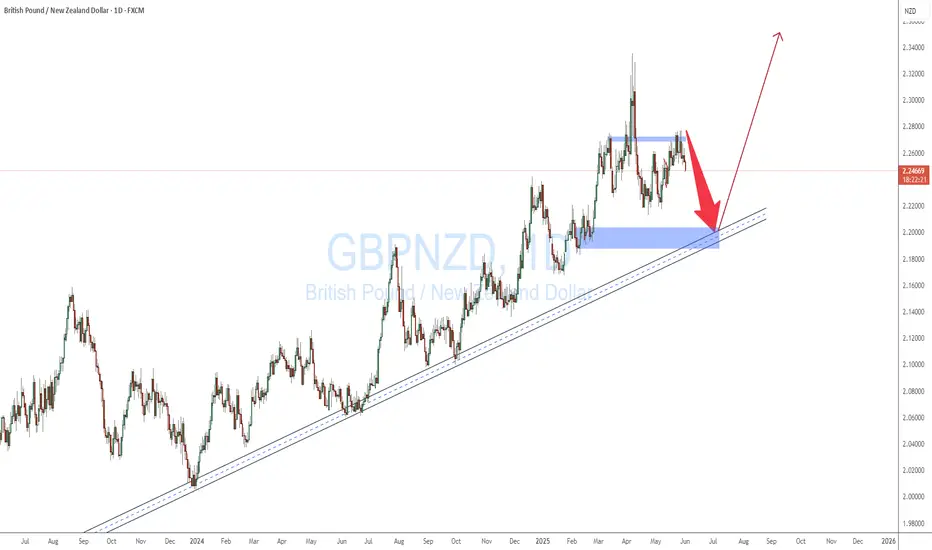
GBPNZD TANK BEFORE THE SURGEGBPNZD is expected to fall o the daily dynamic support before the surgeto break the next high.
the pair keeps tanking from a a dailt TF quasimodo LEVEL
$AMD $120 retest then $130 push through. R/R looks incredible..Hello, NASDAQ:AMD Advanced Micro Devices, INC looks TASTY. I'm almost salivating. NASDAQ:NVDA may take a backseat and NASDAQ:AMD could start seeing monster upside. Something in my gut is telling me this name wants to GO. I'm looking at $120c for 6/20 and $130c for 6/20. This thing can launch.. it's hanging on an upside trendline, it may break but this $110 area may represent local support. Earnings report were good and after an abysmal 2024 after having highs and totally wiping them out hitting lows of $80, I think this could be the time for NASDAQ:AMD longs. It has taken the 20 day EMA/SMA over and now could curl to the 200 day EMA/SMA. 200 SMA is $126. This seems like a really good setup especially R/R here. Very cheap calls for a name that can see a 10-15% week.
WSL.

$UNH contrarian idea ..Hello, this seems to be the "BUY THE DIP!" name definitely on the retail side. A guy once told me, if everyone is talking about getting into something, buying something, it might be a good time to sell and get out of that something. Example: I have been buying Bitcoin for five years, the price has risen and now everybody is talking about Bitcoin, that might be a clear indicator to sell some of that position and take profits; contrarian. So, something is telling me this name isn't ready to just ride to the upside like everybody is imagining. A big zone is down around $200, a 7 year demand. This name is in turmoil, randomness happens. I believe the name would have kept going down if the insider buy did not come in and bring some momentum. I can see this name retracing back to $275 and below. Will be interesting to see. On watch is $275p 6/20.
WSL
