$ETH Surprised $2.4K Price Mega Big pumping & touch to $3K ✨ CRYPTOCAP:ETH Surprised $2.4K Price Mega Big pumping & Trying to $3K Milestone again.
💫 From Breaking News:
• Ethereum Foundation Invests $32.65M in Ecosystem Growth
• Ethereum To Expand Network Capacity with Gas Limit Increase
Ethereum blockchain is preparing for a major upgrade that could make its network faster, cheaper, and more efficient. Developers have proposed raising the gas limit by 66% in a new development, from 36 million to 60 million units.
This change aims to improve the number of transactions the network can handle per block. This is to help users and developers enjoy smoother and more affordable activity on the blockchain.
Developer Says Testing Success Leads to Mainnet Rollout
Ethereum core developer Parithosh Jayanthi recently confirmed that the upgrade had passed early tests and is now ready for broader use. The new gas limit was successfully tested on the Sepolia and Holesky testnets. According to Jayanthi, the final rollout to Ethereum’s mainnet will begin shortly.
This is the second time Ethereum has raised its gas limit in 2025. The first increase happened in February, when the limit increased from 30 million to 36 million. These changes came after there hadn’t been any gas increase on the network since 2021.
#Write2Earn #ETH #BinanceSquareFamily #MarketRebound #SUBROOFFICIAL
Disclaimer: This article is for informational purposes only and does not constitute financial advice. Always conduct your own research before making any investment decisions. Digital asset prices are subject to high market risk and price volatility. The value of your investment may go down or up, and you may not get back the amount invested.
Chartanalysis

XAIUSDT — profit protection, risk management, area of interestXai (XAI) - is a cryptocurrency designed to revolutionize the gaming industry by enabling real economies and open trade within video games. Developed by Offchain Labs, Xai operates on the Arbitrum platform, a layer-2 scaling solution for Ethereum, which enhances its efficiency and scalability.
One of the standout features of Xai is its integration of Explainable AI techniques. These techniques make automated trading bot systems more transparent and trustworthy, addressing a significant concern in the cryptocurrency space. This transparency is crucial for fostering trust among users, particularly in the context of in-game economies where players trade valuable items.
📍 CoinMarketCap: #373
📍 Twitter(X): 308.5K
___________________________________________
🛡️ Risk Management and Approach:
When trading low-liquidity coins , I allocate a specific portion of my portfolio in advance for such trades.
These funds are split across different projects , which allows for diversification and helps mitigate potential scams .
If one coin pair dies — it's not critical , as long as the portfolio is structured properly.
📉 Current Situation:
On the broader view, the price is moving within a large descending channel .
Right now, it's near the outer support of the inner channel.
Since I’ve already allocated funds for this coin, I’ve taken a small entry near the support of the inner channel , and I plan to add more in the lower marked zone .
There’s a high probability of price chop due to news (tariffs, rates, debt ceiling, refinancing), and I take that into account.
💭 General Thoughts:
Diversification is key. You can never rule out the possibility that any project might end up as a scam. But with proper portfolio structure, that’s not a major issue .
There’s nothing to fear if you have a clear plan and tactics for different scenarios.
Like many other coins right now, I see the current accumulation zones as solid .
🔁 Additional Observation:
The recent mass delistings on Binance mainly target projects listed during the 2021–2022 distribution phase.
There’s a chance the exchange is cleaning up future risks , while “fresh” coins listed under the new conditions may stay longer.
📌 This post is not financial advice. It reflects my observations, actions, and logic in managing the position.

1,700% in a day $NXTT from $0.31 to $5.67I've sent out buy alert at $1.50 as soon as I thought was safe enough to get in, even if I watched it before that but at that time volume was still too low and it was halting on both sides too much. It needed some extra time to get safer price action even if it meant missing some of the move, but at the end from $1.50 up to $5.50 is more than enough if you really wanted to milk it all the way.
NASDAQ:NXTT

Take-Two: Keep at It!Take-Two recently hit a new all-time high but quickly pulled back. While the stock tried to recover, it encountered renewed selling pressure. With that all-time high, it came close to the lower edge of our beige Target Zone between $241.59 and $257.87. In our primary scenario, we still expect this zone to be reached as part of the beige wave b. However, there’s a 33% chance the stock will fail to make it there and instead turn lower early—forming a premature corrective low for the blue wave alt.(II) within the blue Target Zone between $107.47 and $46.

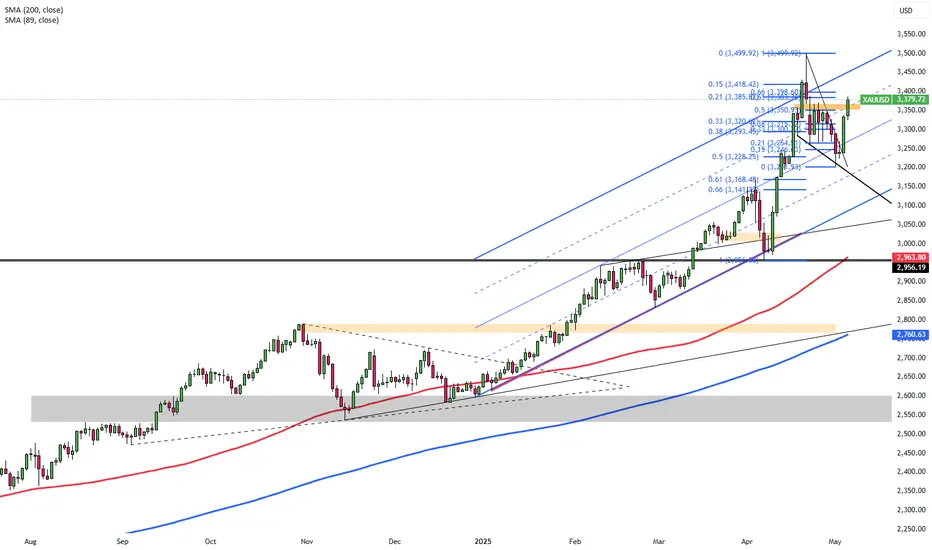
Gold Slips Toward $3,290 on Trade OptimismGold extended losses for a third day, dropping toward $3,290 as market appetite for risk improved ahead of U.S.-China trade talks. The announcement of a U.S.-UK trade deal also contributed to reduced safe-haven demand. The Fed held rates steady as expected, warning of risks to inflation and jobs but avoiding any hint of preemptive cuts. Still, gold is poised for a weekly gain.
Resistance is seen at $3,360, $3,430, and $3,500, while support holds at $3,270, $3,200, and $3,165.

Pound Steadies with Trade Deal ReliefThe GBP/USD pair opened Thursday with gains following the Bank of England’s expected 25 basis point rate cut, but the pound’s momentum faded as attention turned to U.S. trade developments. By Friday morning, the pair was trading around 1.3240.
Sentiment shifted toward the U.S. dollar after the Trump administration announced an upcoming trade deal with the UK, helping Britain avoid steep reciprocal tariffs originally set to resume on July 9. While some relief came from Trump’s earlier ‘Liberation Day’ delay, a broad 10% tariff on all UK imports to the U.S. remains on track, potentially weighing on sentiment. Refined ethanol has been fully exempted, though U.S. import data shows none has been sourced from the UK in over 15 years.
If GBP/USD breaks above 1.3280, resistance levels come in at 1.3450 and 1.3550. Support lies at 1.3160, followed by 1.3000 and 1.2960.

Euro Nears 1.1230 on Cautious ECBEUR/USD edged up to 1.1230 in Friday’s Asian session, paring earlier losses caused by stronger U.S. data and easing trade tensions that supported the dollar. The euro remains under pressure as markets price in possible ECB rate cuts by June, though officials maintain confidence in inflation reaching the 2% target by year-end.
The pair faces resistance at 1.1260, with further upside capped near 1.1460 and 1.1580. On the downside, support is seen at 1.1150, followed by 1.1100 and 1.1050.

Yen Falls Past 145 as Dollar StrengthensThe Japanese yen weakened past 145 per dollar, hovering near a one-month low as the U.S. dollar strengthened with improving global trade sentiment and diminishing expectations of near-term U.S. rate cuts. The greenback gained momentum after President Trump announced a preliminary trade deal with the UK, the first since broad U.S. tariffs were introduced last month. He also signaled that tariffs on China could be eased, depending on the outcome of high-level trade talks set for this weekend in Switzerland.
Adding pressure on the yen, Fed Chair Powell dismissed the idea of a preemptive rate cut, citing persistent inflation risks and labor market concerns. In Japan, personal spending rose more than expected in March, suggesting resilience in consumption, though a third straight monthly drop in real wages highlighted broader economic challenges.
Resistance stands at 145.90, with further levels at 146.75 and 149.80. Support is found at 139.70, then 137.00 and 135.00.

Electronic Arts: Jump!Recently, EA has made a strong upward jump, coming very close to the significant resistance at $169.82. However, the price quickly fell again, providing us with sufficient confirmation to consider the magenta wave (2) as completed. The current wave (3) should extend below the support at $114.60, and the subsequent wave (4) countermovement should also occur below this mark. With the final wave (5) of the magenta downtrend impulse, the larger green wave should then be completed. On the other hand, we see a 40% chance that EA has already completed the green wave alt. at $114.60 and will directly rise above the resistance at $169.82 during the beige wave alt. V .

$BTC Finally $100K Surprised and Take Profit Done✨ CRYPTOCAP:BTC Surprise Finally Touch $100K Milestone again, All Take Profit and bonus Done.
💫 From Breaking News:
• Arizona Bitcoin Bill: Crucial SB 1373 Advances for State Bitcoin Reserve
• New Hampshire Becomes First to Approve Bitcoin Reserve—Will Other States Follow?
First introduced in January, HB 302, gives officials the ability to allocate state funds to both precious metals, and specific digital assets with a market capitalization of over $500 billion. That means Bitcoin, which, as of this writing, has a market cap of roughly $1.9 trillion per TradingView, is a prime candidate.
The newly enacted law states that any digital assets obtained must be kept using high security custody protocols. This can be done directly in a state managed multisignature wallet, via a qualified financial institution custody, or by investment in U.S. regulated exchange traded products (ETPs). Dennis Porter, CEO and Co-Founder of Satoshi Action, said:
“Satoshi Action drafted the model, New Hampshire engraved it into law, and now every treasurer nationwide can follow that roadmap. HB 302 proves you can protect taxpayer money, diversify reserves, and future-proof state treasuries all while embracing the most secure monetary network on Earth. New Hampshire didn’t just pass a bill; it sparked a movement.”
#Write2Earn #BTC #BinanceSquareFamily #MarketRebound #SUBROOFFICIAL
Disclaimer: This article is for informational purposes only and does not constitute financial advice. Always conduct your own research before making any investment decisions. Digital asset prices are subject to high market risk and price volatility. The value of your investment may go down or up, and you may not get back the amount invested.

$CRWD double top off W into overbought, $400 pullbackNASDAQ:CRWD on watch for put swing. We have a possible double top off accelerated upswing momentum. Expecting a pullback into the 50 and 20 EMAs.
WSL

ETH/USDT – Ascending channel. Breakdown below support?Ethereum - is a smart contract platform that allows developers to build decentralized applications (DApps) on its blockchain.
CoinMarketCap : #2
↗️ Ethereum is moving within an ascending channel, and the bullish trend remains intact.
Inside the channel, there are two triangles.
The first triangle, with a base of 88%, has played out—its third wave broke through the triangle.
Liquidity grabs and shakeouts before the growth in the inner channel zones are marked with yellow circles.
Currently, we see a mirrored situation with a new triangle, this time with a 156% base. However, if this pattern plays out, it will break the ascending channel.
At the moment, the price has been dragged below the channel support, and there is a lot of negative sentiment in the news and opinions. Few believe in an upward move, and many have been liquidated. To me, this looks like a strong trigger.
⤵️The bearish scenario implies a -61% drop. (A less likely scenario.)
I've marked everything on the chart—consider this in your trading strategy. Remember, there's a lot of negativity around Ethereum, just like with all altcoins...
I also believe that on the monthly chart, it will end up being just a wick of the candle.

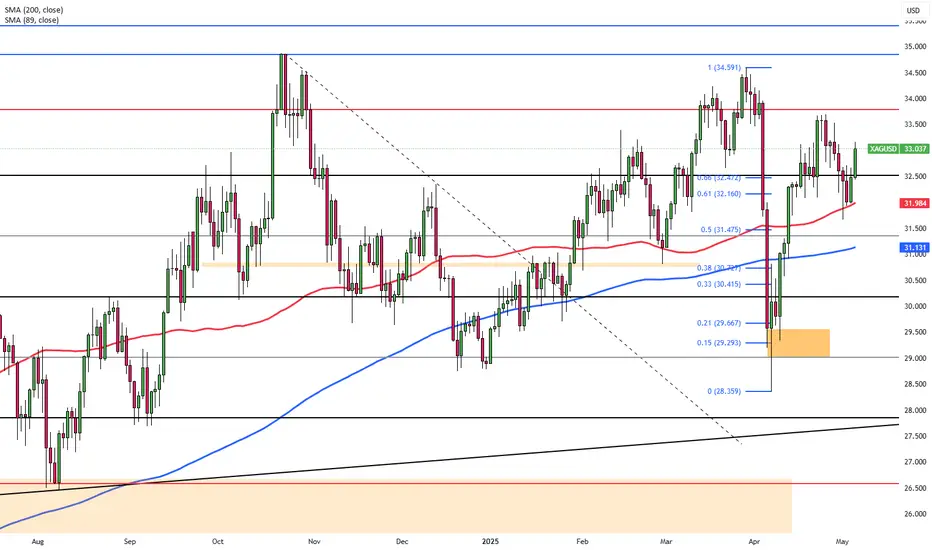
Silver Slips as Fed Holds RatesSilver rose more than 1% to approach the $33 mark on Thursday, supported by renewed interest on precious metals with ongoing trade and economic uncertainty. The Federal Reserve left interest rates unchanged, with Chair Powell citing heightened risks while dismissing the need for early rate cuts. Sentiment was also influenced by President Trump’s announcement of an imminent trade deal, reportedly with the UK, and his firm stance on maintaining tariffs against China ahead of upcoming negotiations.
Technically, resistance is seen at $33.80, followed by $34.20 and $34.85, while support levels are noted at $32.00, $31.40, and $30.20.

Gold Dips Toward $3,360 as Fed HoldsGold slipped to around $3,360 per ounce on Thursday, pressured by the Fed’s cautious tone after keeping rates unchanged. Chair Powell dismissed preemptive cuts and highlighted inflation and labor market risks, dampening demand for non-yielding assets. However, gold's downside was limited by trade uncertainties as Trump reaffirmed tariffs before U.S.-China talks in Switzerland.
Resistance is expected at $3,460, followed by $3,500 and $3,550. Support sits at $3,320, with further levels at $3,300 and $3,265.

GBP Steady Near $1.33, BoE Rate Cut ExpectedThe British pound hovered near $1.33 as traders awaited the BoE’s decision, with a 25 bps cut to 4.25% widely expected. Markets are also eyeing new economic forecasts for signals of further easing. While Trump’s tariff plans have stoked global slowdown fears, the UK is less exposed due to a U.S. goods surplus. A fresh trade deal with India, expected to generate £4.8 billion annually by 2040, may also cushion the economy.
If GBP/USD breaks above 1.3430, resistance levels come in at 1.3500 and 1.3550. Support lies at 1.3200, followed by 1.3050 and 1.2960.

Euro Strengthens on Political ShiftsEUR/USD traded just above 1.1300 on Thursday, staying in a tight range as reduced political uncertainty in Europe and a softer U.S. dollar offered mixed cues. The euro was supported by news of Friedrich Merz becoming Germany’s chancellor, while the dollar struggled despite a hawkish Fed pause, as Powell flagged tariff-related risks. Traders are focused on Trump’s press conference at 14:00 GMT and U.S. jobless claims for near-term direction.
Resistance is seen at 1.1460, with higher levels at 1.1580 and 1.1680. Support lies at 1.1260, followed by 1.1200 and 1.1150.

Yen Firms with BoJ CautionThe Japanese yen strengthened to around 143.6 per dollar on Thursday, recovering as rising global trade uncertainty stimulated demand for gold. The move followed President Trump’s announcement of a deal with a “big” country, reportedly the UK, and his refusal to cut tariffs on China ahead of U.S.-China talks in Switzerland. U.S.-Japan negotiations continue, with Tokyo aiming to finalize a bilateral deal by June. Meanwhile, BoJ minutes showed policymakers remain open to rate hikes if inflation targets are met, though they flagged external risks from U.S. trade policy.
Resistance stands at 145.90, with further levels at 146.75 and 149.80. Support is found at 139.70, then 137.00 and 135.00.

Bitcoin Total Market Cap Update – Strategic Scenarios AheadAs of May 8, 2025, the total cryptocurrency market capitalization stands at approximately \$3.012 trillion, reflecting a 2.17% increase from the previous day . Bitcoin's market cap is around \$1.962 trillion, with a current price of \$98,798.11 .
Given these figures, we are considering the following potential scenarios for the crypto market:
---
1. Break Above \$3T and Hold ✅ (30% Probability)
* The market breaks through the \$3 trillion level.
* Retests it as support.
* Continues the bullish momentum from there.
---
2. Rejection and Consolidation 🔁 (50% Probability)
* Price gets rejected at \$3T.
* Moves sideways between \$2.8T and \$3T.
* Eventually breaks out and retests \$3T as support before resuming upward.
---
3. Bearish Turn Below \$2.8T 🔻 (20% Probability)
* Rejection at \$3T.
* Market loses \$2.8T support.
* Retests \$2.8T as resistance, followed by further downside pressure.
---
Key Levels to Watch
* \$2.8T and \$3T are critical zones. Movements between these levels indicate uncertainty and should be approached with caution.
---
Our Perspective
A retest of \$3T as support could present the strongest buying opportunity of this cycle. We urge everyone to stay alert, analyze carefully, and prepare accordingly.
Golden Cross is looming — remain focused and disciplined.
---
Stay updated and connected:
With best regards,
Team ProCryptoEdge
Educate. Empower. Elevate.

Coinbase: Catching BreathCoinbase is currently catching its breath in a sideways movement. We still attribute more upside potential to the ongoing wave b in orange, expecting it to rise close to the resistance at $422.11. However, wave c should start below this mark and ultimately complete the blue wave (ii) above the support at $138.45. The subsequent blue wave (iii) should then carry the price significantly above the $422.11 mark.

Link/USDT"This is Link . Based on the daily timeframe, we’re in an uptrend aiming for the targets you can see. If you enjoy this kind of analysis, make sure to like and subscribe to our channel!"

Microsoft: Progress!Microsoft successfully completed the magenta wave (2) and made further progress during the subsequent wave (3). Imminently, this wave (3) has some more room to rise, and after a temporary pullback in the following wave (4), the price should eventually overcome the resistance at $456.16. On the other hand, our 31% likely alternative scenario envisions a new low for the green wave alt. and would include a detour below the support at $348.18. Primarily, we consider the regular wave as already completed (in our previous Target Zone).

XAG/USD Stable Ahead of Fed DecisionSilver (XAG/USD) held steady on Tuesday, underpinned by safe-haven demand as U.S. tariff tensions and global growth concerns persisted. Although the U.S. dollar saw a slight recovery, silver maintained its ground with markets focused on the upcoming Federal Reserve policy decision. Expectations for unchanged rates and possible future easing could continue to lend support to silver in the near term.
The first resistance is seen at $33.80, with higher levels at $34.20 and $34.85 if momentum builds. Support begins at $32.00, followed by $31.40 and $30.20.
Gold Climbs on Safe-Haven DemandGold climbed to nearly $3,360 per ounce on Tuesday, marking its highest level in over a week, as renewed tariff threats from President Trump increased safe-haven demand. Trump announced a 100% tariff on foreign films and signaled upcoming measures targeting pharmaceuticals. Investors are now focused on the Federal Reserve’s policy decision, with rates expected to stay unchanged despite Trump’s push for cuts.
Resistance is expected at $3,385, then $3,450 and $3,500. Support stands at $3,300, followed by $3,265 and $3,200.