Mastercard: Approaching the Top of Wave BMastercard has rebounded after a brief cooling period, and we now expect turquoise wave B to complete just below resistance at $620. Once that top is in, wave C should drive a meaningful retracement, ending with the low of magenta wave (4). Alternatively, if turquoise wave alt.(4) has already bottomed — which we estimate as a 40% probability — then a direct breakout above $620 would suggest a shift toward a much more aggressive advance. That path would take the stock straight into magenta wave (5), completing blue wave (I) with a strong rally.
📈 Over 190 precise analyses, clear entry points, and defined Target Zones - that's what we do.
Chartanalysis

Uber: Topped out Already?Uber sold off sharply after topping out at $94.10 – thus, our short-term alternative scenario needs to be considered. In this view (35% probability), turquoise wave alt.3 has already concluded, and the stock is headed toward a pullback in wave alt.4 . That retracement would likely bottom in the turquoise Target Zone between $65.94 and $57.24 — a potential setup for long entries. The primary scenario remains more bullish: we expect a renewed push above $94.10 to complete the regular turquoise wave 3.
📈 Over 190 precise analyses, clear entry points, and defined Target Zones - that's what we do.

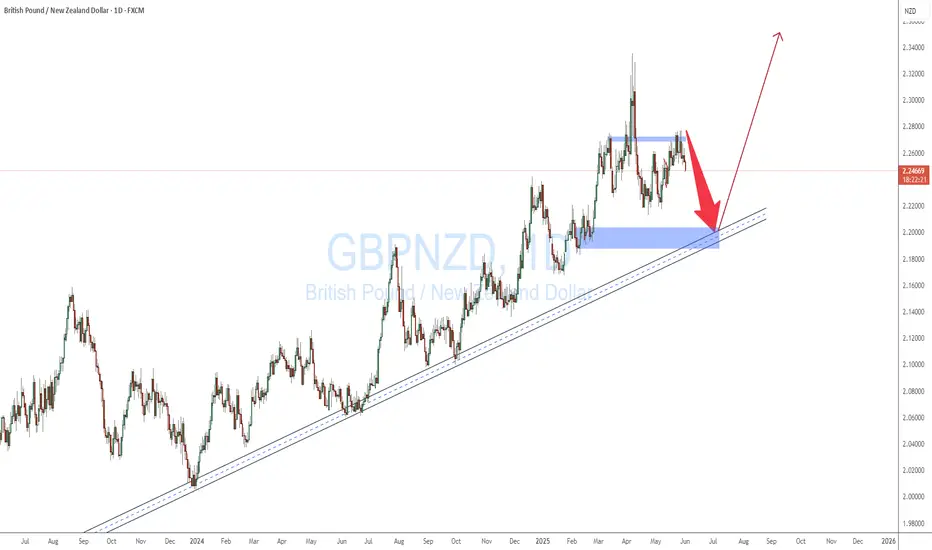
GBPNZD TANK BEFORE THE SURGEGBPNZD is expected to fall o the daily dynamic support before the surgeto break the next high.
the pair keeps tanking from a a dailt TF quasimodo LEVEL
$AMD $120 retest then $130 push through. R/R looks incredible..Hello, NASDAQ:AMD Advanced Micro Devices, INC looks TASTY. I'm almost salivating. NASDAQ:NVDA may take a backseat and NASDAQ:AMD could start seeing monster upside. Something in my gut is telling me this name wants to GO. I'm looking at $120c for 6/20 and $130c for 6/20. This thing can launch.. it's hanging on an upside trendline, it may break but this $110 area may represent local support. Earnings report were good and after an abysmal 2024 after having highs and totally wiping them out hitting lows of $80, I think this could be the time for NASDAQ:AMD longs. It has taken the 20 day EMA/SMA over and now could curl to the 200 day EMA/SMA. 200 SMA is $126. This seems like a really good setup especially R/R here. Very cheap calls for a name that can see a 10-15% week.
WSL.

$UNH contrarian idea ..Hello, this seems to be the "BUY THE DIP!" name definitely on the retail side. A guy once told me, if everyone is talking about getting into something, buying something, it might be a good time to sell and get out of that something. Example: I have been buying Bitcoin for five years, the price has risen and now everybody is talking about Bitcoin, that might be a clear indicator to sell some of that position and take profits; contrarian. So, something is telling me this name isn't ready to just ride to the upside like everybody is imagining. A big zone is down around $200, a 7 year demand. This name is in turmoil, randomness happens. I believe the name would have kept going down if the insider buy did not come in and bring some momentum. I can see this name retracing back to $275 and below. Will be interesting to see. On watch is $275p 6/20.
WSL

$FI bounce coming off 30% ATH drawdown $170 targetHello, NYSE:FI Fiserv evidently got hammered to the downside the last month and last few months the name is down 30% from it's all time high from March 2025 and last month and change it is down 25% or so after downgrades. I have been watching the name the last week or so and I was looking for a drop into a zone of activity in the $152-$154 but it seems that $158-$160 is a strong area of support. Now I am tempted to grab some calls on this name but I am unsure the outcome. The latest Daily candle accumulated the most volume it's had in 2 weeks above 11 million. It bounced off the zone area highlighted. The calls I added to my watch were $170c for 7/18, last week they bottomed around $2.00-$2.20 and they closed (5/30/2025) at $3.30. That's a good move in itself. Will be watching.
WSL

$1 to $7.18 continued to 600% vertical $BMGLIt just didn't want to stop ripping higher, congrats if you got in if not sooner then at least when I posted a chart in $3's there was still time to catch a doubler up into $7's NASDAQ:BMGL

Bitcoin analysis based on Heiken-Ashi4hr, daily forecast based on HA pattern. We'll come back to validate it.
E-Mini Nasdaq 100 analysis based on Heiken-Ashi15m, 4hr, daily forecast based on Heiken-Ashi chart pattern, as I couldn't find any patterns on 1 hour chart, ones that found were already validated by this time. We'll come back to this to validate it.
BTCUSD HTF cycle analysis
Hi, I’m from Phoenix FX, and today I’ll be sharing my perspective on Bitcoin (BTC) price action based on the higher timeframes.
I’ll also give you my outlook on potential trade setups for today and tomorrow. Please remember that this is not financial advice—use this information as a guide only. If you find it helpful, don’t forget to like and share it with your like-minded communities.
Higher Timeframe Analysis
In my view, BTC tends to follow clear bullish and bearish cycle zones. Typically, we see a pump to new all-time highs (ATH), followed by the formation of resistance and a retracement down to a key support level. Our trading approach focuses on identifying those critical support and resistance levels, with some interim trades based on shorter-term analysis—occasionally even counter-trend, depending on the day’s market bias.
Over the past eight years, BTC has respected a major trend resistance line. The most recent ATH, around $112K, reconfirmed the relevance of this trendline. This makes it a valuable tool for projecting future ATH levels.
Looking ahead, I expect a move towards the $115K level in the coming weeks. This would likely act as a point of resistance, at which stage we might see a reversal and a drop back down to a key support zone.
Trade Setup
The chart I'm referencing highlights what I would consider the first premium buy zone, identified using a 4-hour Fair Value Gap (FVG).
The 50% level of this zone sits at $99,450. If this zone fails to hold, we may drop further to the secondary premium buy zone, which aligns with our higher timeframe (HTF) trend support and a weekly FVG. The 50% level of this deeper zone is around $89,150.
A potential long entry at $92,550, with a stop loss around $88,000, offers an excellent risk-to-reward (RR) ratio, targeting a move up to the $115K level.
Intraday Outlook
For today, I see bearish price action, with potential rejection around the $104,300–$105,000 range. Go short around the $104,750 to $105,000 zone
This could lead to a move down toward the lower key zones highlighted in the HTF analysis.
I recommend taking partial profits (TP) at every $1,000 increment and setting your stop loss to breakeven (BE) after hitting the first target.
Final Thoughts
Price action analysis is always subjective, so I’d love to hear your thoughts and ideas in the comments—each one, teach one.
Thanks for giving me some of your time.
From the Phoenix FX team, have a great weekend!

Tesla: Completed!TSLA has moved somewhat closer to the resistance at $373.04 since our last update, but these gains have now been tempered. We now consider the turquoise wave 4 as finished and anticipate imminent sell-offs during wave 5. These should eventually complete the magenta wave (3) of a larger downward impulse below the support at $215.01. However, due to recent upward momentum, we have increased the relevance of our alternative scenario. We now consider it 38% likely that the stock has already completed the large correction of the blue wave alt.(II) with the last significant low and will continue to rise directly during wave alt.(III). In this case, the price would next not only rise above the nearby resistance at $373.04 but also overcome the higher levels at $405.54 and $488.50.
📈 Over 190 precise analyses, clear entry points, and defined Target Zones - that's what we do.

PepsiCo: In the Target ZonePepsiCo is currently trading in the middle of our active Long Target Zone (coordinates: $133.53 – $125.10). Although all technical requirements for the correction of wave a in beige have already been met here, we still see some remaining downward potential for the subordinate wave 5 in turquoise within our Target Zone. There's even a 36% chance that the price will fall below our Target Zone as part of the beige wave alt.a , which is relevant for any stop-loss orders and could potentially cause a significant short-term drop. In both our scenarios, however, we expect significant increases after the wave a low.
📈 Over 190 precise analyses, clear entry points, and defined Target Zones - that's what we do.

USDJPY SHORTUSDPY is expected to sell to complete the gartley pattern.
Look out for the quasimodo pattern on the 4hr or 8hr time frame to short

BEST XAUUSD M30 BUY & SELL SETUP FOR TODAY 📉📊 Gold (XAU/USD) Technical Outlook – Key Decision Zone Incoming! ⚠️📈
Gold prices are currently testing a crucial support zone around 3,251, following a strong bearish momentum. As shown on the M30 chart, the market is now at a make-or-break level, where two potential scenarios could unfold: either a bullish reversal toward the 3,280–3,300 area if price holds and confirms support ✅, or a bearish continuation if the level breaks, pushing price lower toward 3,220 or beyond ❌. Traders should watch for price action signals and wait for a clear breakout or strong bounce confirmation before entering any trades 🧠🔍. This is a high-volatility reaction zone — trade smart! 🎯📉📈

BEST GOLD M30 BUY SETUP FOR TODAY📉 Gold is currently showing signs of a potential pullback towards the key demand zone around 3,290–3,285 marked in purple. This area has previously acted as a strong support and could trigger a bullish reversal if price reacts positively here. 🟪 Once the price enters this zone and forms a bullish confirmation (like a rejection wick or bullish engulfing candle), we could see a strong upward move targeting 3,320+ 📈. Traders should stay alert for buying opportunities from this zone and avoid chasing the price before a clear confirmation! 🎯⚡

BNB/USDT"Binance, like Ethereum, is in its best condition right now. Do you think it will go up or down?"

Fed Minutes and Tariff Delay Support SilverSilver traded near $33.15 on Thursday, steady after Fed minutes showed a cautious rate stance amid economic uncertainty and trade tensions. The Fed held rates at 4.25%–4.5%, awaiting clearer data. Bond market volatility and questions about the dollar’s role weighed on sentiment. Silver remains under pressure from trade risks but gains support from being undervalued versus gold and a fifth year of global supply deficits. Markets now await US GDP and PCE data. Trump’s delay of the EU tariff and Brussels’ pledge to speed talks slightly increased risk sentiment.
The first critical support for gold is seen at 33.80 and the first resistance is located at 32.30.

Sterling Holds Ahead of U.S. GDPGBP/USD trades near 1.3435 on Thursday, pressured by a stronger US Dollar after a court blocked Trump’s “Liberation Day” tariffs, ruling he lacked authority to impose them. Markets now await preliminary US Q1 GDP data. Fed minutes showed rising uncertainty, with policymakers favoring a cautious, steady rate path. In the UK, food inflation rose for a fourth month, prompting Barclays to delay its rate cut forecast to February 2026, which may support the Pound.
The first critical support for gold is seen at 1.3425 and the first resistance is located at 1.3600.

Gold: Primarily HigherIn our primary scenario, we expect gold to set a new all-time high as part of the ongoing beige wave I. To achieve this, the price should soon generate more upward momentum during the subordinate light green wave 5 and surpass the current all-time high from April 22. Once the wave I cycle has concluded at higher levels, we anticipate the start of a new bearish phase. However, there remains a 40% chance that the precious metal has already completed the beige wave alt.I and is now entering a fresh downward cycle. Under this alternative scenario, the price would break directly below the supports at $3,123 and $2,970.
📈 Over 190 precise analyses, clear entry points, and defined Target Zones - that's what we do.

S&P500: Top Within ReachThe S&P has recently continued its upward movement, climbing higher into the magenta-colored Short Target Zone between 5,880 and 6,166 points. Primarily, we expect the top of the current wave (X) in magenta within this price range, after which a downtrend should follow with wave (Y). This final phase of the magenta three-part movement should lead the index into the green Long Target Zone between 4,988 and 4,763 points, completing the overarching green wave there. A rise above the upper boundary of the Target Zone and a breach of resistance at 6,675 points would trigger our alternative scenario.
📈 Over 190 precise analyses, clear entry points, and defined Target Zones - that's what we do.

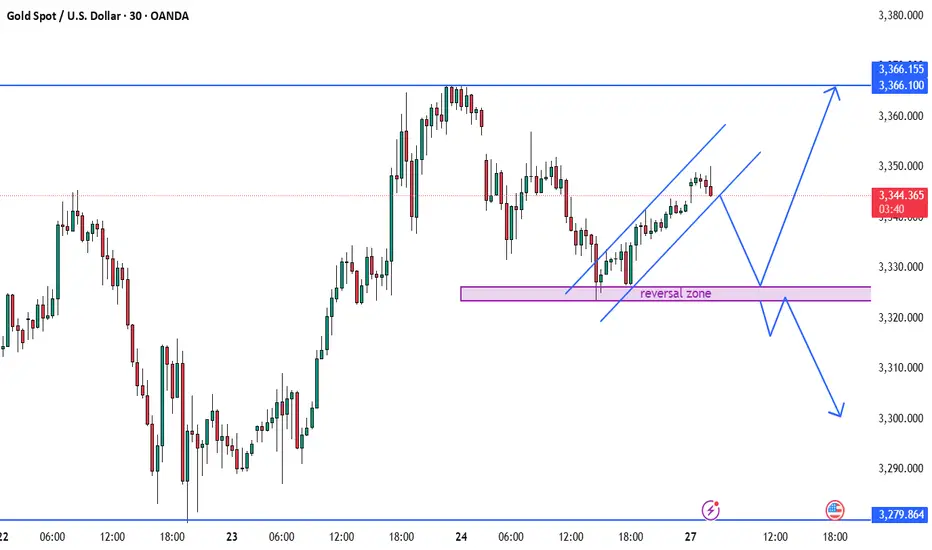
BEST XAUUSD M3 BUY AND SELL SETUP FOR TODAY 📊✨ Gold (XAU/USD) Technical Outlook – 30-Min Chart ✨📉
Price is currently trading within a rising channel after a bounce from the marked reversal zone 💜, suggesting a short-term bullish trend 📈. However, the chart outlines two key scenarios: if price breaks out upward, we may see a move towards the 3,366 resistance zone 🔼. Conversely, if the channel fails and price breaks downward, a retest of the reversal zone could trigger a deeper bearish move 📉, potentially targeting the 3,300 area or lower. Traders should watch for confirmation at key levels and react accordingly — not predict impulsively. 🧠⚖️📍
eth/usdtHello, this is my daily analysis for Ethereum and I think we are in the best place on the chart and we can have an upward trend. What do you think, friend?

Polygon: More (short-term) Upward PotentialFor Polygon’s POL, we primarily expect further corrective rises during the blue wave (iv), but below the $0.51 mark, renewed sell-offs should take over. These declines should then drive the price down below the support at $0.15, allowing the large wave to reach its conclusion there. Our alternative scenario – where the low of wave alt. in green would be already behind us (probability: 33%) – is still relevant. This scenario would be reinforced with a jump above the resistance at $0.51 but only finally confirmed with increases above the next higher level at $0.76.
📈 Over 190 precise analyses, clear entry points, and defined Target Zones - that's what we do.
