4H IDEA FOR GOLDAs we could not close above daily, we retraced back to 4H fvg. we expect to retest the daily level again.
Chartanalysis

EUR/CAD Bearish Flag Breakdown Toward Fibonacci SuppAnalysis
1. **Trend Breakdown:**
* The chart shows a clear **bearish structure** developing after a strong rally to the 1.58800 area (Fibonacci 1.618 extension level).
* Two upward trendlines were broken successively, confirming bearish momentum.
2. **Fibonacci Levels:**
* The retracement from 1.58800 down to the 0.382 level (1.54586) has held significant importance.
* Price action is respecting the **Fibonacci retracement zones**, with rejection near the 0.786 and 1.0 levels (1.56915 - 1.57109).
3. **Bearish Flag Pattern:**
* A small **bearish flag/pennant** formed after a strong drop, which has now broken downward.
* This confirms the **continuation of the bearish move**.
4. **Volume Confirmation:**
* Volume spikes during the initial sell-off and again on recent bearish candles suggest **strong selling interest**.
5. **Trade Setup (Marked on Chart):**
* **Entry:** Near 1.56443
* **Stop-Loss:** Around 1.57109 (just above recent highs)
* **Target:** Around 1.54848–1.54500 zone, aligning with prior demand and 0.382 Fib level
---
**Conclusion:**
The chart signals a high-probability **short setup**, backed by a break of structure, Fibonacci confluence, bearish flag breakdown, and volume. A continued decline toward the 1.54500–1.54800 region is likely, provided the price stays below 1.57100.

NetEase: Upward Surge!NTES generated a strong upward impulse, surging nearly 15% higher, including a gap-up. This brought the stock noticeably closer to the high of the green wave , which should ideally form just below the resistance at $134.44. After this peak, we anticipate significant sell-offs down to the $53.09 support level, where the beige wave II should conclude. Since a sustainable uptrend should follow this low, we have highlighted a magenta Target Zone (coordinates: $59.67 – $27.95), which is suitable for long entries. Once the zone is completed, the price should reach levels above the resistance at $134.44 during the subordinate green wave . This mark also plays a role in our alternative scenario (probability: 38%). If the price rises above the $134.44 resistance without previously reaching the Target Zone, we will have to consider an alternative corrective wave structure, with the price currently in the green wave alt. .
📈 Over 190 precise analyses, clear entry points, and defined Target Zones - that's what we do.

Apple: Wave [2] Correction We now consider the dark green wave to be complete and thus place AAPL in the intermediate corrective movement of wave , which can be further subdivided into waves (A), (B), and (C) in magenta. Currently, only the last part of this (C) wave should be missing before the next impulsive uptrend unfolds towards the previous all-time high. We must still weigh our alternative scenario with a 34% probability: If the price falls below support at $168, this scenario with a new low for the blue wave alt.(IV) would be confirmed, although in this case, the price should not fall significantly below our previous Target Zone.
📈 Over 190 precise analyses, clear entry points, and defined Target Zones - that's what we do.

Silver Slips to $33.31 on Profit-TakingSilver eased to $33.31 per ounce, pulling back slightly as investors booked profits after recent gains. The retreat came even as the dollar remained weak and geopolitical tensions, including the conflict in Ukraine, persisted. While momentum slowed, physical demand, especially from Asia, continues to provide a firm base for silver.
Support is at $32.30, with resistance at $33.80. Additional levels include $34.20 and $34.90 above, and $31.40 and $30.20 below.

Gold Holds Near $3,340 on Trade HopesGold remained steady at nearly $3,340 per ounce on Tuesday, with demand easing slightly due to renewed trade optimism after Trump pushed back EU tariffs to July 9. The EU pledged to speed up negotiations, lifting risk sentiment. However, worries over U.S. fiscal health, global trade dynamics, and geopolitical tensions kept markets cautious. Investors now await the FOMC minutes and PCE inflation data for policy cues.
Support is seen at $3,270, while resistance is located at $3,370. Further levels include $3,150 and $3,025 below, and $3,440 and $3,500 above.

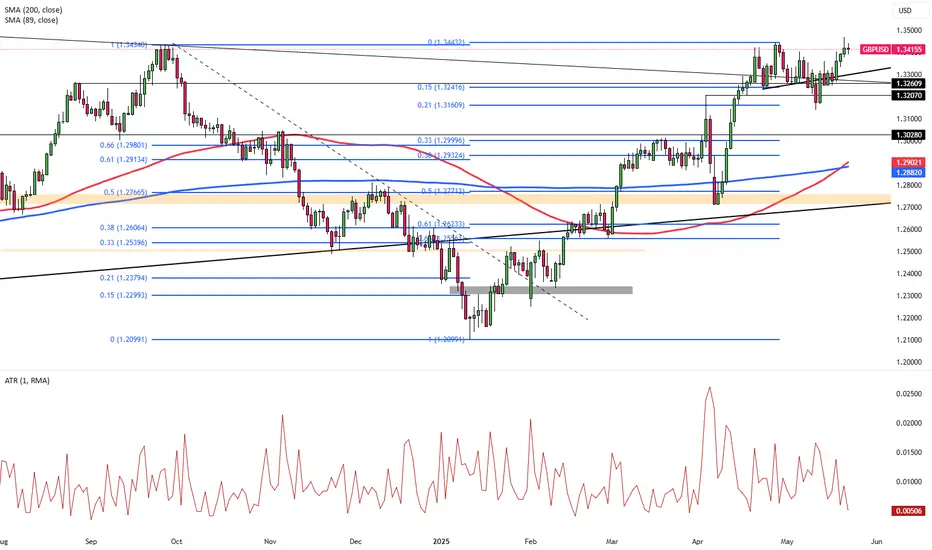
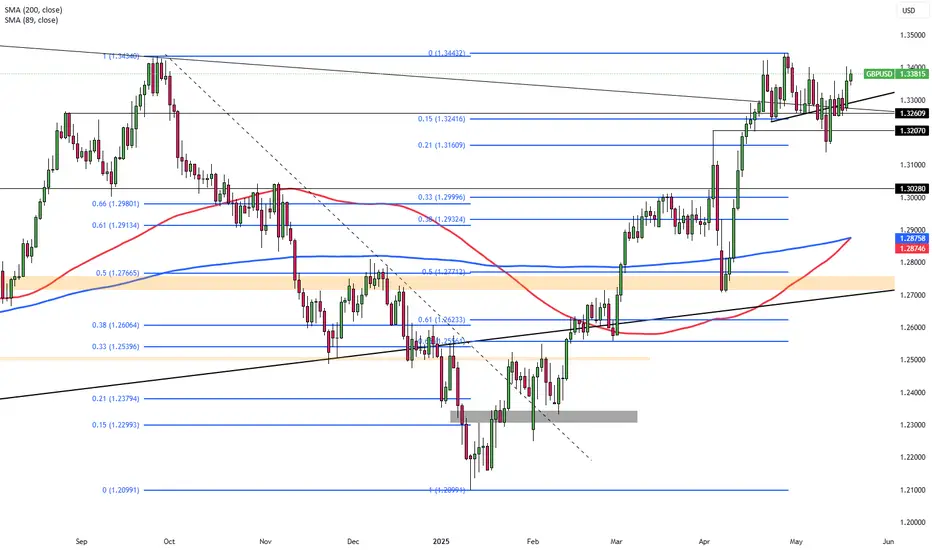
Pound Tops $1.357 on Solid DataGBP/USD advanced above $1.357, hitting its highest level since February 2022, as Trump’s delay of the 50% EU tariff boosted global sentiment. The pound also gained from promising April data, with retail sales rising 1.2%, marking the fourth monthly gain. Inflation stayed high at 3.5%, adding uncertainty over the BoE’s next move. Markets now price in a 50% chance of a rate cut by August, with another possible by year-end.
Support lies at 1.3425, with resistance at 1.3600. Other key levels are 1.3850 and 1.3750 above, and 1.3165 and 1.2890 below.

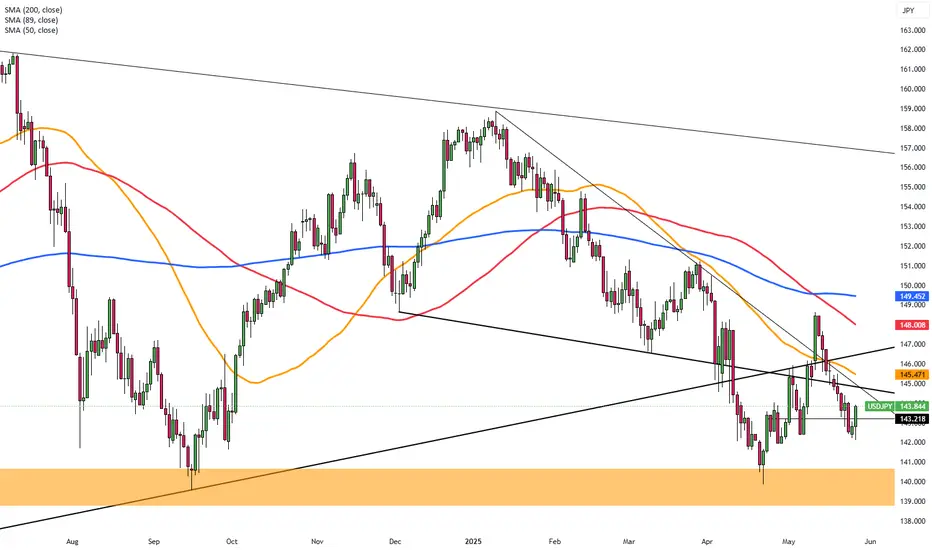
Yen Reaches Highest Level in a MonthThe Japanese yen strengthened toward 142 per dollar on Tuesday, its highest in four weeks, driven by safe-haven inflows and weak dollar sentiment tied to Trump’s fiscal plan. Worries over a widening U.S. deficit weighed on the greenback, while speculation of a 25% iPhone tariff added to trade conflicts. Domestically, expectations for more BoJ tightening rose after core inflation surprised at 3.5%, a two-year high.
Resistance stands at 148.60, with further levels at 149.80 and 151.20. Support is found at 139.70, then 137.00 and 135.00.
BTCUSD UPDATE : 27- 5 - 2025This chart shows a 1-hour time frame for Bitcoin (BTC/USD) on Bitstamp, with technical analysis indicating a potential bearish move. Here’s a breakdown of the chart:
Price Range: The chart highlights a trading range between approximately $102,714 (support) and $112,053 (resistance), marked with yellow zones.
Current Price: BTC is trading around $109,026.
Bearish Signal: A blue arrow points downward, suggesting an anticipated drop in price.
Pattern Suggestion: It looks like a potential double top or lower high is forming, signaling weakening bullish momentum.
Target Zone: The arrow points towards the support zone around $102,714, implying that the chartist expects BTC to fall to that level.
This type of analysis is often used for short-term trades and may involve setting stop-losses near $112,053 and profit targets near $102,714. Let me know if you'd like help interpreting this pattern further or backtesting the setup.

Canopy Growth: Further UpwardThe WEED stock has already realized considerable increases during the current green wave B, which we credit with even more upward potential. However, we primarily expect the top of this movement to be marked below the resistance at C$3.11, and subsequently, the price should move deeper into our magenta Target Zone between C$2.96 and C$0.90 to complete the larger wave ii in orange. The following wave iii should then lead WEED out of the magenta zone and peak above the mentioned C$3.11 resistance. If the stock already rises above this mark during the current movement, we will have to assume that wave alt. ii in orange has already concluded (probability: 37%).

Gold Price Forecast: Bullish Channel Points to $3,388 TargetGold (XAU/USD) is trading in a strong ascending channel on the 45-minute chart, currently at $3,357.51 (+1.91%). Repeated bullish bounces off the channel’s lower boundary (highlighted in orange) reinforce the uptrend. With support from a green trailing indicator and recent breakout momentum, the next target is projected near $3,388.88. Watch for continued strength above the $3,330 zone for confirmation.
Chart Analysis: Gold (XAU/USD) – 45-Minute Timeframe
Trend Structure:
The price is moving within a well-defined ascending channel, indicating a strong bullish trend.
Higher highs and higher lows are consistently formed, respecting both the upper and lower bounds of the channel.
Key Observations:
1. Support Validation:
Multiple successful retests of the lower trendline (highlighted with orange circles) show solid demand and trend continuation behavior.
These retests occur with minimal drawdown, suggesting buyers are stepping in confidently at channel support.
2. Bullish Momentum:
The recent price breakout above consolidation (seen around May 24-25) shows renewed bullish interest.
The price is also supported by a trailing green indicator (likely an EMA or a dynamic support line), which the price remains above — a further bullish confirmation.
3. Short-Term Target:
Projected target of $3,388.878 aligns with the upper bound of the ascending channel, making it a logical resistance level.
If this level is breached with strong volume, it could open the door for continuation toward $3,400+.

Top M30 XAU/USD Trade Setups for Today – Buy & Sell Opportuniti📊📉📈 Gold (XAU/USD) is currently trading within a key support zone 🟣, retesting after a previous bullish breakout. If the price holds this zone and forms strong bullish candles, we could see a move toward the 3,366 resistance level 🔵 and potentially higher toward 3,389 📈. However, if the price breaks below this zone with strong bearish momentum, a drop toward 3,280 🔽 becomes likely. Watch the price action closely within this zone, as it could lead to a decisive move. ✅ Patience and confirmation are crucial to avoid false breakouts. 💡

SILVER 1DA possible scenario for silver on the daily timeframe involves buying from the levels of 30.90-31.00 with further targets at 33.02, 34.8291 and the expected completion of the rounding pattern with a subsequent movement to the zone 40.0251
Everything is clearly depicted on the graph!
Have a good day!

Electronic Arts: Heading LowerElectronic Arts has dropped roughly 13% since our last update, continuing the expected decline within ongoing wave (3). This move is likely to break below support at $114.60 and gradually push the stock downward to the anticipated low. Our alternative scenario suggests the correction may already be done, but that path hinges on a convincing move above $169.82 — a threshold we’re not close to yet. For now, the downtrend remains in control.
📈 Over 190 precise analyses, clear entry points, and defined Target Zones - that's what we do.

SOL/USDTHello, I hope you are well. I left you the analysis of Solana. Tell me your opinion. I saw that it is bullish and it may reach the target I set. If the white area breaks, we can buy again and go up.

BEST XAUUSD M30 BUY AND SELL S FOR TODAYETUP Gold (XAU/USD) is currently trading in a tight **rising wedge pattern** 📈 on the 30-minute chart, just below a key **resistance level at 3,325** 🔼. The price action shows signs of consolidation, indicating that a breakout could be imminent. If the bulls manage to push the price above this resistance 🚀, we may see a strong upward continuation toward higher targets. However, if the wedge fails and price breaks downward 📉, there is potential for a retracement toward the **support levels at 3,304** and further down to **3,274** 🛑. This is a crucial decision point — traders should watch for a confirmed breakout or breakdown before taking positions ⚠️.

Sterling Extends Rally Amid U.S. Fiscal ConcernsGBP/USD extended its gains for a fourth consecutive session, trading near 1.3430 during Thursday’s Asian session. The pair’s upward movement is largely supported by continued weakness in the U.S. Dollar, following Moody’s downgrade of the U.S. credit rating from Aaa to Aa1, in line with earlier downgrades by Fitch in 2023 and S&P in 2011.
Moody’s cited projections that U.S. federal debt could surge to 134% of GDP by 2035, up from 98% in 2023, with the budget deficit potentially widening to nearly 9% of GDP. Key concerns include rising interest payments, growing social expenditures, and weakening tax revenues.
The first critical support for GBP/USD is seen at 1.3450 and the first resistance is located at 1.3250.
$ARB time to fly $1 this bull run 2025 and it's Last Wave...AMEX:ARB Time to Fly and Touching $1 this Quarter. I guess it will be happened and gain bonuses $1+ and $2+ if big investor entry on this token.
My Magic Indicator Say ARB Price have touch Yellow line. Previous Day, Bounce back to above Yellow Line and It's Bull Run 2025 for ARB .
From News: ARB Eyes Trend Reversal With Breakout Signal Above $0.45 This Week
Arbitrum is trading at $0.41 inside a falling wedge and a breakout above $0.45 might confirm a wide shift from its yearlong downward trend.
Arbitrum has formed a falling wedge with lower highs and higher lows now compressing price at $0.41.
If the price moves above $0.45 with strong volume this could confirm a new bullish pattern for $ARB.
The wedge has been forming since 2024 and a breakout may signal the start of a strong trend reversal.
The descending wedge pattern forming on the Arbitrum chart spans nearly one year, beginning from its 2024 highs near $2.50. Several failed rallies marked by red arrows define the top boundary, while green arrows at the base represent support retests. This structure has now tightened into a narrow apex where breakout probability increases significantly.
#Write2Earn #BinanceSquareFamily #Binance #BTC☀ #SUBROOFFICIAL
Disclaimer: This article is for informational purposes only and does not constitute financial advice. Always conduct your own research before making any investment decisions. Digital asset prices are subject to high market risk and price volatility. The value of your investment may go down or up, and you may not get back the amount invested. You are solely responsible for your investment decisions and Binance is not available for any losses you may incur. Past performance is not a reliable predictor of future performance. You should only invest in products you are familiar with and where you understand the risks. You should carefully consider your investment experience, financial situation, investment objectives and risk tolerance and consult an independent financial adviser prior to making any investment.

BEST XAUUSD M30 BUY SETUP FOR TODAYThis 30-minute chart of Gold Spot (XAU/USD) reflects a strong bullish momentum 📈, marked by a clear Break of Structure (BOS) and Change of Character (ChoCH) signaling a market shift to the upside. Price recently broke above an equal high (EQH) and is now testing a resistance zone labeled as a “weak high”, suggesting potential for further upside toward the next key supply zone 🔴. The projection highlights two possible scenarios: either a continued bullish rally into the supply area around 3,340 🏹, or a pullback to the demand zone near 3,280 🟦 before resuming upward movement. Traders should monitor for price reaction at current levels and be prepared for either a breakout or a healthy retracement for optimal entry opportunities 🎯.

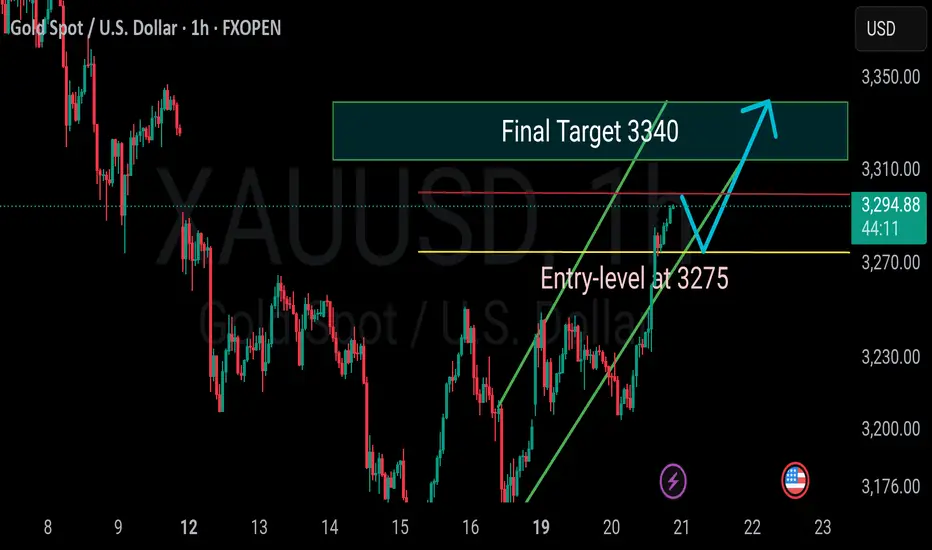
Gold (XAU) Technical Analysis – Bullish SetupGold is currently trading around 3290, exhibiting strong bullish price action, suggesting a favorable environment for buyers. The current momentum indicates a potential move towards the final resistance at 3340, making this a strong buy opportunity in the short term.
Trade Setup:
Buy Entry Zones:
Current price zone: 3290
Potential dip-buy zone: 3275 (possible fakeout/retest area)
Targets:
3300 – Minor psychological resistance
3310 – Near-term resistance
3320 – Intermediate target
3340 – Final resistance & major target
Stop-Loss:
Conservative: 3265
Aggressive: 3260 (below support/fakeout zone)
Analysis Summary:
The chart suggests continued bullish momentum. A minor retracement to 3275 may occur, which would provide a second entry opportunity for buyers. As long as price holds above 3260, the bullish structure remains intact, targeting incremental levels up to 3340.
Risk Management Tip: Adjust position sizing according to risk tolerance and maintain discipline around stop-loss levels.
Let me know if you'd like this in a visual chart format or if you'd like to include moving averages, RSI, or other indicators for deeper analysis.
Pound Climbs Above $1.336 on Strong UK DataThe British pound rallied past $1.336, reaching a one-week high and inching closer to its April peak of $1.34. The move was fueled by renewed optimism after the UK and EU reached a comprehensive post-Brexit agreement covering energy cooperation, defense partnerships, and fisheries rights through 2038.
Supporting the pound further, recent UK data exceeded expectations. GDP rose 0.7% in Q1 and 1.3% annually, easing pressure on the Bank of England to cut interest rates aggressively. Although rate reductions remain on the table, the strength of the economic rebound gives policymakers more flexibility.
Despite some concerns about rising unemployment and slowing wage growth, the upbeat GDP print has helped offset fears of an impending recession. Meanwhile, the US dollar continued to weaken following Moody’s credit downgrade, providing additional support to the pound.
GBP/USD now faces resistance at 1.3450, with higher targets at 1.3550 and 1.3700. Support is located at 1.3160, followed by 1.3000 and 1.2960.
XAUUSD M30 BEST BUY AND SELL SETUP FOR TODAYThis 30-minute chart of Gold Spot (XAU/USD) reveals a critical decision zone ahead 📊. Price is currently reacting to a support area around 3210, marked by the purple zone. A Change of Character (ChoCH) has just occurred, suggesting a potential bullish reversal if price holds above this support 📈. There are two likely scenarios:
1️⃣ A bullish continuation where price forms higher lows and targets the supply zone near 3230 and potentially the strong high at 3252, or
2️⃣ A bearish break below support, triggering a drop towards the demand zone at 3170 and possibly further into the order block (OB) near 3160 📉.
Traders should watch for confirmations like strong bullish candles or rejections at key levels before committing to a direction ✅. This is a high-probability setup with defined risk and reward zones! 💰📉📈
