BNB/USDTBNB$ pascal hard fork today and holding well above the 200-day EMA.
_ Expect a 10%-20% pump from here.
Chartanalysis

Silver Steadies Near $33.20 After PullbackSilver hovered near $33.20 on Friday morning after two consecutive sessions of decline. The recent upward momentum, initially fueled by China’s stimulus measures, has temporarily stalled. Nevertheless, the potential for further gains remains intact amid persistent uncertainty surrounding former President Trump’s tariff policies and escalating geopolitical risks. In addition, the Federal Reserve’s soft approach to interest rates, even if temporary, continues to support interest in non-yielding assets like silver.
If silver breaks above $33.75, the next resistance levels are $34.05 and $34.85. On the downside, support is at $33.10, with further levels at $32.50 and $32.15 if selling pressure increases.

Gold Nears $3,030 on Fed Cut HopesGold hovered near $3,030 on Friday, close to record highs and heading for a third straight weekly gain. The rally is driven by dovish Fed signals and strong safe-haven demand. The Fed reaffirmed plans for two rate cuts in 2025 amid rising economic uncertainty, while Powell downplayed Trump’s proposed tariffs as temporarily inflationary but saw no urgency to cut rates.
Geopolitical tensions also supported gold, with Israel escalating operations in Gaza, Hamas striking Tel Aviv and the U.S. continuing airstrikes in Yemen. Markets are also watching the April 2 deadline for Trump’s reciprocal tariffs, fueling trade concerns. Gold is up over 15% year-to-date.
Key resistance stands at $3082, with further levels at $3100 and $3,150. Support is at $3000, followed by $2,980 and $2,916.

GBP Retreats as BoE Maintains PolicyThe pound dipped below $1.30, retreating from a four-month high after the BoE held rates at 4.5% and signaled a cautious approach to easing policy, despite recent inflation progress.
Global trade tensions added pressure, with new U.S. tariffs prompting retaliatory moves and raising inflation risks.
UK data showed weak growth, steady 4.4% unemployment, and wage growth easing to 5.8%, in line with forecasts. In the U.S., the Fed kept rates steady but reaffirmed plans for two cuts this year.
If GBP/USD breaks above 1.3050, the next resistance levels are 1.3100 and 1.3150. On the downside, support stands at 1.2860, with further levels at 1.2800 and 1.2715 if selling pressure increases.

Lagarde Flags Slower Growth from U.S. TariffsThe euro fell below $1.085, retreating from its March 18 high of $1.0954, after ECB President Christine Lagarde warned of slower growth risks. Speaking to European lawmakers, she said a proposed 25% U.S. tariff on EU goods could cut eurozone growth by 0.3 percentage points in the first year, or 0.5 points if the EU retaliates. Lagarde added that the main impact would be front-loaded, with limited inflation pressures, suggesting the ECB is unlikely to raise rates in response.
Key resistance is at 1.0860, followed by 1.0950 and 1.1000. Support stands at 1.0800, with further levels at 1.0730 and 1.0670.

Yen Slips to 149 as Inflation EasesThe yen fell to around 149 per dollar on Friday, ending a two-day rally, after Japan’s core inflation eased to 3% in February from 3.2% in January, still above expectations of 2.9%. This marked the second month of stronger inflation, reinforcing the case for future rate hikes.
Earlier, the BoJ held rates at 0.5% and maintained a cautious stance, citing global uncertainties, particularly rising U.S. tariffs. The bank also reiterated its focus on monitoring currency moves. A stronger U.S. dollar further pressured the yen amid global growth and trade concerns.
Key resistance is at 150.30, with further levels at 152.00 and 154.90. Support stands at 147.00, followed by 145.80 and 143.00.

Gold (XAUUSD) H1 Chart Analysis with D1 Doji Candlestick InsightGold (XAU/USD) H1 Chart Analysis with D1 Doji Candlestick Insight
1. **Resistance Zone ($3,050 - $3,060)**
- Gold is currently testing a **resistance level** around $3,050.
- A clear **break and hold above this level** could push prices towards $3,070 or higher.
2. **Support Levels to Watch:**
- **Immediate support:** $3,040 (near 21 EMA)
- **Stronger support zone:** $3,030 (highlighted in red on the chart)
- **Major support level:** $3,020 (Key demand area)
3. **Doji Candlestick on D1 Indicates Possible Pullback**
- Yesterday’s **Doji candle on the daily timeframe (D1)** signals **market indecision** and a possible **retracement** before a continuation.
- If today's session follows with a bearish close, Gold may **reject the resistance zone** and fall towards the **$3,030 - $3,020 support area**.
4. **Bullish & Bearish Scenarios:**
- **Bullish:** If price breaks **above $3,050** and holds, we could see a rally towards **$3,070 - $3,080**.
- **Bearish:** Failure to hold above **$3,050** and a break below **$3,040-$3,030** could confirm the Doji signal, leading to a deeper correction.

GBPUSD Selling Opportunities SpottedWe are basically anticipating for more selling momentum as price formed a wedge at a resistance level. Also, lower timeframe price action shows more bearish activities.

$DIS keeping it simple, fake pump to $102 ishSimple chart. Seeing some NYSE:DIS flow coming in to the upside short term. Chart looks ok. Giving $100c 4/17 a try. Fill at $3.25.
WSL

Gold/EUR (XAU/EUR) – Bearish Reversal Zone IdentifiedThis Gold to Euro (XAU/EUR) 4-hour chart shows a breakout from a descending channel, followed by a strong bullish rally. The price has now reached a key resistance zone, where sellers might step in to push prices lower.
Key Observations:
Downtrend Channel Breakout: The price was previously moving in a downward sloping channel but has now broken out, signaling bullish momentum.
Resistance Zone: The price is currently testing a significant resistance level, indicated by the marked "Sell" area.
Potential Reversal: If selling pressure increases at this resistance, we could see a price decline toward the identified target support zones.
Key Support Levels:
First Target Zone: Around 2,750 EUR
Second Target Zone: Near 2,675 EUR
Trading Plan:
Sell Setup: Look for bearish confirmation (such as rejection wicks or a lower high formation) before entering a short position.
Stop Loss: Above the resistance zone to avoid false breakouts.
Take Profit: Based on the highlighted support areas.
If bulls continue pushing beyond resistance, it could invalidate the sell setup, leading to further upside movement. Traders should monitor price action closely for confirmation.

EUR/GBP Analysis – Bearish Momentum Gaining StrengthThe EUR/GBP pair has shown a significant shift in market structure, breaking below a critical support level and signaling further downside potential. After facing strong resistance near the 0.84400 region, the price struggled to maintain bullish momentum and started forming lower highs, indicating selling pressure.
Technical Breakdown:
Resistance Zone: The upper boundary near 0.84400 acted as a supply area where sellers gained control. Multiple rejection candles at this level confirmed that buyers were losing strength.
Support Breakdown: The price recently broke below a key support zone, which had previously acted as a demand area. This breakdown suggests a shift in market sentiment from bullish to bearish.
Bearish Continuation Pattern: The chart displays a clear lower high and lower low formation, reinforcing the bearish trend. The price is now retesting the breakdown zone, which could serve as a new resistance level before further declines.
Target Projection: The next major support lies at 0.82508, which aligns with a previous consolidation zone. If the bearish momentum persists, we may see a test of this level in the coming sessions.
Trading Considerations:
📌 Bearish Bias: Traders may look for sell opportunities on pullbacks toward resistance levels.
📌 Confirmation: A retest of the breakdown level with rejection signals could provide a strong entry point.
📌 Risk Management: Stop-loss placements above 0.83800 could help manage risk in case of an unexpected bullish reversal.
💡 Final Thoughts:
With the prevailing bearish momentum, EUR/GBP is likely to continue downward unless buyers regain control at key levels. Traders should watch for price action signals near support and resistance zones to confirm trade setups.

#FORMUSDT: Quick Breakdown of a Long Setup!📉 Long BYBIT:FORMUSDT.P from $1.9037
🛡 Stop Loss: $1.8313
🕒 1H Timeframe
⚡️Overview:
➡️ Current Price: $1.8831 — this is where BYBIT:FORMUSDT.P is trading right now.
➡️ The price recently dropped from around $2.0000 to $1.4000 — a sharp decline! But then it started recovering and is now in a consolidation zone.
➡️ Volume: At the bottom of the chart, you can see volume bars. There was a particularly large volume at the $1.4000 level, where the price reversed. This suggests a lot of activity — possibly big players starting to buy.
➡️ Key Levels: The right side of the chart shows important price levels:
➡️ $1.8313 — stop loss to protect us from losses.
➡️ $1.8932 and $1.88313 — the nearest resistance levels that the price needs to break to move higher.
➡️ $1.7464 — a support level below, in case the price goes down.
🎯 TP Targets:
💎 TP 1: $1.9690
💎 TP 2: $2.0400
💎 TP 3: $2.0890
⚡️ Plan:
➡️ Entry Point: $1.9037 — this is the level to enter the buy. The price is currently slightly below ($1.8831), so we need to wait for it to rise to this mark.
➡️ Stop Loss: $1.8313 — if the price falls below this, the trade will close with a small loss to minimize risks.
Risk/ Reward: If we calculate, the distance from the entry to the stop loss is $0.0724, and to TP1 — $0.0653 (a ratio of nearly 1:1). To TP2 — $0.1363 (1:1.88), and to TP3 — $0.1853 (1:2.56). This is a good profit potential if the price moves up!
📢 The BYBIT:FORMUSDT.P price just bounced off the strong $1.4000 level, where there was high volume. This could be a signal that big players started buying, and the market is ready to rise.
📢 The $1.9037 level (entry point) aligns with the POC (Point of Control) — the zone with the highest trading volume, which often attracts the price.
📢 If the price breaks the resistance at $1.8932, it could easily reach $1.9037 and then move toward our targets.
🎯 How Does This Signal Relate to the Market?
The recent news about the resolution of the #Ripple vs. #SEC case, which I wrote about earlier, creates a positive backdrop for the entire crypto market.
➡️ When major projects like #Ripple gain clarity, it adds confidence to investors.
➡️ Altcoins like BYBIT:FORMUSDT.P can catch this wave of optimism.
➡️ If the market continues to rise, BYBIT:FORMUSDT.P has a chance to break resistance and move toward our targets!
➡️ Important: The crypto market is volatile, so don’t forget about risk management. Don’t risk more than 1-2% of your deposit on a single trade.

Johnson&Johnson: Rejected AgainJohnson&Johnson has now been rejected at the $168.75 resistance level for the second time, pulling back more noticeably in response. However, in our primary scenario, we still expect an imminent breakout above this level, which should allow the turquoise wave X to establish its high well above it. Afterward, the turquoise wave Y should drive the stock sharply lower again, as we anticipate the low of the larger green wave in the corresponding long Target Zone between $138.78 and $125.75. That said, reaching this Zone is not a certainty. There remains a 35% chance that the low of the green wave alt. is already settled. Under this alternative scenario, the stock would break through $168.75 without resistance and continue its impulsive move higher.

Gold (XAU/USD) Pullback – Key Support Levels to Watch"📈 Chart Pattern:
Gold has been trading inside an ascending channel, showing a strong uptrend. However, the price has started to decline from resistance, signaling a potential correction.
🔹 Key Levels:
Current Price: $3,036.77
Support Target: $2,980.48 - $2,978.25 (First key support level)
Stronger Support: $2,829.63 (Major trendline support)
📊 Trading Plan:
Short-term traders may look for a sell setup toward $2,980 if the price continues its pullback.
Buyers should wait for support confirmation before entering long trades.
If price breaks below $2,980, the next support to watch is around $2,829.63.
⚠️ Risk Management:
A return above $3,050 could invalidate the bearish pullback scenario.
If the price bounces from support, buyers could target new highs.
💡 Conclusion:
Gold is currently experiencing a pullback after a strong uptrend. Watch key support zones for potential trade opportunities. 📉📊

Silver (XAG/USD) – Rising Wedge Breakdown & Bearish OutlookChart Overview
This is a 1-hour chart of Silver (XAG/USD) from OANDA, showing recent price action forming a rising wedge pattern followed by a bearish breakdown. The price initially rallied within the wedge but failed to sustain gains above the key resistance zone, leading to a strong rejection and downward momentum.
Key Chart Elements & Analysis
1. Rising Wedge Formation (Bearish Pattern)
The market was in an uptrend, forming higher highs and higher lows within a rising wedge pattern.
A rising wedge is a classic bearish reversal pattern, which indicates weakening buying pressure as price consolidates upward.
The price eventually broke below the lower trendline, signaling a shift in momentum from bullish to bearish.
2. Resistance Zone & Rejection
A strong resistance zone was identified around $33.80 - $34.20 USD (highlighted in blue).
Price attempted multiple times to break above this level but faced selling pressure, leading to a sharp reversal.
The final breakout attempt failed, confirming that sellers are in control.
3. Breakdown & Retest of Support
After breaking down from the wedge, the price found temporary support around $33.20 USD, which aligns with a previous consolidation area.
A retest of the broken wedge support turned into resistance, further confirming the bearish bias.
The rejection from this level strengthened the case for a move lower.
4. Next Support Level & Target Projection
The next significant support zone is around $31.95 - $32.00 USD (marked as the "Target" area).
This level coincides with previous price action support, making it a high-probability bearish target.
The breakdown is expected to follow a measured move projection, bringing price toward this level.
Trade Plan & Execution Strategy
📉 Bearish Setup (Short Opportunity)
Ideal Entry: A pullback to the previous support (now resistance) at $33.20 - $33.40 USD could offer an entry for shorts.
Stop-Loss: Above $33.80 USD, just above the resistance zone.
Target Levels:
Primary Target: $32.50 USD
Final Target: $31.95 - $32.00 USD
Confirmation: Look for price rejection or bearish candlestick formations at resistance before entering.
⚠️ Risk Management & Considerations
Bullish Scenario: If price reclaims $33.80 USD, the bearish setup could be invalidated, and a move higher toward $34.50 USD is possible.
Market Conditions: Keep an eye on macroeconomic factors, news events, and USD strength, as they can influence silver prices.
Conclusion: Bearish Outlook with Downside Target 🎯
The rising wedge breakdown signals further downside potential.
A support retest rejection confirms selling pressure.
$31.95 - $32.00 USD remains the main target, aligning with technical projections.
Short positions with proper risk management remain favorable in this setup.

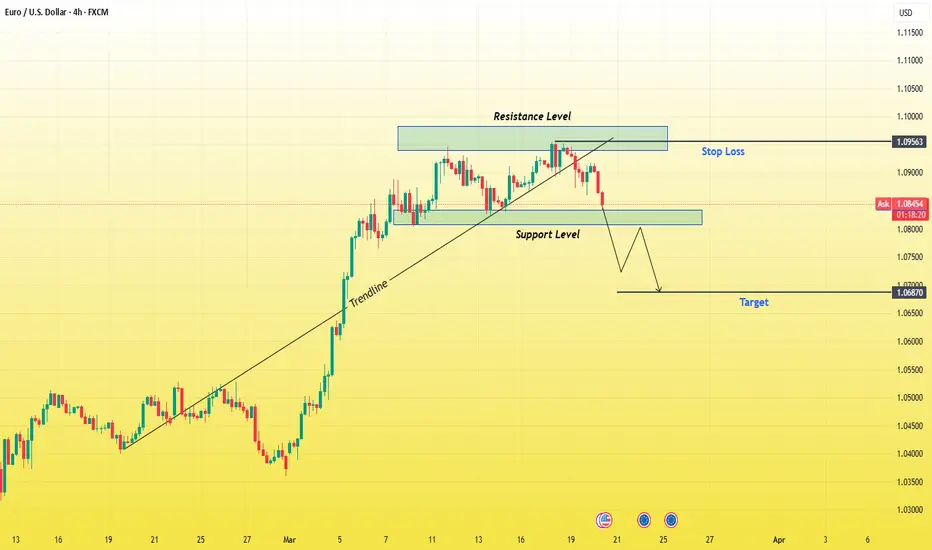
EUR/USD 4H Analysis – Bearish Breakdown Setup1. Market Structure & Trend
The EUR/USD chart shows a previous uptrend, confirmed by the ascending trendline, where the price made higher highs and higher lows. However, the trendline has now been broken, signaling a potential shift in market direction. The price is currently retracing from a key resistance zone, and a possible bearish continuation is expected.
2. Key Levels & Zones
✅ Resistance Zone (1.09563 - 1.1000):
This blue-shaded area represents a strong resistance level, where sellers have stepped in multiple times.
Price previously attempted to break this level but failed, forming a rejection.
This suggests buyers are losing strength, and sellers are likely to dominate.
✅ Support Level (1.0800 - 1.0780):
A critical support zone, which acted as a demand area in the past.
If price breaks below this level with strong bearish momentum, it confirms a trend reversal.
✅ Target Level (1.06870):
The next major downside target aligns with previous market structure and liquidity zones.
This area marks a key demand zone, where buyers might step in again.
3. Trade Setup & Execution Plan
🔹 Entry Strategy
A sell entry is ideal on a confirmed break and retest of the support zone at 1.0800.
If price retests this level and forms bearish rejection candles (such as pin bars or engulfing patterns), it strengthens the bearish bias.
🔹 Stop Loss & Risk Management
A stop loss should be placed above the resistance zone at 1.09563, ensuring a safe exit if the market reverses bullish.
Risk-to-Reward Ratio (RRR):
Entry: Below 1.0800 (after confirmation).
Stop Loss: Above 1.09563 (resistance zone).
Target: 1.06870 (support zone).
RRR: Around 1:3, meaning potential profit is three times the risk.
4. Confirmation Indicators & Confluences
✅ Bearish Trendline Break:
The ascending trendline has been broken, confirming a possible shift in trend.
✅ Support Flip:
If the price breaks support and retests it as resistance, it confirms bearish continuation.
✅ Price Action Candlestick Patterns:
Look for bearish engulfing candles, pin bars, or rejection wicks at key levels.
✅ Volume Analysis:
Increased selling pressure after support break indicates strong bearish momentum.
5. Final Thoughts & Bias
📉 Bias: Bearish (Unless resistance is reclaimed).
💡 Key Watch: Break and retest of 1.0800 support for confirmation.
⚠️ Risk Management: Always use a stop loss to manage risk effectively.
Conclusion
This setup presents a high-probability short trade with a clear entry, stop loss, and target. Traders should wait for confirmation signals before executing the trade. If price breaks above resistance, the bearish outlook is invalidated.
🔔 Stay cautious and trade with discipline! 🚀
CHF/USD Bearish Reversal: Trendline Break Strong Sell-Off!his CHF/USD (Swiss Franc/U.S. Dollar) 1-hour chart showcases a bearish trading setup, signaling a potential downside move after a failed breakout at a key resistance level. Below is a comprehensive breakdown of the chart, highlighting key technical elements, potential trade setups, and risk management considerations.
1. Identified Chart Pattern – Cup & Handle (Failed Breakout)
The chart initially formed a Cup and Handle pattern, a bullish continuation setup where:
The rounded bottom (cup) indicated accumulation and a gradual shift in trend from bearish to bullish.
The handle consolidation represented a minor pullback before a potential breakout.
However, the pattern failed to hold its bullish momentum. Instead of continuing higher, the price was rejected at the resistance level (ATH – All-Time High), signaling a shift in sentiment.
2. Key Technical Levels
Resistance Level + ATH (All-Time High)
The price reached a significant resistance zone (marked in blue), aligning with an all-time high (ATH) level.
Multiple rejections at this level indicate strong selling pressure, making it a potential distribution area where smart money is offloading positions.
Support Level + Reversal Zone
After rejection from the resistance, the price retraced to a critical support zone, previously acting as a demand area (buyers stepping in).
A break below this level confirms bearish momentum, increasing the likelihood of further downside movement.
Trendline Break – Bearish Confirmation
The trendline (marked in black) represents the primary uptrend support that guided price movement.
The break below this trendline signals a loss of bullish strength, increasing the probability of a trend reversal rather than a continuation.
3. Projected Price Movement – Bearish Scenario
Given the trendline break and rejection from resistance, the chart suggests a bearish wave with the following expectations:
A retest of the broken trendline and support zone before continuing downward.
Lower highs and lower lows formation – confirming a new downtrend.
A potential drop towards key downside targets (marked as TP1, TP2, and the final target).
Take Profit (TP) Targets:
✅ TP1 (1.1128): A minor support level where price may find temporary buying interest.
✅ TP2 (1.1111): A more significant support area that previously acted as demand.
✅ Final Target (1.1035): The ultimate downside objective, aligning with a major support zone and historical price action levels.
Stop-Loss Placement (SL):
📍 Above the broken trendline OR the recent swing high, ensuring protection against false breakouts or retracements.
4. Trade Execution & Risk Management
Entry Strategy (For Short Positions)
🔹 Aggressive Entry: Enter short immediately after the support zone break.
🔹 Conservative Entry: Wait for a retest of the support-turned-resistance area for confirmation before shorting.
Risk-Reward Ratio Consideration:
A properly placed stop-loss above resistance ensures a favorable risk-to-reward ratio.
Ideal ratio: 1:2 or better, meaning potential reward should be at least twice the risk.
5. Market Sentiment & Possible Alternative Scenario
While the primary outlook is bearish, traders must remain flexible and monitor price action closely:
If price reclaims the support zone and breaks above resistance, it invalidates the bearish setup, shifting momentum back to bullish.
A sustained close above the trendline could trap early sellers, leading to a short squeeze rally back toward resistance.
6. Final Thoughts
🔹 Bearish Bias: This setup favors downside movement due to trendline break, resistance rejection, and market structure shift.
🔹 Key Levels to Watch: Support zone retest, trendline confirmation, and target levels.
🔹 Risk Management is Essential: Using stop-loss protection and proper trade sizing to mitigate potential losses.
Conclusion: High-Probability Bearish Setup
🚀 The CHF/USD pair has shifted to a bearish structure after failing to break its ATH resistance. The breakdown of the trendline and key support level suggests a strong sell-off towards the 1.1035 target. Traders should look for short opportunities on pullbacks while managing risk effectively.
Would you like me to refine or simplify any part of this analysis for your TradingView post? 📉🔥

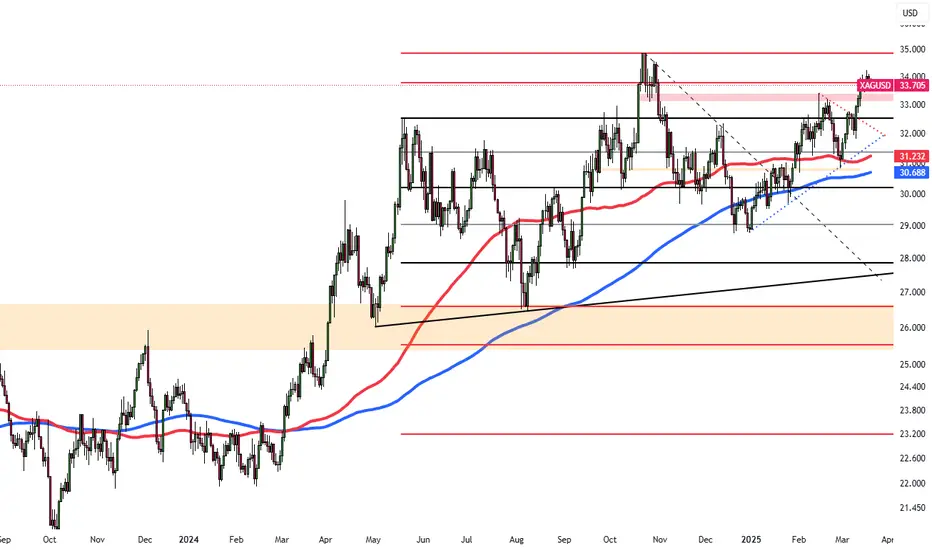
Silver Holds Near $33.60 as Fed Signals 2025 Rate CutsSilver hovered near $33.60 after the Fed held rates at 4.25%-4.5%, signaling 50 bps cuts by 2025. Despite trade-war fears and Trump’s policies, silver remains near a five-month high.
Lease rates surged as stockpiles shrank, especially in London, with silver flowing to the US for higher prices, widening market price gaps. Spot silver is up 17% this year, outperforming other commodities.
Tariffs strain silver transfers from Canada and Mexico, tightening supply and fueling fears of a prolonged “silver squeeze.”
If silver breaks above $34.05, the next resistance levels are $34.85 and $35.00. On the downside, support is at $33.80, with further levels at $33.15 and $32.75 if selling pressure increases.
Gold Holds Near Record $3,050Gold hovered near a record $3,050, supported by Fed rate cut expectations and safe-haven demand. The Fed reaffirmed plans for 50 bps cuts this year amid rising economic uncertainty, driving gold.
Middle East tensions escalated as Israel resumed ground operations in Gaza after an airstrike ended a two-month ceasefire. The US continued strikes on Houthi targets, with Trump warning Iran over future incidents.
Trade concerns persisted ahead of new tariffs in April, following the US’s 25% duty on steel and aluminum in February.
Key resistance stands at $3082, with further levels at $3100 and $3,150. Support is at $3000, followed by $2,980 and $2,916.

Sterling Stays Firm as Fed Highlights GrowthGBP/USD held near 1.3000 as sentiment stayed upbeat after the Fed reaffirmed 2025 rate cuts, though delayed. Markets still expect a 25 bps cut in June, with Powell highlighting strong US growth and a healthy labor market.
The Fed lowered its 2025 GDP forecast to 1.7% from 2.1% and acknowledged trade policy risks but sees inflationary effects as short-lived.
Focus now shifts to the BoE’s Thursday rate decision, with no changes expected. On Friday, the UK’s GfK Consumer Confidence is projected to fall to -21.0 from -20.0.
If GBP/USD breaks above 1.3050, the next resistance levels are 1.3100 and 1.3150. On the downside, support stands at 1.2860, with further levels at 1.2800 and 1.2715 if selling pressure increases.

ECB Rate Cut Hopes Fade, EUR/USD Nears 1.0900EUR/USD fell for a second day, nearing 1.0900 in the Asian session. The pair found support as the dollar weakened on falling Treasury yields after the Fed reaffirmed plans for two rate cuts. However, uncertainty over Trump’s tariff policies kept sentiment cautious.
In Europe, German lawmakers approved a debt plan by likely Chancellor Friedrich Merz to increase growth and defense spending. A shift from Germany’s conservative fiscal stance could drive inflation and influence ECB policy.
Investors await ECB President Lagarde’s speech on economic and monetary affairs in Brussels on Thursday.
Key resistance is at 1.0950, followed by 1.1000 and 1.1050. Support stands at 1.0880, with further levels at 1.0800 and 1.0730.

WILL GOLD FALL OR RISE IN FOMC SPEAKS ALERT!Hey Trader
there is market going to buy trend and powell speaks at in 2 hour left so if market break NEW ATH with good buy momentum before powell speaks so you see GOLD fall and target area for BEAR side
3000 and 2980
if the ATH break and close above m30 candel so you see gold mark new ATH at 3070
key level or reversal:
3046 for seller
3000 for buyers
follow risk mangement

Gold (XAU/USD) Chart AnalysisGold (XAU/USD) Chart Analysis
**Key Observations:**
1. **Current Price & Trend:**
- Gold is trading around **$3,033-$3,034**, showing a slight pullback after a strong rally.
- The trend remains **bullish**, supported by key moving averages.
2. **Support & Resistance Zones:**
- **Resistance Zone (Green):**
- **$3,040 - $3,044:** Minor resistance.
- **$3,048 - $3,052:** Strong resistance, potential breakout level.
- **Support Zone (Red):**
- **$3,030 - $3,028:** First support level (near EMA 50).
- **$3,024 - $3,020:** Stronger support (possible pullback area).
3. **Moving Averages (EMA):**
- **EMA 7 (3,034.06):** Short-term support.
- **EMA 21 (3,033.91):** Mid-term trend indicator.
- **EMA 50 (3,030.21):** Key dynamic support—holding above this level keeps the bullish trend intact.
4. **Trendline & Volume:**
- The **ascending trendline** suggests continued bullish momentum.
- **Volume is decreasing**, indicating consolidation before a potential breakout.
**Potential Trade Setups:**
🔹 **Bullish Scenario (Breakout Above $3,040):**
- Entry: Buy above **$3,040**
- Target: **$3,052+**
- Stop Loss: Below **$3,030**
🔹 **Bearish Scenario (Breakdown Below $3,030):**
- Entry: Sell below **$3,030**
- Target: **$3,020-$3,012**
- Stop Loss: Above **$3,040**
**Conclusion:**
- **Above $3,030 → Bullish bias remains strong.**
- **Below $3,030 → A pullback towards $3,020 is possible.**
- Watch for **breakout confirmation** before entering trades.
