BTC/USDT"I think the trend is upward, and this is a fake breakout. We'll likely return inside the channel and continue the upward movement. What's your opinion?"
Chartanalysis

SCRT/USDT – Testing support. Will the scenario repeat?Secret - is a privacy-focused blockchain built on Cosmos. Its smart contracts, called Secret Contracts, enable DApps to utilize private data on Secret, similar to how smart contracts function on other blockchains. However, Secret Contracts transmit encrypted data through encrypted channels without exposing it. This is made possible by encrypting the contract state during execution.
All the charts are cropped, so I found a more complete historical chart of the coin and overlaid it to the left.
This coin has dropped by approximately -98% since its distribution. To put it in perspective, if you had invested $1,000 , you would now have only $20 …
We observe a formation resembling an internal channel (120%) and an external channel (280%) . The price is once again being squeezed near support at the lowest price zones available on Binance (where the main liquidity is).
My previous trading idea played out successfully in three zones .
Profit from the time of publication to the squeeze: +270%.
The price is moving within a descending channel , but at the same time, the sideways range I previously anticipated is also forming. Here, it’s crucial to adapt to the situation.
Right now, the entire market is experiencing a pullback toward support levels .
I've marked potential final liquidity grab zones on the chart—consider these in your trading strategy.
Also, I want to highlight how negative the news sentiment is at the moment. No one believes in a rally. But that's exactly how it always looks in similar price reversal zones !)))

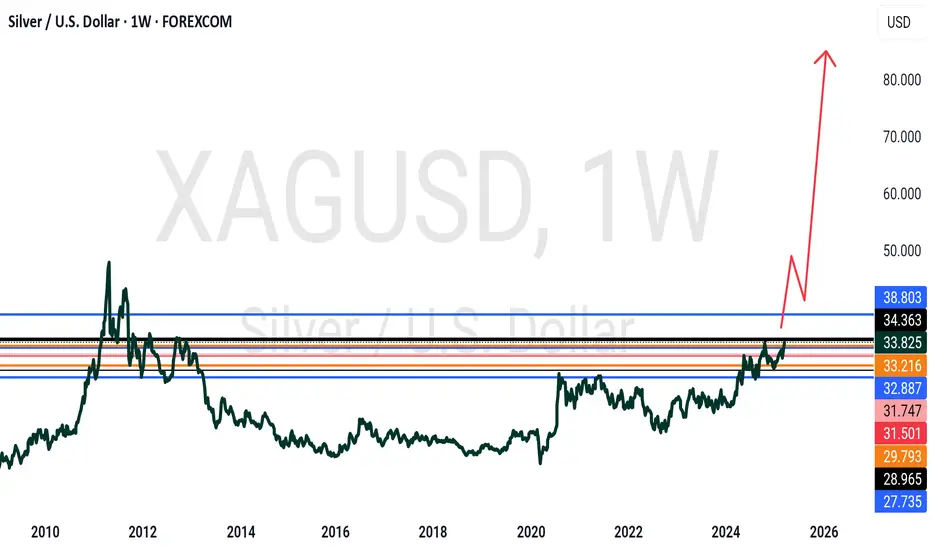
SILVER- very aggressive move expected, what's next??#SILVER... Market just broke his current resistance area, that was actually 32.40
So keep close it and if market hold 32.40 then it can leads you towards 3 digits.
Yes it can be 100 plus
Good luck
trade wisely
#WUSDT is setting up for a breakout📉 Long BYBIT:WUSDT.P from $0,08897
🛡 Stop loss $0,1985
1h Timeframe
⚡ Plan:
➡️ Waiting for consolidation near resistance and increased buying activity before the breakout.
➡️ Expecting an impulsive upward move as buy orders accumulate.
🎯 TP Targets:
💎 TP 1: $0,09275
💎 TP 2: $0,09465
💎 TP 3: $0,09566
🚀 BYBIT:WUSDT.P is setting up for a breakout—preparing for an upward move!

BTC/USDT Trade Setup & Analysis – Key Support Bounce & TargetsSupport: The lower purple zone indicates a strong support level where the price has bounced.
Resistance: The upper purple zone marks a resistance area where price has been rejected multiple times.
2. Moving Averages:
200 EMA (Blue): At 82,800.42, acting as dynamic resistance.
30 EMA (Red): At 82,090.72, indicating short-term trend direction.
3. Trade Setup:
A long position is planned from the current support level.
Entry: Around 80,026.98 (near support).
Stop Loss: Around 76,980.09 (below support).
Take Profit Targets:
TP1: 81,636.34
TP2: 82,800.42 (near 200 EMA)
TP3: 84,481.83
TP4: 86,260.26
Final Target: 88,297.36
4. Conclusion:
The setup expects a bounce from support with a target back towards resistance levels.
Breaking 82,800 (200 EMA) is crucial for further bullish momentum.
If the price falls below 80,000, the setup might get invalidated.
Would you like a deeper breakdown on any part? 🚀

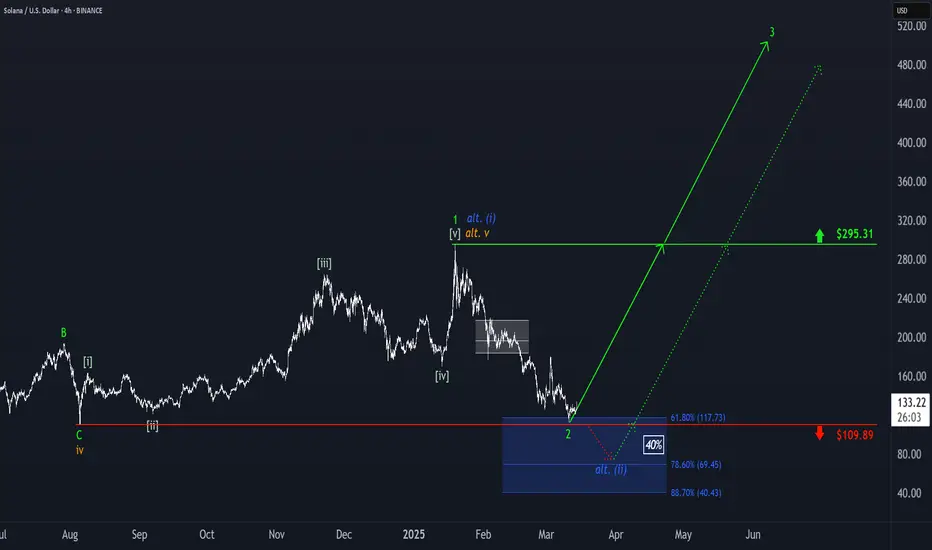
Solana: Precision Landing?!Solana extended its sell-off and reached our blue long Target Zone between $117.73 and $40.43. The price then reacted right at the $109.89 support level, indicating that the low of the green wave 2 has been settled. Thus, the next step should involve a strong rally driven by the green wave 3, ultimately pushing SOL well beyond the $295.31 resistance and past its current all-time high. However, our Target Zone remains active, as there is a 40% chance that the price could revisit this range to complete the blue alternative wave (ii) below the $109.89 mark.
GOLD ROAD MAP 3000 TO WATERFALL ALERT!🔥 Attention Traders! 🔥
XAUUSD is on fire! 🔥 Here's the latest update:
🔻 Bearish Outlook: Watch out for a potential drop if price falls below 2979. Targets: 2940 & 2960.
🔺 Bullish Outlook: A breakout above 2989 could lead to buying opportunities! Watch for targets: 3000 & 3020.
📈 Stay Tuned: Share your thoughts and strategies as we navigate this golden market! Let's hit new highs! 💰🚀

Gold Rallies Past $2,980 as Trade and Inflation Risks MountGold surged above $2,980 per ounce on Friday, hitting a record high and poised for a 2% weekly gain amid risk aversion and rising Fed rate cut expectations. Trump escalated trade tensions, threatening a 200% tariff on European wines after the EU imposed a 50% tax on U.S. whiskey. February's PPI and CPI data signaled easing inflation, increasing Fed flexibility for rate cuts and boosting gold’s appeal. Strong ETF inflows and continued central bank purchases, with China extending its buying for a fourth month, further supported prices.
Key resistance stands at $2,985, with further levels at $3000 and $3,050. Support is at $2,930, followed by $2,900 and $2,860.

Sterling Struggles Amid Risk Aversion and US Tariff ThreatsGBP/USD extends its decline for the second consecutive session, hovering around 1.2940 during Friday's Asian trading hours. The currency pair faces difficulties as the Pound Sterling (GBP) weakens due to a negative risk sentiment, which has been further worsened by worries over global trade following US President Donald Trump's threat to impose a 200% tariff on European wines and champagne, creating market instability.
If GBP/USD breaks above 1.2980, the next resistance levels are 1.3050 and 1.3100. On the downside, support stands at 1.2860, with further levels at 1.2760 and 1.2660 if selling pressure increases.

NEWS MOVE ALERT PPI AND UNEMPLOYEEMENT CLAIM.🚨 Gold Trading Update 🚨
Hey Traders! 👋
Here's the current scenario: Gold is heading towards the 2950-2955 level. Expect a possible fake-out, followed by a sharp drop. 📉
🔍 Key Insight: There’s an FVG on the H1 chart, signaling a potential sell-off before we see another GOLD rally. 🚀
Today’s News: PPI report 📊 drops, so expect a significant market move! Gold might respect the FVG and target these levels for a potential buy:
👉 2970
👉 2980
👉 3000
⚠️ Tip: Follow my strategy and always use proper risk management with a 1:2 risk-to-reward ratio. 💡
Happy Trading! 💰📈

GOLD - still looking bullish? what's next??#GOLD... market still looking bullish and now supporting area is around 2932 to 2935
keep close that supporting region and if market hold it in that case we can see further rise in gold prices.
good luck
trade wisely

Coca-Cola: As PlannedAs primarily anticipated, Coca-Cola has recently established the peak of wave in magenta just below the resistance at $73.53. The stock then dropped by approximately 5%. We now expect the low of wave in magenta to occur soon, and afterward, wave should bring significant gains, thus completing the large wave III in beige. Our Target Zone for this wave III top lies between $75.42 and $78.88. It provides opportunities to either close existing long positions or to open new short trades.

XAU/USD Chart"Do you think gold can give us a profit before it closes its weekly candle, reaching from the current price of 2958?"
"Do you think gold can give us a profit before it closes its weekly candle, reaching from the current price of 2958? And if you were in this trade, where would you set your take profit and stop loss?"

Lower US Inflation Drives Gold's SurgeGold surged to around $2,940 per ounce on Thursday, nearing record highs as escalating trade tensions boosted safe-haven demand. Trump threatened more tariffs on EU goods after retaliatory measures from the EU and Canada, while Commerce Secretary Lutnick confirmed planned trade protections on copper.
Meanwhile, US inflation data came in lower than expected, easing concerns and giving the Fed more room for a less restrictive policy. However, the long-term impact of tariffs remains uncertain, with inflation risks still looming.
Key resistance stands at $2,955, with further levels at $2,980 and $3,000. Support is at $2,860, followed by $2,830 and $2,790.

GBP/USD Climbs to 1.2960, Dollar Under PressureGBP/USD trades around 1.2960 in Thursday’s Asian session, extending gains for a third day as the US Dollar weakens with recession fears linked to Trump’s policies.
The dollar faces further pressure after February inflation slowed more than expected, raising speculation of an earlier Fed rate cut. Headline inflation fell from 0.5% to 0.2% monthly and from 3.0% to 2.8% yearly, while core inflation dropped to 0.2% monthly and 3.1% yearly. Markets now await US PPI and jobless claims data for further economic signals.
If GBP/USD breaks above 1.2980, the next resistance levels are 1.3050 and 1.3100. On the downside, support stands at 1.2860, with further levels at 1.2760 and 1.2660 if selling pressure increases.

Yen Supported by BOJ TighteningThe Japanese yen stabilized around 148 per dollar on Wednesday, recovering after two days of declines as a weaker US dollar offset trade conflict concerns. Trump vowed more tariffs after the EU and Canada retaliated against his steel and aluminum duties, escalating tensions.
The yen remained supported by expectations of further BOJ rate hikes, driven by strong wage growth and inflation. Japanese companies approved significant wage increases for the third year, boosting consumer spending and giving the BOJ more flexibility for future hikes.
Key resistance is at 149.20, with further levels at 152.00 and 154.90. Support stands at 147.00, followed by 145.80 and 143.00.

$ETSY hitting buy zonesLooking for a continuing downside on NASDAQ:ETSY to the $41-$42 area. Would look to add calls around there to a bounce of $45-$50.
WSL

VeChain: Struggling…VeChain is struggling to stay above the key support at $0.018, but the anticipated low of the orange corrective wave ii should form above this red line – or may have already done so. Once the bottom is indeed settled, we expect the orange wave iii to break out impulsively, pushing well beyond the $0.08 resistance, where the entire orange five-wave move should ultimately complete the blue wave (iii). However, if VET falls below $0.018, the broader green wave alt. will reach a new bear market low (probability: 38%). Primarily, we consider wave as already finished.

$BTC Price Showing Head and Shoulder Pattern On Chart, CPI DATACRYPTOCAP:BTC Price Showing Head and Shoulder Pattern On Chart, CPI DATA, $95K Soon as Possible?
Bitcoin high-entry buyers are driving sell pressure, price may ‘floor’ at $70K
Bitcoin's “top buyers” are selling heavily, with onchain analytics firm Glassnode calling it a “moderate capitulation event.”
Bitcoin buyers who purchased around when it hit a $109,000 all-time peak in January are now panic-selling as the cryptocurrency declines, says onchain analytics firm Glassnode, which isn’t ruling out that Bitcoin could slide to $70,000.
Glassnode said in a March 11 markets report that a recent sell-off by top buyers has driven “intense loss realization and a moderate capitulation event.”
Short-term holders fled as Bitcoin dropped from peak
The surge in buyers paying higher prices for Bitcoin
BTC $82,482 in recent months is reflected in the short-term holder realized price — the average purchase price for those holding Bitcoin for less than 155 days.
In October, the short-term realized price was $62,000. At the time of publication, it’s $91,362 — up about 47% in five months, according to Bitbo data.
Meanwhile, Bitcoin is trading at $81,930 at the time of publication, according to CoinMarketCap. This leaves the average short-term holder with an unrealized loss of roughly 10.6%.
Related: Bitcoin slides another 3% — Is BTC price headed for $69K next?
On the same day, BitMEX co-founder Arthur Hayes said that Bitcoin may retest the $78,000 price level and, if that fails, may head to $75,000 next.
Glassnode explained that a similar sell-off Bitcoin pattern was seen in August when Bitcoin fell from $68,000 to around $49,000 amid fears of a recession, poor employment data in the United States, and sluggish growth among leading tech stocks.
#BTC☀ #BinanceAlphaAlert #BinanceSquareFamily #Write2Earn #SUBROOFFICIAL
Disclaimer: This article is for informational purposes only and does not constitute financial advice. Always conduct your own research before making any investment decisions.

Fed Expectations Increase Silver PricesSilver surged to nearly $33 as the US Dollar fell sharply, with the DXY dropping to 103.35, its lowest in four months. Concerns over Trump’s tariff policies and their impact on the US economy fueled the dollar’s decline, supporting demand for silver.
Investors now await US CPI data for February, which could influence Fed rate expectations. A slower inflation rate may increase the likelihood of a May rate cut, with odds rising to 51% from 37% in a day, further supporting Silver’s appeal as a non-yielding asset.
If silver breaks above $32.75, the next resistance levels are $33.15 and $33.80. On the downside, support is at $31.00, with further levels at $30.20 and $29.75 if selling pressure increases.

Recession Fears Support Gold's StabilityGold held steady above $2,910 per ounce, maintaining a 1% gain. Investor sentiment shifted after Trump reversed his plan to double tariffs on Canadian steel and aluminum, just hours after the announcement. Ontario Premier Doug Ford also paused a 25% surcharge on US electricity exports.
Trade uncertainties and US recession fears continued to support gold, though geopolitical tensions eased as the US restored military aid to Ukraine following a 30-day ceasefire agreement with Russia. Markets now focus on upcoming US CPI data for clues on the Fed’s rate outlook.
Key resistance stands at $2,923, with further levels at $2,955 and $3,000. Support is at $2,860, followed by $2,830 and $2,790.

Dollar Weakness Supports GBP Near HighsThe British pound held around $1.29, near a four-month high, as dollar weakness persisted on US economic concerns and tariff risks. Sterling was supported by expectations that UK rates will stay higher for longer, with traders pricing in only 52bps of BoE cuts in 2025.
UK’s monthly GDP data for January and the Office for Budget Responsibility’s economic and borrowing forecasts on March 26 are now awaited, which could impact market sentiment.
If GBP/USD breaks above 1.2950, the next resistance levels are 1.2980 and 1.3050. On the downside, support stands at 1.2860, with further levels at 1.2760 and 1.2660 if selling pressure increases.

Eurozone Spending Plans Boost EuroThe euro surged past $1.09, its highest in four months, gaining 5% since early March. This rally was driven by Eurozone plans to expand deficit spending, stimulating growth prospects. Germany pushed for a €500 billion infrastructure fund, while France and Italy supported joint EU funding for economic and military initiatives.
The ECB signaled a shift toward a less restrictive policy after last week’s rate cut, suggesting the easing cycle may be nearing its end. Meanwhile, US economic concerns pressured the dollar, further lifting the euro.
Key resistance is at 1.0950, followed by 1.1000 and 1.1050. Support stands at 1.0800, with further levels at 1.0730 and 1.0650.
