BTC/USDT updateBefore the correction, we had already shared the most probable scenario for #BTC in Spot Club and, with a slight delay, in this channel. As expected, the price dropped around 11% in spot within wave C, leading to significant liquidity being absorbed in the market.
However, we had already warned tarde-ai.bot members about this potential move in advance.
We still consider our previous outlook as the most probable scenario for Bitcoin's next move. If our perspective changes, we will update the analysis accordingly.
Chartanalysis

Avalanche: Pending LowWith the recent sharp pullback, AVAX has entered the lower third of our magenta long Target Zone between $24.42 and $13.30. The low of the turquoise wave 2 is approaching and should form well above the $8.64 support. From the bottom of wave 2, we expect a rally in the turquoise impulse wave 3, which should aim for the current all-time highs of the last bull run.

Chartsssss"What impact do you think Bitcoin has on other coins? Why should Solana’s chart resemble Bitcoin's? Is our trend downward, heading for lower supports? God knows? My heart hurts, I see Bitcoin like this."

Brent Crude Struggles at $69 as Global Demand Risks MountBrent crude hovered around $69 per barrel on Tuesday as concerns grew that U.S. tariffs could slow economic growth and weaken oil demand. Tariffs imposed by President Trump on major suppliers like Canada and Mexico, along with China’s retaliatory measures, heightened fears of a global slowdown.
China’s deepening deflationary pressures further weighed on crude prices despite stimulus efforts. On the supply side, Russia’s Deputy PM Alexander Novak confirmed OPEC+ plans to boost production in April but noted the decision could be reassessed if market conditions shift.
Technically, the first support is at $68.1, with subsequent levels at $65 and $63.6. On the upside, the initial resistance is at $70.2, followed by $73.3 and $75.80.

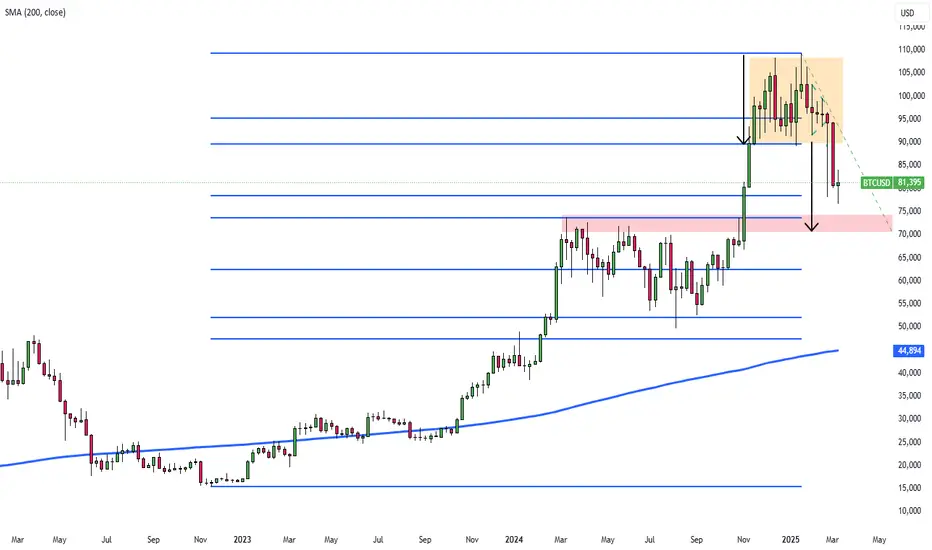
Bitcoin Drops 27% from Record High Amid Market SelloffBitcoin fell to $78,000 on Monday, down 27% from its all-time high, as crypto and stock markets lost a combined $6 trillion. Crypto market capitalization dropped 4% to $2.67 trillion, its lowest since November 9, shedding $1.2 trillion since December 17. Bitcoin hit a multi-month low, falling from its January peak of $107,000. Stocks mirrored the decline, with the S&P 500 losing $1.4 trillion—its worst single-day drop since 2022. The sharp selloff reflects a shift from risk assets, with the Fear and Greed Index plunging to 14, a two-year low, signaling extreme risk aversion. This contrasts with last year’s post-Trump election rally, where the index peaked at 92.
Technically, the first support for BTC is at $78k, with subsequent levels at FWB:73K and $65k. On the upside, the initial resistance is at GETTEX:89K , followed by $95k and $100k.
Trade Uncertainty and Fed Stance Keep Silver Prices ElevatedSilver held at $32.50 per ounce after a 4.4% weekly gain, as trade tensions and U.S. inflation data kept investors cautious. Uncertainty grew after Trump warned of new tariffs on Canadian dairy and lumber, following a U.S. delay on 25% tariffs for Canadian and Mexican goods. Canada upheld retaliatory measures, while China’s tariffs on U.S. agriculture took effect. Concerns deepened after Trump avoided recession and inflation questions in a Fox News interview. Fed Chair Powell signaled no rush for rate cuts despite rising economic risks.
If silver breaks above $32.75, the next resistance levels are $33.15 and $33.80. On the downside, support is at $31.00, with further levels at $30.20 and $29.75 if selling pressure increases.

Gold Strengthens on Trade Tensions and Safe-Haven DemandGold prices climbed toward $2,900 per ounce on Tuesday, supported by a weaker U.S. dollar and rising safe-haven demand amid economic uncertainty and escalating trade tensions. President Trump acknowledged recession risks after the U.S. delayed 25% tariffs on Canada and Mexico, while China imposed new tariffs on U.S. agricultural goods. Meanwhile, Fed Chair Jerome Powell cited economic concerns but ruled out immediate rate cuts. Investors are now awaiting U.S. inflation data for further guidance on the Fed’s policy outlook.
Key resistance stands at $2,923, with further levels at $2,955 and $3,000. Support is at $2,860, followed by $2,830 and $2,790.

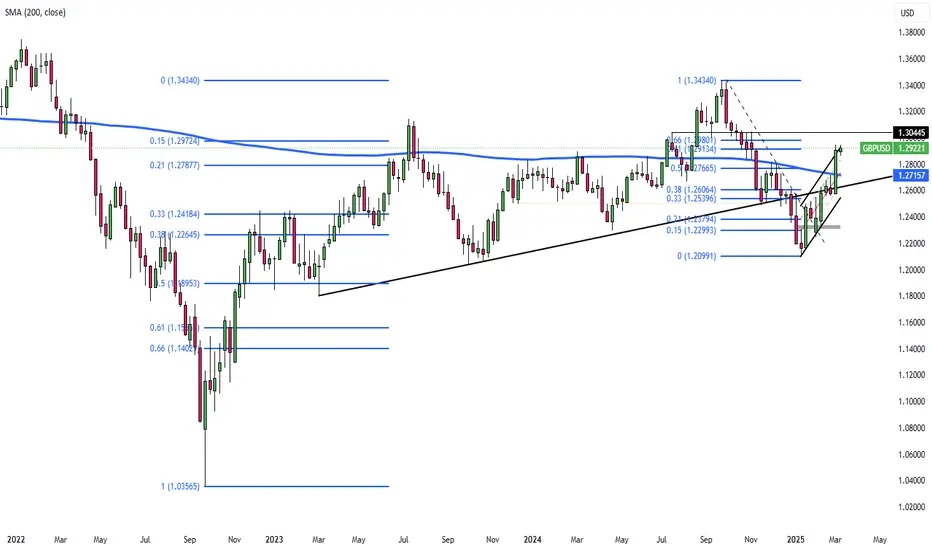
UK Budget Forecasts and GDP Data Set to Shape Pound’s Next MoveThe pound hovered around $1.29, staying near a four-month high as dollar weakness persisted amid U.S. economic concerns and tariff risks. Sterling remained supported by expectations that UK interest rates will stay high, with traders adjusting BoE rate cut forecasts to 52 bps for 2025. Investors now await January GDP data for economic insights, while the UK’s budget watchdog will release updated economic and borrowing forecasts on March 26, potentially influencing market sentiment.
If GBP/USD breaks above 1.2920, the next resistance levels are 1.2980 and 1.3050. On the downside, support stands at 1.2860, with further levels at 1.2760 and 1.2660 if selling pressure increases.
EUR/USD Flat Amid Market Uncertainty and Recession FearsThe EUR/USD pair remained stable on Tuesday, showing little movement as traders entered a data-heavy week in the U.S. markets. On Monday, global equities experienced a sharp sell-off, driven by rising recession fears, leading to broad market declines. However, EUR/USD traders are taking a cautious approach, awaiting key U.S. inflation data before committing to any major moves.
Key resistance is at 1.0850, followed by 1.0900 and 1.0950. Support stands at 1.0730, with further levels at 1.0700 and 1.0650.

Safe-Haven Yen Gains on Economic Risks, BOJ Policy UncertaintyThe yen rose to 147 per dollar, its strongest in five months, as US recession fears fueled safe-haven demand. Trump acknowledged economic risks, while Japan’s GDP growth was revised down to 2.2% from 2.8% due to weak consumption. The BOJ is expected to hold rates in March but may hike later this year. Finance Minister Kato warned of the real-world impact of FX volatility.
Key resistance is at 149.20, with further levels at 152.00 and 154.90. Support stands at 147.00, followed by 145.80 and 143.00.

BTCUSDT - single supporting area, holds or not??#BTCUSDT.. so now market just near to his current supporting area that is 85150 around
Market holding that level in day chart as you can see day graph.
Now again that is our supporting area and below that we can expect short.
Keep close.
Good luck
Trade wisely

Support Retest / PullbackSupport Retest / Pullback
- The price recently bounced from around **1.28970 (black EMA).
- If it holds above this level, the uptrend may continue.
- A break below **1.28950 might indicate further downside.
### **📌 Trading Strategy**
✔️ **Bullish Bias:** Buy if price breaks above **1.29200, targets **1.29400 - 1.29600.
✔️ **Bearish Confirmation:** Sell if price closes below **1.28950, targets **1.28600 - 1.28400.
✔️ **Use Risk Management:** Set stop-losses to minimize risk. 🚀

Netflix: New All-time High!As expected, Netflix reached a new all-time high at $1,067, completing the magenta wave . Since then, the stock has already pulled back by nearly 20%. The ongoing magenta wave should extend further into our new magenta Target Zone, which spans $789.04 to $704.43. Since we anticipate a sustainable rebound from this range, it presents an opportunity to initiate or expand long positions. Such long entries could be hedged with a stop 1% below the Zone’s lower boundary, as there is a 30% chance that Netflix will drop below the Zone to complete the green wave alt. .

$ELF on the shelf; reversal?Hello, with some selling pressure from the triple digits into a demand zone that dates back a year and change if not 2 plus, we can potentially see a reversal on $ELF. Looks like a finish of the Elliot Wave pattern as well. Targets are labeled. Will be on watch. GL.
WSL

$LMND lagger in fintech, upside potential, EMA SMA crossingNYSE:LMND I'm a fan of financials, NYSE:MA , NYSE:V , NYSE:DFS , NASDAQ:PYPL , NASDAQ:AFRM , etc, even look at $SEZL. I think this name is a laggard in the sector and actually provides a good idea of business, something oversaturated but a different approach and ideas. With momentum and volume this name can trigger great upside potential in the next 3-6 months. Earnings are there and I look the setup here inside the triangle/flag. Long.
Also the 200ema and 200sma are riding nicely and the 50ema and 50sma are crossing over one another.
WSL

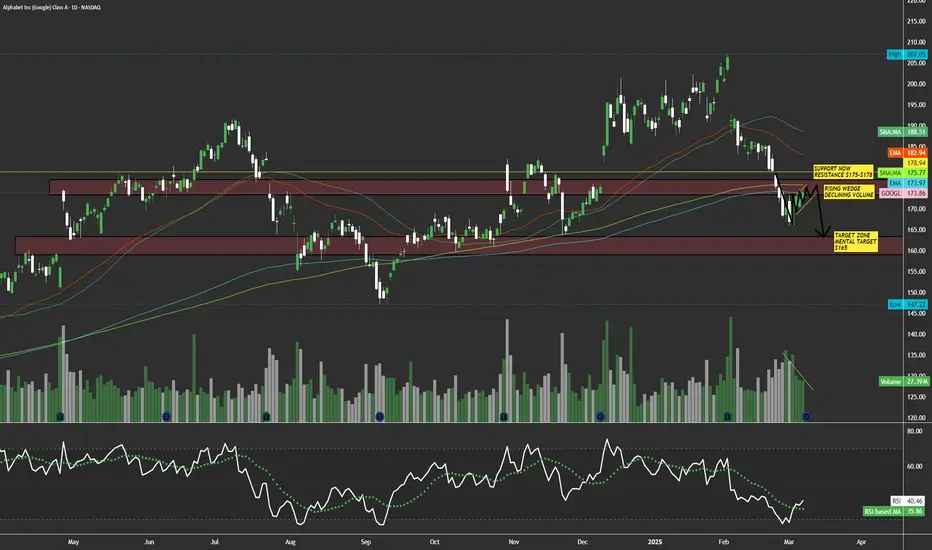
$GOOGL Rising bearish wedge with declining volume; $165 belowNASDAQ:GOOGL here looks weak to me trying to reclaim it's support of $175-$180. This is on my watchlist for a short term short, if this name tanks back into the $150's I will load everything I got for the long side. I see this name in a downside trend currently in a rising wedge with declining volume, buyers can't hold it up much longer. It's retested that support on 3 or more daily candles and hasn't busted through. I expect this name to drop into a support zone of $160-$165. I will look to enter puts off a retest of $176-$178 area keeping the stops tight.
WSL.
XAU/USD Daily Chart Analysis! Detailed ExplainationMarket Overview:
Gold (XAU/USD) is currently trading around $2,910, showing a slight decline of -0.05% on the daily timeframe. The market has been in a strong uptrend, breaking previous structures and forming higher highs and higher lows. However, the current price action suggests a potential pullback before another bullish continuation.
Key Technical Observations:
1. Resistance & Strong Resistance Zone ($2,950 - $3,000+)
The price has reached a strong resistance zone near the $3,000 psychological level, where selling pressure is evident.
A weak high has been marked, indicating that buyers may attempt to break this level, but sellers could push the price down before any significant breakout.
If price successfully closes above this resistance, it could trigger further bullish momentum towards $3,100 or higher.
2. Support and Demand Zone ($2,750 - $2,800)
The demand zone between $2,750 and $2,800 has historically acted as a strong support level.
This zone aligns with previous price accumulation and a key structural support level.
A pullback to this area could present buying opportunities, as institutional buyers may step in.
3. Market Structure and Breaks of Structure (BOS) & Change of Character (ChoCH)
Multiple Change of Character (ChoCH) points have been noted, signaling shifts in momentum.
The Break of Structure (BOS) suggests a continuation of the prevailing bullish trend, with minor corrections along the way.
The most recent ChoCH indicates a potential short-term bearish retracement before a continuation to the upside.
4. Strong Low and Potential Support Levels ($2,500 - $2,600)
The strong low is marked below $2,500, which acts as a long-term support zone.
If the demand zone at $2,750 - $2,800 fails, the next major support area lies around $2,600.
However, given the overall bullish trend, a drop to these levels would likely be short-lived unless macroeconomic factors shift significantly.
Potential Price Scenarios:
🔵 Bullish Scenario (Primary Outlook)
Price may retrace towards the $2,750 - $2,800 demand zone.
If buyers defend this level, we can expect a bullish reversal towards $2,950 - $3,000 resistance.
A strong breakout above $3,000 would likely trigger further upside momentum towards $3,100+.
🔴 Bearish Scenario (Alternative Outlook)
If sellers take control and push price below the $2,750 support, further downside could follow.
In this case, the next major support levels would be $2,600 - $2,650, where buyers may re-enter.
A breakdown below $2,500 would signal a shift in long-term market structure, invalidating the bullish trend.
Trading Plan & Strategy:
✅ For Long Entries:
Look for bullish price action (e.g., pin bars, bullish engulfing candles) in the $2,750 - $2,800 demand zone.
Target $2,950 - $3,000 as the first take-profit level.
If price breaks above $3,000, hold positions for a move towards $3,100 or higher.
❌ For Short Entries:
If price struggles to break above $3,000, short positions can be considered with stop losses above resistance.
Targets for short trades: $2,800 (first TP), $2,650 (second TP).
Final Thoughts About Trend:
Gold remains in a strong bullish trend, but a short-term retracement could be expected before the next rally. Traders should focus on key levels like $2,750 - $2,800 support and $3,000 resistance to confirm the next move. Watch for confirmation signals before entering trades. 📊🚀

BTC/USDT UpdateBitcoin is back to our $85-$86 support level.it is an importantlevel due to the 200 day Ema and trendline support.
another key level is the 200-day MA support,which also aligns with te SBR FOMO low $81.5k

Take-Two: Continued Sideways MovementSince the beginning of February, Take-Two Interactive has been moving mostly sideways with a slight downward bias. Currently, the ongoing beige wave b should continue upward, driving the stock into the beige Target Zone between $241.59 and $257.87. There, this corrective rally should conclude, setting the stage for a sharp downward move. However, if the stock breaks below the support at $135.62, this will signal a premature correction low of the blue wave alt.(II) in the blue Target Zone between $107.47 and $46. We assign this scenario a 33% probability.

GBP/JPY Bullish Channel (07.3.25)The GBP/JPY pair on the M30 timeframe presents a Potential Buying Opportunity due to a recent Formation of a Channel Pattern. This suggests a shift in momentum towards the upside and a higher likelihood of further advances in the coming hours.
Possible Long Trade:
Entry: Consider Entering A Long Position around Trendline Of The Pattern.
Target Levels:
1st Resistance – 192.46
2nd Resistance – 193.40
🎁 Please hit the like button and
🎁 Leave a comment to support for My Post !
Your likes and comments are incredibly motivating and will encourage me to share more analysis with you.
Best Regards, KABHI_TA_TRADING
Thank you.

Dollar Decline Propels Silver Above $32Silver extended its rally beyond $32 per ounce in early March, supported by a weaker U.S. dollar. The U.S. imposed new tariffs on Canadian, Mexican, and Chinese imports, prompting Canada’s 25% counter-tariffs and China’s additional levies of 10%-15%, along with export restrictions on select U.S. entities.
Investors now focus on Friday’s U.S. nonfarm payrolls report for clues on the Federal Reserve’s monetary policy outlook.
If silver breaks above $32.75, the next resistance levels are $33.15 and $33.80. On the downside, support is at $31.00, with further levels at $30.20 and $29.75 if selling pressure increases.

Policy Volatility Keeps Gold at $2,900Gold hovered around $2,900 per ounce, set for a weekly gain. While Trump temporarily paused 25% tariffs on most Canadian and Mexican goods, Canada’s retaliatory tariffs remain, and China’s countermeasures take effect next week.
U.S. labor data showed mixed signals as layoffs hit a 2020 high per the Challenger report, while jobless claims fell more than expected. Investors now await the non-farm payrolls report for further labor market insights and potential Fed policy impact.
Key resistance stands at $2,923, with further levels at $2,955 and $3,000. Support is at $2,860, followed by $2,830 and $2,790.

GBP/USD at 1.2880, Awaits NFP ReportGBP/USD holds modest gains around 1.2880 in Friday’s Asian session, recovering from the previous decline as investors await the US Nonfarm Payrolls (NFP) report. Meanwhile, the US Dollar Index (DXY) extends its five-day decline, pressured by falling Treasury yields, with the 2-year at 3.94% and the 10-year at 4.24%. Markets increasingly expect the Federal Reserve to adopt a more aggressive rate-cutting stance due to economic growth concerns.
Analysts at MUFG Bank suggest the Fed may shift focus from inflation control to economic growth, especially amid tariff uncertainties. Consumer confidence has weakened, reflecting rising household concerns.
In the UK, expectations for BoE rate cuts in 2025 have dropped below 50 basis points. BoE’s Catherine Mann stated that gradual rate changes are ineffective in volatile markets, advocating for larger cuts to provide clearer policy signals.
If GBP/USD breaks above 1.2920, the next resistance levels are 1.2980 and 1.3050. On the downside, support stands at 1.2860, with further levels at 1.2760 and 1.2660 if selling pressure increases.
