BRETT/USDT- Breaks out of 3 month of trendline.
-Yesterday listed on Coinbase Futures.
Entry: 0.043-0.039
Target:100%-200%
Chartanalysis

Precious Metals Gain as U.S. and China Exchange New TariffsSilver surged past $32.5 per ounce in early March, fueled by a weaker dollar and safe-haven demand amid escalating trade tensions. The U.S. imposed tariffs on Canada, Mexico, and an additional 10% on Chinese goods, raising China's total tariff to 20%. In response, Canada levied a 25% tariff on $155 billion of U.S. imports, while China announced 10%-15% tariffs on U.S. goods starting March 10 and new export restrictions. Traders now await Friday’s U.S. nonfarm payrolls report for Fed policy signals.
If Silver breaks above $32.75, the next resistance levels are $33.15 and $33.80. On the downside, support is at $31.00, with further levels at $30.20 and $29.75 if selling pressure increases.

Safe-Haven Demand Lifts Gold Amid US Tariff UncertaintyGold rose above $2,920 per ounce, nearing record highs, as a weaker dollar and trade uncertainty drove safe-haven demand. Trump granted US automakers a one-month exemption from 25% Canada-Mexico tariffs and hinted at more changes. A US official suggested lifting the 10% tariff on Canadian energy if trade conditions are met. Meanwhile, China filed a revised WTO complaint in response to new US tariffs. Investors await the non-farm payrolls report for Fed policy signals.
Key resistance stands at $2,923, with further levels at $2,955 and $3,000. Support is at $2,860, followed by $2,830 and $2,790.

Pound Surges on BoE Policy OutlookThe British pound climbed to 1.289, its highest since November 12, increased by a weaker dollar, US economic concerns, and tariff effects. Expectations of prolonged high UK rates also supported the pound. BoE Deputy Governor Ramsden warned of persistent wage-driven inflation but noted rate cuts could accelerate if needed. The pound appears less exposed to US tariffs after Trump hinted at a possible UK trade deal.
If GBP/USD breaks above 1.2920, the next resistance levels are 1.2980 and 1.3050. On the downside, support stands at 1.2860, with further levels at 1.2760 and 1.2660 if selling pressure increases.

ECB Rate Cut Expected as EU Unveils €800B Defense PlanThe euro neared $1.08, a four-month high, as increased defense spending and borrowing strengthened Eurozone optimism. Germany’s CDU/CSU and SPD agreed to exceed 1% of GDP in defense spending and create a €500 billion off-budget fund. EU plans to mobilize €800 billion for defense, with €150 billion in loans and more fiscal flexibility. The ECB is expected to cut rates for the fifth time this week.
Key resistance is at 1.0840, followed by 1.0900 and 1.0950. Support stands at 1.0760, with further levels at 1.0700 and 1.0650.

Yen Steady Near 149 as BOJ Hints at Possible Rate HikesThe yen held near 149 per dollar, its strongest in five months, benefiting from a weaker dollar amid a stronger euro and Trump’s tariffs. While Trump eased tariffs for some automakers, retaliatory measures pressured the dollar. BOJ Deputy Governor Uchida signaled potential rate hikes if economic forecasts hold, noting financial conditions remain loose with minimal JGB reductions.
Key resistance is at 152.00, with further levels at 154.90 and 156.00. Support stands at 148.60, followed by 147.10 and 145.80.

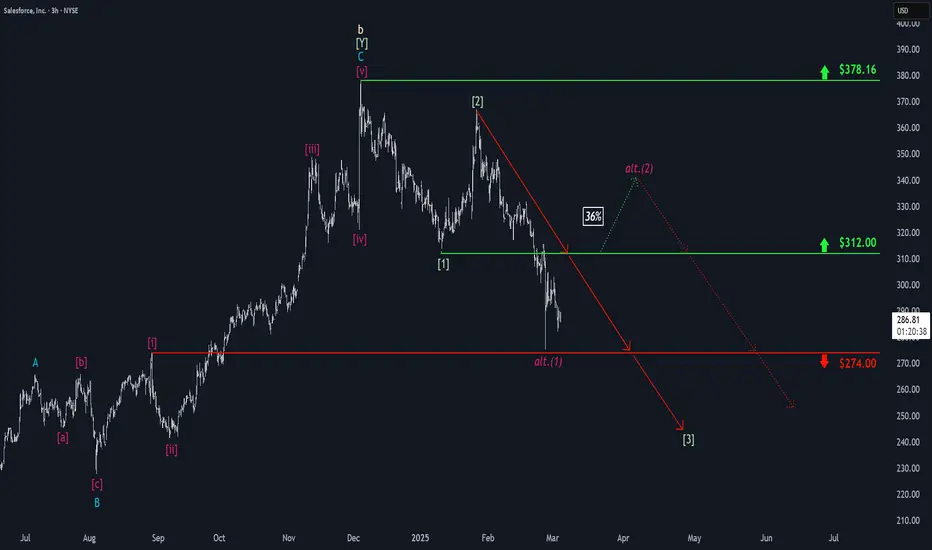
Salesforce: Further ProgressDue to continued downward pressure, Salesforce has made further progress in realizing our primary scenario. During the ongoing green wave , we still expect the stock to sell off below the support at $274. However, if the price imminently climbs above the resistance at $312, we will have to reconsider the structure of the ongoing decline and reckon with a magenta five-wave downward move. We currently assign this alternative scenario a 36% probability.
$PIUSDT Price Road to $11 Price Prediction 2025 Pi Network News: Can Pi Coin Price Hit $11? Key Levels Revealed, Pi Already Get place 11 of the Market.
Pi Network has gained 6.8% in the past 24 hours, outperforming major cryptocurrencies like Bitcoin (+7.5%), Ethereum (+8.9%), XRP (+11.1%), BNB (+9.8%), and Solana (+7.8%). But that’s not the real surprise.
Since its mainnet launch, PI's price has skyrocketed by an incredible 1,775.77%, while the overall crypto market has dropped by 11% in the same period. That’s a staggering contrast - and a sign that something big is happening.
With PI breaking key resistance levels and speculation about a major exchange listing growing, investors are wondering: How much higher can PI go? Could we see a breakout past $2? Let’s dive in.
💗 Why Is PI’s Price Rising?
Since February 20, PI has gained an incredible 1,775.75%, with a 7.5% jump in just the last 24 hours. This steady rise shows that Pi Network is moving independently of the broader market, maintaining strong momentum.
Key Reasons Behind PI’s Price Rally
Several factors are driving PI’s price increase:
Mainnet Migration Deadline Approaching
Pi Network is reaching its final deadline for users to migrate their holdings. According to a recent blog post from the team, March 17 is the last day to complete the migration. This deadline may be increasing buying pressure as investors prepare for the next phase.
🧡 Potential Binance Listing
Speculation around a Binance listing is another major factor. In a recent Binance community poll, over two-thirds of participants supported listing PI. If Binance or other major exchanges list it, the price could see a significant boost.
US Election Impact on Crypto
Donald Trump’s return to office is bringing a more crypto-friendly stance from the US government, which could benefit projects like Pi Network.
💝 Can PI Break $2.2?
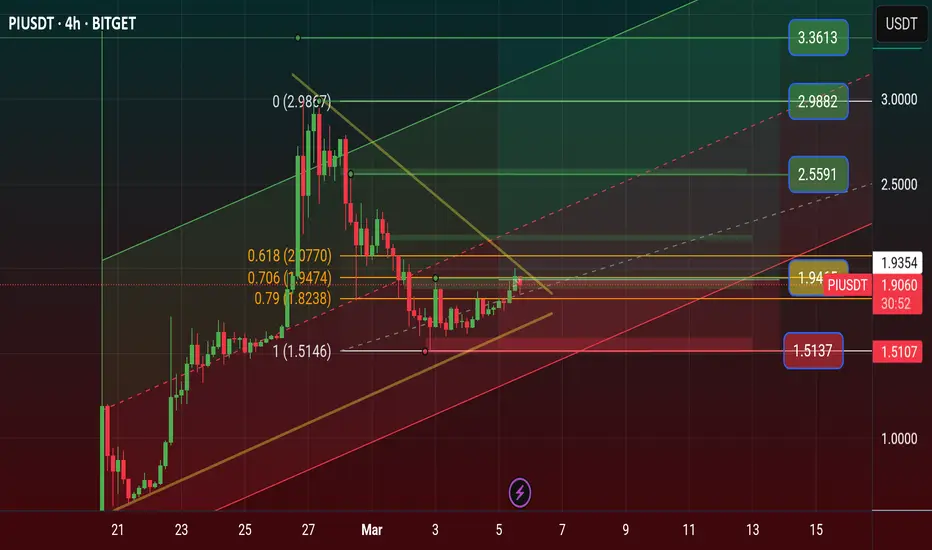
Experts believe that if PI moves past the $2.2 resistance level with strong volume, it could rally toward $11. However, if it fails to break through, selling pressure could push it down to $1.5 Stoploss price area
To maintain its bullish trend, PI needs to hold support above $1.7. The price is currently just 1.11% below the key $2.2 level, making the next few days crucial in determining its next move.
🩷 Never Miss a Beat in the Crypto World!
Stay ahead with breaking news, expert analysis, and real-time updates on the latest trends in Bitcoin, altcoins, DeFi, NFTs, and more.
Pi Network has defied market trends and harsh criticism before, and if history is any guide, this rally might just be getting started.
🩵 Why Is Pi Coin’s Price Rising?
Pi Coin’s price is rising due to increasing exchange interest, migration deadlines, and strong community support, pushing demand higher.
💜 Nano History Will Pi Coin Reach $11?
If Pi breaks the $2 resistance with strong volume, experts predict a rally toward $11. Failure could lead to a drop below $1.5
💛 Is Binance Listing Pi Coin?
Binance has not officially listed Pi yet, but a recent community poll shows strong support, increasing the chances of a future listing.
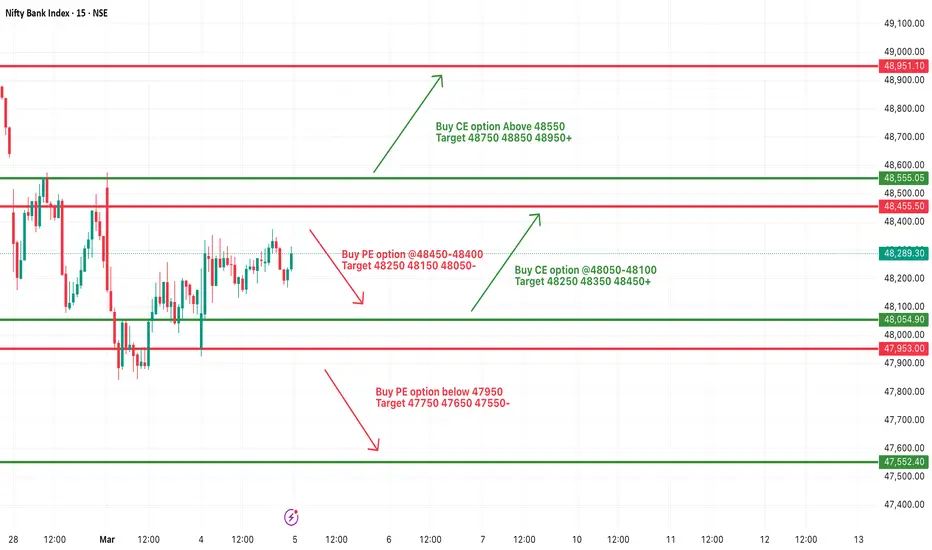
[INTRADAY] #BANKNIFTY PE & CE Levels(05/03/2025)Today will be flat opening expected in index. After opening it will trade in between the 400+ points range from 48050-48400 points. Any strong upside rally only expected above 48550 level. Downside 48050 level will act as a important support for today's session. Any major downside rally only expected below 47950 level.
Analysis of gold XAUUSD as i published before my price ranges
you can watch as i already mantioned the price range and market movementum so the market is going on that patterns so keep following and watch the next moves .
The rejection from EMA 200 suggests continued bearish pressure, with a downside target near 2,870 support. However, a strong bullish reaction from that level could lead to a potential reversal. Traders should wait for confirmation before entering a trade. 🚀

ExxonMobil: Final Pullback ExpectedExxonMobil should soon resolve the ongoing sideways phase, allowing the turquoise wave 2 to establish its corrective low below $104.84. This final pullback is still needed before the next impulsive rally unfolds. Alternatively, there is a 32% chance that the key low was already settled by the turquoise wave alt. 2. A break above $123.74 would confirm this scenario.

ETH CMEThere are three gaps on the ETH's CME chart:
-Gap 1 : $2250
-Gap 2 : $2600
-Gap 3 : $3200
The current ETH price is $2355, High possibility of filling all gaps,especially the $3200 gap in March.

GOLD - placed a reasonable low? What's next??#GOLD.. market just placed a very reasonable day low.
And if market hold that low then again rise expected.
Say sharp guys.. don't be lazy here.
Good luck
Trade wisely

3M: Higher High ExpectedAt the start of the year, MMM continued to rise higher before the rally temporarily transitioned into a consolidation phase. February brought slight downward pressure, but after a brief spike back to $141 last week, buying interest returned noticeably. This triggered a strong upswing, with the stock gaining nearly 10% in just a few trading days. As a result, we have identified an internal five-wave structure within the turquoise wave 5 and now primarily assume that the magenta wave is already unfolding. This wave should extend further upward, marking the completion of the broader magenta wave (1). Afterward, we anticipate a significant wave (2) correction, which could also begin earlier. In this 35% likely alternative scenario, the stock would experience a premature sell-off below the $131.40 support, with wave alt.(2) eventually reaching our magenta Target Zone between $106.04 and $86.20.

USDT.DIn the series of pinned posts, we've analyzed and predicted all the ups, downs, and waves of the index for you. (How perfectly the analysis played out! 😉)
Here’s the sharp drop in USDT dominance within W4, a 18% dump, leading to a market pump. Of course, many are linking it to Trump’s speech in support of crypto, but did we know in advance what he was going to say? No! We just read the charts, analyzed market conditions, and presented a single scenario, which once again proved to be spot on!
Once this current hype settles, we'll update you on the next moves of dominance. But of course, it all depends on your reactions and energy! ❤️

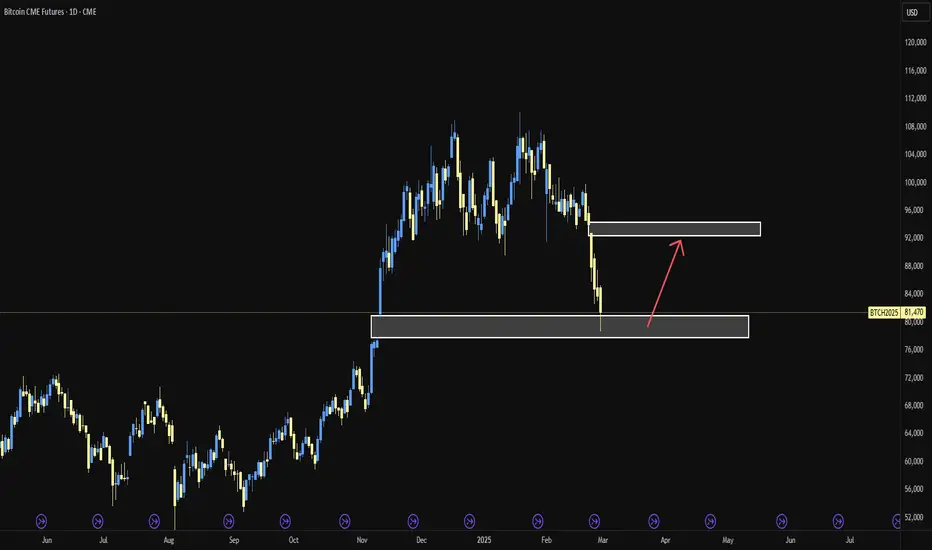
BTC CMEThe CME gap at 93k has been filled,but due to the announcement on sunday, wall street and CME bears got wrecked as TradFi was closed.

LTC/USDTDespte the market correction Ltc$ held up really well. with almost 100 days of cosolidation in this price range.
Entry:$130-$120
Target: $200-$300

Polkadot: Now It’s Crunch TimePolkadot has been unable to resist the widespread downturn in the altcoin sector, giving up much of its recent gains after a solid performance in recent days. Our grayed-out Target Zone for the low of the green wave is coming back into focus – though under our primary scenario, DOT shouldn’t fall much lower in the short term. If the coin drops below the $3.80 support, however, a new bear market low in our orange Target Zone between $2.40 and $1.07 will be on the horizon. In this 39% probable alternative scenario, the coin would erase all gains since the low in October 2023, implying a new bottom for the magenta wave alt. . In our primary scenario, we expect renewed buying pressure soon, which should allow the green wave to surpass the resistance at $5.38.

S&P500: Days of DecisionHovering near the 6,000 points mark, the S&P 500 enters the second half of the week at a critical juncture. The next few trading sessions will determine whether the index will push directly to new record highs or first undergo a more extended correction. In our primary scenario, the S&P should continue selling off to settle the turquoise wave 2’s low within the corresponding long Target Zone between 5,667 and 5,389 points. Only from there should the next turquoise impulse wave 3 take over, driving the index to new all-time highs beyond the resistance at 6,365 points. If the S&P immediately resumes its upward trajectory, it might break past 6,365 points without delay. In this 38% likely alternative scenario, the index would bypass the turquoise Target Zone and significantly extend the green impulse wave alt. . Primarily, we consider the green wave as already complete.

$CRM short setup part two. $280 target.Check out my recent post on $CRM. This name is down from it’s highs already 11% or so but 20% is correction territory so I can see this name hitting $280 area. $280-$285. Multi day put swing.
WSL

$MSFT $SNOW sympathy play, $390-$400 SupportNASDAQ:MSFT NYSE:SNOW — Microsoft is like a snail in this AI/ Tech race but I suppose that shows strength because no major drops and holding zones well. Bottoms after bottoms. I’m looking for short term calls here. As of today, ending week 2/28, I may try $405c. But can see this retest the $420s weeks to come.
WallStreetLoser

$COIN Spinning Stop Candle in Downtrend; ReversalWe have 7 days of straight beating, assault, slaughter and murder. Do I think this thing reverses 10 fold? No but do I expect a bounce into the mid 220’s? Yes. RSI is relatively low (sold) for its name, it fundamentally smashed earnings and the candle here that closed on the daily is known as a spinning stop with a green closure. Expect a volatile move soon - tomorrow or and into Friday. NASDAQ:MSTR held up well today. This is always a craps shoot, no matter the trade, no matter the look of the chart and all the indicators we use. It just creates an edge. Good luck. I’m going to look at calls here for a bounce.
Wall Street Loser.
