#GOLD - one n single support, hold or not??#GOLD.. perfectly retrace from our expected area 2880-85
And now market holding his current supporting area that is around 2863-64
Keep close it guys because that area is our current supporting area and only holding of that area can create again buying volume otherwise below that we will go for a cut n reverse on confirmation.
Stay sharp..
Good luck
Trade wisely
Chartanalysis

Cardano: Target Zone ReachedCardano entered our blue Target Zone between $0.73 and $0.49 during the recent sharp sell-off but quickly rebounded above its upper boundary. While it’s entirely feasible that the low of the blue wave (ii) has already been settled, another dip to finalize this intermediate correction remains possible. Once wave (ii) has indeed found its bottom, the blue impulse wave (iii) should take over and drive the price above the resistance at $1.32.

Silver Rallies on Trade War Concerns and Strong Industrial DemanSilver rose above $32 per ounce on Wednesday, a three-month high, as trade and economic uncertainties fueled safe-haven demand. A weaker US dollar also supported prices. The US delayed 25% tariffs on Mexico and Canada but enforced a 10% levy on Chinese imports, prompting Beijing to impose its own tariffs and consider sanctions on US firms. Meanwhile, the Silver Institute projected a fifth consecutive year of market deficits in 2025, driven by strong industrial demand and retail investment, offsetting weaker jewelry and silverware consumption.
Technically, the first resistance level will be 32.50 level. In case of this level’s breach, the next levels to watch would be 33.00 and 33.50. On the downside, 31.80 will be the first support level. 30.90 and 30.20 are the next levels to observe if the first support level is breached.

Gold Holds Near Record $2,860 as Rate Cut Expectations RiseGold held near $2,860 per ounce, a record high, as expectations of lower interest rates increased its safe-haven appeal. Weak US services data signaled a potential slowdown, leading investors to anticipate two Fed rate cuts this year. The ECB and BoC have already cut rates, and the RBI and BoE are expected to follow. Gold also gained support from geopolitical risks, including Trump’s remarks on Gaza and Iran, as well as concerns over the US-China trade war’s economic impact.
Technically, the first resistance level will be 2879 level. In case of this level’s breach, the next levels to watch would be 2917 and 2950. On the downside, 2830 will be the first support level. 2790 and 2760 are the next levels to monitor if the first support level is breached.

Pound Hits Three-Week High as Markets Await BoE CutThe British pound rose above $1.25, its highest since January 7, as the US dollar weakened and the focus shifted to the Bank of England’s Thursday decision. Policymakers are expected to cut rates by 25bps to 4.5%, reflecting slowing growth and easing services inflation. Market sentiment remained cautious over US tariffs, with concerns about a US-China trade conflict impacting global stability. Meanwhile, UK input price inflation hit an 18-month high in January, according to the latest PMI report.
The first resistance level for the pair will be 1.2500. In the event of this level's breach, the next levels to watch would be 1.2600 and 1.2650. On the downside 1.2340 will be the first support level. 1.2265 and 1.2100 are the next levels to monitor if the first support level is breached.

EUR/USD Rises as Dollar Weakens Amid Trade War ConcernsThe euro climbed above $1.04 as a weaker dollar and Trump’s tariffs fueled economic concerns. China retaliated with its own levies, escalating trade tensions. Meanwhile, Eurozone business activity rebounded after two months of decline. The ECB cut rates and hinted at more easing in March, with US tariffs potentially pressuring it to loosen policy further. Investors now expect the ECB’s deposit rate to fall to 1.87% by December.
From a technical perspective, the first resistance level is at 1.0400, with further resistance levels at 1.0460 and 1.0515 if the price breaks above. On the downside, the initial support is at 1.0350, followed by additional support levels at 1.0220 and 1.0180.

Yen Strengthens Past 152 as BOJ Signals Possible 2025 Rate HikeThe yen strengthened past 152 per dollar, an eight-week high after BOJ board member Naoki Tamura suggested raising rates to 1% in late 2025. Finance Minister Katsunobu Kato warned of rising inflation, while strong wage data reinforced expectations of continued BOJ tightening. Real wages rose for a second month in December, with nominal wage growth hitting a 30-year high due to winter bonuses. The BOJ, which raised rates in January, remains open to further hikes. A weaker US dollar and lower Treasury yields, driven by mixed US data and easing trade war fears, also supported the yen.
The key resistance level appears to be 153.85, with a break above it potentially targeting 154.90 and 156.00. On the downside, 151.90 is the first major support, followed by 151.25 and 149.20 if the price moves lower.

Meta: Breakout!META has successfully broken out of its previous consolidation, extending a powerful uptrend. This nearly “correction-free” rally has once again pushed the stock to new record highs, which aligns perfectly with our primary expectation of further gains during the larger green wave . However, given the extent of this advance, META remains vulnerable to pullbacks. Thus, we assign a 33% probability to an immediate transition into a wave alt. correction, which would be triggered by a drop below the $547.57 support.

Solana (SOL) Bearish Outlook on the Daily TimeframeSolana (SOL) is showing signs of weakness on the daily chart, indicating a potential bearish move in the coming days. Several technical factors suggest that a downtrend may be on the horizon:
🔹 Price Action: SOL has failed to break key resistance levels and is forming lower highs, signaling selling pressure.
🔹 Moving Averages: The price is trading below major moving averages (e.g., 50 & 200 EMA), reinforcing the bearish sentiment.
🔹 RSI & Momentum: The RSI is trending downward, suggesting weakening bullish momentum and a possible shift to oversold conditions.
🔹 Support Levels: If SOL breaks below the nearest support level, further declines toward the next key demand zone could be expected.
Traders should closely monitor price movements and key technical levels before making any trading decisions. A confirmed break below support may open the door for deeper corrections.
What’s your view on SOL’s price action? Share your thoughts in the comments!

GOLD 4H CHART ROUTE MAP AND TRADING PLAN FOR THE WEEK4H Trading Analysis
Hi Everyone,
Here’s our updated 4H chart analysis and key levels for the upcoming week.
Market Overview
As seen on the chart, after successfully reaching TP2, the candle body failed to close above this level, and the EMA5 also did not cross and lock above it. Currently, Gold is trading within three weighted levels, with a gap above 2,800 and a gap below 2,788.
What’s Next for GOLD?
The 4H candle was unable to close above TP2 (2,815), and EMA5 was rejected at this level. This indicates a potential short-term reversal.
📉 Key Levels
Support Zones: Strong support is expected at the FVG zone and Gold Turn Levels at 2,788, 2,762, 2,745, and 2,705 (Retracement Range).
Downside Risks
If EMA5 crosses and holds below 2,788, the next target is 2,762.
If EMA5 crosses and holds below 2,762, the downside extends to 2,745.
A further break below 2,762 could drive prices down to 2,705.
📈 Bullish Scenario
A bounce from support levels could trigger a retest of TP1 (2,788), with potential upside towards TP2 (2,815) and TP3 (2,841).
Trading Strategy
🔹 Short-Term Trades:
Utilize 1H and 4H timeframes to capitalize on pullbacks at Gold Turn Levels.
Target 30–40 pips per trade while focusing on shorter positions in this range-bound market.
🔹 Long-Term Outlook:
Our bullish bias remains intact, viewing pullbacks as buying opportunities.
Buying dips from key levels offers better risk management rather than chasing tops.
Final Thoughts
Trade with confidence and discipline—our precise analysis keeps you well-prepared to navigate market movements. Stay tuned for daily updates and multi-timeframe insights.
Best regards,
📉💰 The Quantum Trading Mastery

Google: Room to Head HigherFor the past two months, GOOGL has been stuck in a sluggish sideways phase, with even its latest breakout attempt quickly sold off. During the magenta wave , we still expect a new high, though a direct transition into the subsequent wave remains technically possible. In our 33% likely alternative scenario, we would have to reckon with a significantly delayed continuation of the overarching upward cycle. In this case, GOOGL would still be working through the (intermediate) correction of the green wave alt. , which would bottom below the support at $147.22.

XAUUSD → Will Retrace till 2802-2794 but after hitting 2835Hello Traders!
As gold has made its ATH 2830 which was also a trendline where gold respect that trend line and down now every thinking for retracement but gold will do a breakout till 2835 as gold done on previous trendline
gold can hit 2835 easily before drop to retracement level of 2794, so for now i am bullish till 2835 in that zone i will see a good entry for sell.
Support: 2802
Resistance:2830
Fib Golden Zone: 2794-2796
Liquidity Zone: 2794
Gold will continue its trend after retracement but we need a good entry for sell almost from 2835

XAUUSD → Expected to retrace to 2802-2794 after hitting 2835.Hello, Traders!
like gold has made its ATH 2830, which was also a trendline that gold respected, and down now every thinking for retracement, but gold will do a breakout till 2835 like gold did on the previous trendline.
Gold will easily reach 2835 before dropping to the retracement level of 2794, thus I am bullish until 2835, when I will find a decent entry point for selling.
Support: 2802.
Resistance: 2830 Fib. Golden Zone: 2794–2796
Liquidity Zone: 2794
Gold will continue its trend following the retracement, but we need a decent entry point to sell almost from 2835.

Ripple: Approaching Our Target ZoneWhat a strong sell-off for XRP! Since last Friday, Ripple has dropped nearly 45%, yet it still hasn’t reached our magenta Target Zone between $1.69 and $1. While XRP saw a strong rebound after the sudden plunge, the magenta wave (4) should still head for a lower low within our Target Zone in the short term. Only after this price range has been reached do we anticipate the following magenta wave (5) to strive for new record highs above the resistance at $3.39.

USD/JPY - BullishDouble bottom before trendline was broken. Now retesting trendline and a significant supportlevel at 155.00. Expecting price to move up.

BTC CMEThe CME Bitcoin chart is showing gaps that suggest Bitcoin will first make an upward move and then head towards $88,000. Of course, this is just my personal opinion.
What do you think, friends?

USDCHF Break and Retest of the Failed SwingHello All!
Been waiting patiently on the reversal with this pair. I liked the break and retest of the failed swing line, CHOCH on the 4HR, break of consolidation with a retest to that CHOCH area. With that, it was able to set up nicely giving an entry at 0.90900. My first target is around 0.91300, then possible 0.91500.

BTC/USDT CHART ANALYSIS#BTC after a big drop we experienced recently, we expect to have wave (5) of growth up to 70-80 thousand dollars which I can reach by 2023, where to reach this value BTC must first go above $45-50k and hold on to it, after this last cycle we may experience a big drop to take a path to $150-200k, but we will see how BTC will act in time.
CHART: 1W
LONG-MID TERM

BTCUSD price is getting ready to drop to 100,000 to 97,000BTCUSDT is encountering significant opposition. In order to create a defense conglomerate, the price is being forced as far away from the 105–107K range as feasible. However, the worldwide bullish position cannot yet be overshadowed by this resistance.
On H1-H4, a symmetrical triangle and a descending channel are developing into a contentious scenario. Additionally, everything is dependent on which market segment views which figure. Although a rebound may accompany the initial reaction to the triangle support, given the resistance, we can presume that the price will attempt to decline and that the triangle's rebound will not be significant.
The price is prevented from falling by the support at 101.600 if we examine the descending channel.
Yes, technically, 101.600's support is now what matters most. Whether or not this level will hold the price is the key question.
At its core, the issue is controversial because it primarily hinges on America and how Trump and other politicians would employ rhetoric around cryptocurrency. It might be empty rhetoric, a bubble, or a sham to win an election. Or it might be a real tactic.
Resistance levels: 103453, 105765
Support levels: 100150, 98890
Focus on 101.6. I anticipate a short-term price consolidation and fall below the level, followed by a decline to 100–97K BUT! A false breakdown of 101.6 could result in a brief upward bounce before a further down to 100K because the chart shows a symmetrical triangle.
Analysis By: NexusTradesZone

ALONUSDT Technical Analysis (4H Chart)The price is currently in a descending triangle pattern, consolidating near the lower range. A strong breakout above the trendline could signal a bullish move with minimal risk.
📌 Entry Strategy:
Enter after a confirmed breakout above the descending trendline with volume.
Keep a tight stop-loss below the breakout candle to minimize risk.
First target: The previous resistance level (around 0.025 USDT).
💡 Risk-Reward Ratio: Favorable setup, as risk is limited while the potential reward extends to the upper channel resistance.
📊 Wait for confirmation before entering. If price closes above resistance with strong bullish momentum, it could lead to a high-probability trade. 🚀

US100 Decoding with the new way of analysisUS100 Decoding with the new way of analysis, please do follow and subscribe for more videos. please do comment and let me know your feedback. and help me with the suggestions so I will improve the video quality and quantity.

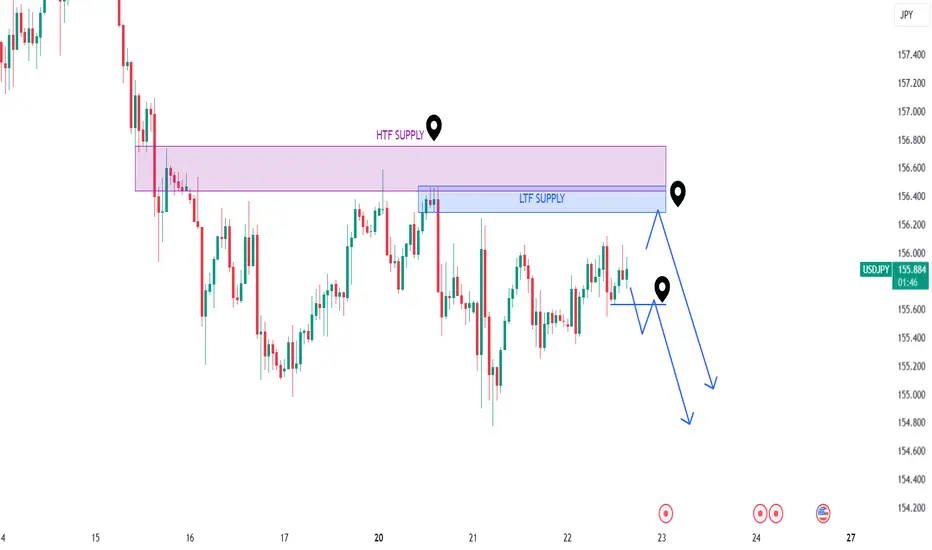
USDJPY Shorts Based on Current Re-DistributionBy combining Wyckoff and SMC principles we have a clear guide on what to expect, and what to do when it happens.
Patience is the name of the game, so set your alerts and hang tight until then.
- Option 2 could turn into a short term swing trade (until we reach daily demand levels)
$XAUTUST Chart Analysis of Price Prediction 2025 see more chartBITFINEX:XAUTUST Chart Analysis of Price Prediction 2025 see more chart...
Gold price flat lines above $2,760 level as traders keenly await FOMC decision Gold Price Forecast: XAU/USD nears $2,750 as Fed’s decision looms
From a technical perspective, the recent breakout through the $2,720-2,725 horizontal barrier and positive oscillators on the daily chart suggest that the path of least resistance for the Gold price remains to the upside. A subsequent move above the $2,772-2,773 area will reaffirm the constructive outlook and lift the XAU/USD beyond the $2,786 area, or the highest level since October 2024 touched last Friday, towards the all-time peak, near the $2,790 zone. Some follow-through buying, leading to a strength beyond the $2,800 mark, will be seen as a fresh trigger for bullish traders and pave the way for an extension of a well-established uptrend witnessed over the past month or so.
XAU/USD Current price: $2,753.60
The Federal Reserve will likely keep rates on hold in today’s monetary policy meeting.
The United States will publish the preliminary estimate of the Q4 GDP on Thursday.
XAU/USD could extend its slide in the near term amid prevalent US Dollar demand.
Gold is under modest selling pressure on Wednesday as caution rules ahead of the Federal Reserve’s (Fed) monetary policy announcement. The United States (US) central bank is widely anticipated to keep the benchmark interest rate unchanged after trimming 25 basis points (bps) and settling it at 4.25%-4.5% in December.
Support levels: 2,747.20 2,734.60 2,716.50
Resistance levels: 2,764.85 2,777.30 2,789.95
Disclaimer: This article is for informational purposes only and does not constitute financial advice. Always conduct your own research before making any investment decisions.
