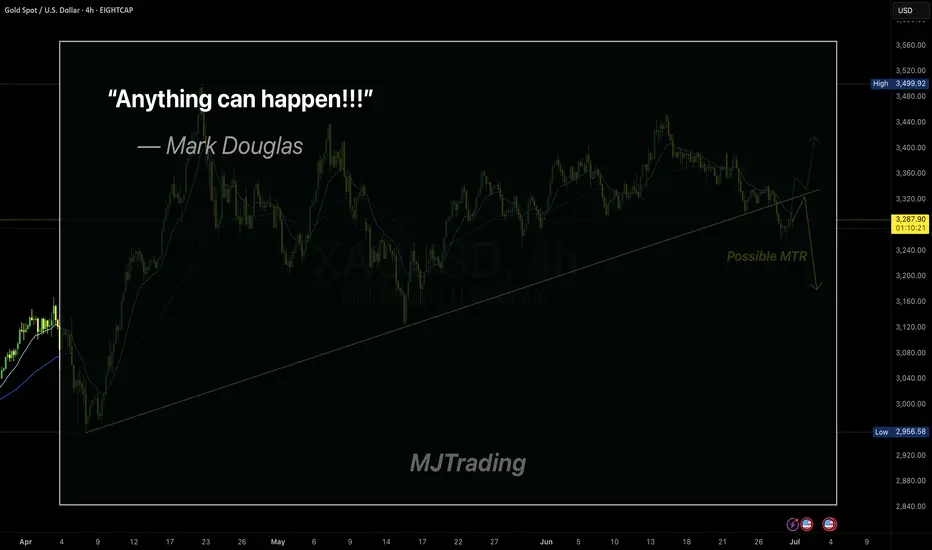
Embracing Uncertainty
In trading, the illusion of certainty is often our biggest enemy.
Even the cleanest setups—like a MTR (Major Trend Reversal)—can fail.
Mark Douglas said it best:
“Anything can happen.”
This simple truth is what keeps professional traders humble and disciplined.
Respect the market, manage your risk, and never assume you know what comes next.
Stay sharp.
#MJTrading
#GoldTrading #XAUUSD #TradingPsychology #AnythingCanHappen #MarkDouglas #ForexMindset #TradingQuotes #PriceAction #RiskManagement #MindOverMarkets #ChartOfTheDay #MJTrading
Chartanalysis
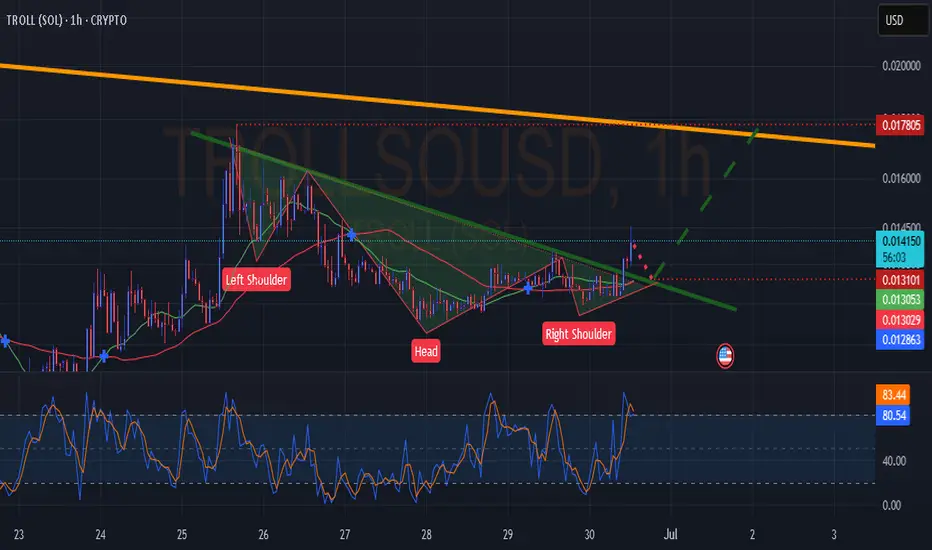
TROLL(SOL) IH&SGood day everyone. IH&S On troll. Touch back to the trend_line & take off to the upper red dotted line. Not financial advice.
ALUMINIUM Futures at Best Support !!This is the 1 hour chart of Aluminium futures.
Aluminium is moving in well defined ascending parallel channel with Support at 245 level .
If this level is sustain , then we may see higher prices in the Aluminium Futures.
Thank you !!

+266% in ONE DAY from $1.30 to $4.75 $RCT🔥 +266% in ONE DAY from $1.30 to $4.76 🚀
Spotted the setup early, but my official safety criteria checklist wasn't all green due to price action until later when it was too late NASDAQ:RCT
Sometimes discipline keeps you out early on even when the move goes wild

RAIN INDUSTRIES ' s Key Support Zone This is the one hour chart of RAIN INDUSTRIES.
Rain Industries is moving within an ascending parallel channel with support around 140 range and resistance around 160 range.
If this level is sustain , then we may see higher prices in the
Rain Industries
Thank You !!

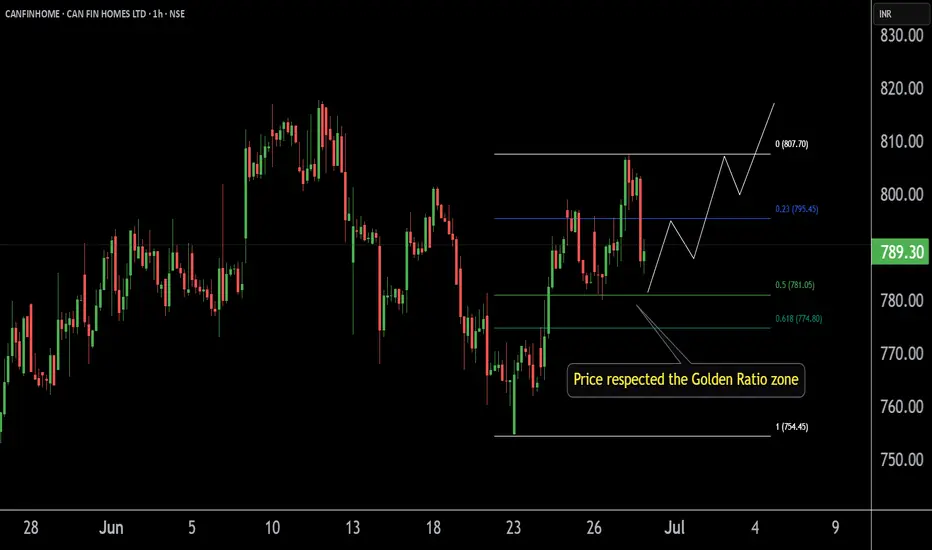
CANFINHOME'S Key ZoneThis is the 1 hour chart of CANFINHOME.
Canfinhome is taking support at the Fibonacci Golden Ratio zone.
If this zone is sustain then we may higher price in CANFINHOME .
Thank You !!
HNST: When honesty turns into a breakout formationOn the weekly chart, The Honest Company (HNST) is shaping a textbook broadening formation. Four waves are already in place, and the fifth is unfolding. The recent bounce came exactly after a retest of the long-term trendline at point (4), pushing the price above the critical $4.97 resistance (0.236 Fibo) — a clear signal that buyers are reclaiming control.
Volume is steadily rising, and the golden cross (MA50 crossing above MA200) further confirms a mid-term trend shift. The volume profile above current prices is nearly empty — indicating minimal resistance. Immediate targets are $6.33 and $6.94 (0.5 and 0.618 Fibo), while the full breakout projection lands at $8.91, $10.31, and even $12.09 (based on 1.0, 1.272, and 1.618 expansions).
Fundamentals (as of June 28, 2025):
— Market Cap: ~$460M
— Revenue (TTM): ~$344M
— YoY Revenue Growth: +7.6%
— EPS: –0.18 (loss narrowing)
— Cash on hand: ~$24M
— Debt: under $10M
— P/S ratio: 1.34
Despite being unprofitable, HNST is showing strong signs of operational improvement — rising gross margins, controlled costs, and increasing leverage. Growth in both online and retail sales adds further support. With institutional buying picking up, the market may be slowly re-rating this small-cap FMCG player.
Trade Plan:
— Entry: by market
— Targets: $6.33 → $8.91 → up to $12.09
When even an "honest" stock starts drawing broadening patterns and volume’s rising — it’s not a hint, it’s a launch sequence. And the bears? Might want to take a seat in the back.

S&P500: Target Zone DeactivatedThe S&P 500 extended its bullish trend yesterday, moving beyond our now-deactivated (formerly magenta) Target Zone. Existing positions remain intact, as the stop set 1% above the upper boundary has not been triggered. In our updated primary scenario, we anticipate continued upward movement within magenta wave (B), potentially reaching the resistance at 6675 points. Once this peak is established, we expect a corrective decline to begin in the form of wave (C), which should guide the index into the green Long Target Zone between 4988 and 4763 points. There, the larger green wave is expected to complete. A sustained breakout above the 6675-point level would shift the outlook in favor of the alternative scenario. In that case, green wave alt. would be considered complete—a trajectory we currently assign a probability of 40%.
📈 Over 190 precise analyses, clear entry points, and defined Target Zones - that's what we do.

PayPal: Bears Losing Control – AgainPayPal (PYPL) has faced renewed downside pressure since our last update, but the bears failed to maintain control for long. The stock quickly rebounded toward key resistance at $78.86. If this level is decisively breached, we will consider the broader correction complete with the alternative low of beige wave alt.II. This would position the stock in the early stages of a new bullish impulse – wave alt.1 – with a 45% probability assigned to this scenario. However, under our primary scenario, we still envision wave II reaching its regular low below support at $50.18. Thus, renewed selling pressure is expected to push the price beneath that level in the near term. Once the low is in place, we reckon with a new impulsive advance.
📈 Over 190 precise analyses, clear entry points, and defined Target Zones - that's what we do.

EURCAD: The Buy Might Be Hidden in the GapEURCAD just cleared out some liquidity at the highs and is now pulling back into an interesting zone. The bullish structure is still intact, and price has left behind a clean fair value gap right above the previous day’s low.
This zone is where I’m watching closely.
If price taps into that FVG and gives a strong reaction, we could see another leg to the upside. But no need to jump in blindly. Let the 15-minute timeframe show a change of character first.
If that shift happens, I’ll be looking for entries back toward the highs.
Let price come to you. Let structure guide you.

Nasdaq: At the Upper EdgeYesterday, the Nasdaq climbed above resistance at 22,475 points. Currently, the index is positioned outside our turquoise Target Zone (coordinates: 21,751 – 22,425 points), which remains active. Stops for short positions 1% above the zone have not yet been triggered. Our primary scenario remains intact for now: technically, there is room for wave B to reach the next resistance at 23,229 points. Following the B-wave peak, a downtrend is expected with the corrective wave C. With a 42% probability, we anticipate that wave alt.(4) is already complete, and the index may break directly higher within the magenta-colored wave alt.(5), surpassing the 23,229-point mark.
📈 Over 190 precise analyses, clear entry points, and defined Target Zones - that's what we do.

Timeframes in Trading: Which Chart Tells You WhatHello, traders! 👋🏻 Why can the same chart tell a different story on 1D, 4H, or 15M? You’ve probably been there. BTC looks bullish on the daily… bearish on the 4-hour… and totally sideways on the 15-minute. So, which one is right?
The truth is: none of them is wrong. They’re just telling different parts of the story. Understanding timeframes in trading isn’t just a technical skill. It’s how you decode what the market is actually doing.
Every Timeframe Has a Role
Think of timeframes like zooming in and out on a map: The 1W chart tells you where the mountain ranges are, the macro trend. The 1D chart shows the highways and the current direction within that macro. The 4H chart reveals city streets, the local trend swings. And the 15M chart? That’s the back alleys, where the noise and micro moves live. BTC, for example, doesn't behave the same way across these views, and it shouldn't.
What Happens If You Ignore Timeframes?
You try to short a "breakdown" on the 15M, only to realize you just sold into 4H support.
You enter a 1D bullish breakout, only to panic when price pulls back aggressively on the 4H… forgetting that the 4H was just doing a retest. Or worse, you start trading against the macro trend, thinking the 15M chart holds more weight than it actually does.
How Professionals Read Timeframes (BTC Example)
Example:
You can start high, work down: 1W → 1D → 4H → 1H/15M. Check the macro first. Is BTC bullish, bearish, or ranging on the 1D or 1W? Then, you can map key levels: Support/resistance from higher timeframes is 10x more meaningful on lower timeframes. For example, BTC’s $30K, a weekly level, creates reactions even down on 5-minute charts. And, align context: A bullish setup on 15M is excellent, but check if it aligns with the 4H trend direction. If the 4H is also bullish, your setup has context. If not, expect chop.
🔗 BTC Right Now: Timeframe Confusion in Action
Just look at the current BTC structure. On the 1W, BTC is still trending higher, higher highs and higher lows from the $15K bottom in 2023. On the 1D, BTC trades inside a broad consolidation range after a strong uptrend. The price has repeatedly tested the $107K–$112K zone, acting as a key resistance cluster, while forming a series of higher lows. It's not a breakdown but a correction inside a bullish structure, testing previous supply zones. The 4H? Chaos. The price bounces between $105K and $112K, which is pure range behavior. The 15M? Traders are getting whipped trying to catch fake breakouts that mean nothing in the daily or weekly context.
Which Chart Tells You What?
All of them. But differently.
THE 1W TELLS YOU THE NARRATIVE.
THE 1D SHOWS YOU THE CURRENT DIRECTION.
THE 4H REVEALS TRADEABLE SWINGS WITHIN THAT DIRECTION.
THE 15M CAPTURES THE NOISE, THE TRAPS, AND THE MICRO OPPORTUNITIES.
If you’re only looking at one timeframe, you’re only seeing part of the picture. So, timeframes aren’t about right or wrong. They’re about perspective. If you’re a day trader, you probably live on the 5-minute to 15-minute charts, while still peeking at the 1H or 4H for structure.
If you’re a swing trader, the 4H and 1D are your home base, with the weekly chart guiding the bigger story. And if you’re thinking in months or quarters, the 1W and 1M are what actually matter – everything else is just noise.
So next time BTC feels “confusing”… zoom out. Or zoom in. The answer is probably hiding in the chart, just not the one you were looking at. Which timeframe do you trust the most when trading crypto? Drop it in the comments!

Decentraland: Bottom Confirmed!Decentraland (MANA) has delivered a convincing upward reaction within our orange Target Zone ($0.28 – $0.22), confirming the low of orange wave ii. Under the primary scenario, the token is now advancing in wave iii of the same degree. This leg should propel MANA toward resistance at $0.85, with the full five-wave orange sequence expected to surpass that level before completing blue wave (i). That said, we still assign a 33% probability to the alternative scenario, which would imply one final corrective dip below support at $0.19.
📈 Over 190 precise analyses, clear entry points, and defined Target Zones - that's what we do.

What's Next For Bitcoin?Bitcoin Eyes A New ATH In the Upcoming Days...
But Do Not Be Surprised If BTC Drops Back To 90K.
Studying Previous Cycles, Showed Massive Drop Before the Bull Run.
#bitcoin #crypto #btc #trading #trader #portfolio #technicalanalysis

EURUSD Sell SetupBy: MJTrading:
EUR/USD has rallied into a significant resistance zone, approaching the upper boundary of a rising wedge/channel pattern. The price is now hovering around a key confluence zone, where trendline resistance and horizontal supply intersect ( 1.16300 —1.16500 )
There are to possible scenarios:
1) If the price Rejects directly from previous High
🔹 Position 1: Sell Stop @ 1.15915
🛑 Stop Loss: 1.6375
🎯 Take Profit: 1.5454
R/R:1
isk Level: Medium
2) If price tries to reach the boundary of the wedge or make a Fake breakout:
🔹🔹 Position 2: Sell Limit @ 1.16300
🛑 Stop Loss: 1.6930
🎯 Take Profit: 1.5000
R/R:2
Risk Level: Low
📌 This zone offers a high-probability reversal setup
📉 Why it Matters:
Price action shows signs of exhaustion after a parabolic move.
EMA structure is stretched, hinting at a potential pullback.
Lets ZOOM OUT:
Daily Chart:
ZOOM IN:
Stay disciplined, let price come to you, and manage risk.
—
#EURUSD #ForexSetup #TradingStrategy #TechnicalAnalysis #ChartPattern #FXTrading #ShortTrade #MJTrading #BearishReversal #PriceAction #SwingTrade #ForexIdeas #Trendlines #BreakoutOrFakeout #RiskReward

Ordi / Usdt BINANCE:ORDIUSDT
**Key Levels**
- **Resistance:** 7.855 (recent high) → 8.500 (next barrier)
- **Support:** 7.090 (today's low) → 6.241 (critical floor)
**Current Action**
- Trading at **7.118** (-1.96%) after testing **7.281** high
- Rejected from **7.281**, now near **7.090 support**
**What to Watch**
- **Bullish Case:** Hold above **7.090**, retest **7.855**
- **Bearish Risk:** Break below **7.090** → Drop to **6.241**
**Trade Setup**
- **Longs:** Only if holds 7.090 + volume (target 7.855)
- **Shorts:** If breaks 7.090 (target 6.500-6.241)
**Volume Alert**
- Weak bids → Risk of deeper correction
*(Not financial advice!)* 🔍

₿itcoin: Grinding higherBitcoin has extended its recent rally, reclaiming the $106,000 level in the last few hours. While short-term setbacks remain possible, our primary scenario continues to point higher: prices should aim for the upper blue Target Zone between $117,553 and $130,891. Within this zone, BTC should complete green wave B before initiating a corrective decline in wave C, which should extend into the lower blue Target Zone between $62,395 and $51,323. At the low of major wave a, a temporary recovery in wave b is likely, preceding the final downward push that should mark the end of the broader wave (ii) correction. Our alternative scenario (30% probability) suggests that Bitcoin remains within blue wave alt.(i). If true, a breakout beyond the upper blue Target Zone could occur.
📈 Over 190 precise analyses, clear entry points, and defined Target Zones - that's what we do.

IBM: Still BullishAfter the increases over the recent weeks, we still place IBM within the magenta wave (3) and expect a bit more bullish headroom in the short term. However, in our medium-term alternative scenario, we would see a larger pullback with the green wave alt. . Such a detour is considered 30% likely and would be confirmed by a drop below the support at $260.48.
📈 Over 190 precise analyses, clear entry points, and defined Target Zones - that's what we do.

Silver Outperforms Gold, Eyes $36Silver climbed back toward $36, bouncing from over two-week lows on falling Treasury yields and a softer dollar. While the Israel-Iran ceasefire remains shaky, Fed Chair Powell said “many paths are possible,” hinting at a flexible rate stance depending on job market data.
Strong industrial demand and tight supply continue to support silver, which is up nearly 9% in June, far outpacing gold’s modest gains.
Resistance is seen at 37.50, while support holds at 35.40.

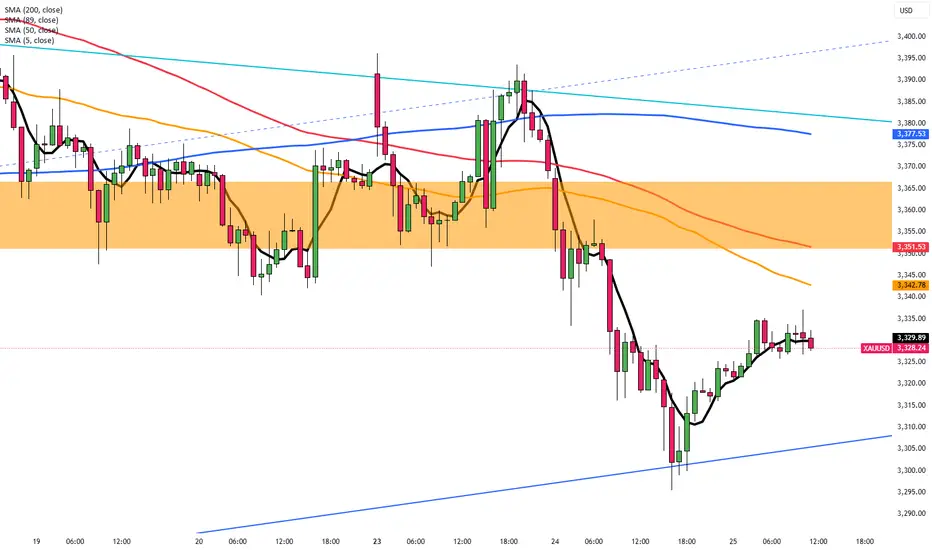
Gold Rebounds on Ceasefire FragilityGold edged back up to around $3,330, recovering from a two-week low. While the Israel-Iran ceasefire brought temporary calm, a US intelligence report showed that Iran’s nuclear progress was only briefly disrupted, raising concerns about renewed tensions.
Fed Chair Powell adopted a cautious stance, saying rates would likely stay unchanged for now, though a July cut remains possible. Diverging views among Fed members on inflation and job data may limit gold’s upside in the near term.
Resistance is seen at $3,355, while support holds at $3,285.
EUR/USD Nears 1.1620 Before Powell’s TestimonyEUR/USD edged up to 1.1615 in early European trading on Wednesday, supported by improved risk sentiment after Israel and Iran signaled an end to their air conflict. The truce, backed by pressure from President Trump, increased appetite for risk assets, favoring the euro over the dollar.
All eyes are now on Fed Chair Jerome Powell, who reiterated on Tuesday that monetary policy will remain data-driven. However, comments from Kansas City Fed President Schmid hinted at caution due to tariff-driven inflation. While markets expect a rate cut in September, July odds have edged slightly higher.
Resistance is at 1.1630, while support is at 1.1530.

Risk Sentiment Improves, GBP/USD Nears 1.3650GBP/USD extended its rally for a third session, trading around 1.3620 and holding close to Tuesday’s high of 1.3648, its strongest level since February 2022. The pair continues to benefit from improved risk appetite as Middle East tensions ease following Trump’s announcement of a ceasefire between Iran and Israel.
Despite the initial increase, investors remain cautious as doubts persist over the ceasefire’s durability and potential nuclear negotiations with Iran. Focus is also on Iran’s enriched uranium stockpile, which continues to raise geopolitical concerns.
Meanwhile, Powell, in his congressional testimony, signaled that rate cuts are unlikely before Q4. He acknowledged that new tariffs could push inflation higher from June but maintained that the Fed is prepared to ease policy once conditions allow.
Resistance is seen at 1.3655, while support holds at 1.3540.

Ceasefire Supports Yen’s StrengthThe Japanese Yen stayed strong near a one-week high around 145.5 on Wednesday, supported by risk-off sentiment and dovish commentary from the Bank of Japan. Several BOJ members favored steady rates with concerns over U.S. tariffs and their impact on Japan’s economy.
May’s Services PPI remained above 3% yearly, strengthening speculation that the BOJ could still raise rates later this year. Meanwhile, lingering geopolitical uncertainty and expectations of Fed rate cuts continued to pressure the US Dollar.
The key resistance is at $146.20, and the major support is at $144.85.
