ETH: Hardly Any Volatility Not much has happened for Ethereum since yesterday. According to our primary scenario, wave B in turquoise should imminently push higher, theoretically up to resistance at $4,107. Once these corrective rises conclude, wave C should take over, driving ETH down to complete the large green wave in the Target Zone below ($935.82 – $494.15). The low of this multi-year correction should lay the foundation for subsequent wave increases, likely causing new record highs above the $10,000 mark, as the weekly chart suggests. In our alternative scenario, ETH would embark on this bullish journey earlier. Currently at 27% probability, this alternative assumes the corrective low was already established at $1,385, which would imply a direct breakout above $4,107.
📈 Over 190 precise analyses, clear entry points, and defined Target Zones - that's what we do.
Chartanalysis

Another Banger $2.82 to $13.10 with 364% total move $APVOCatching just a piece of this kind of move pays a lot when moves are 300%+
Sitting at +72% realized gain over the past 3 days since the week started, from just 5 trades!
More to come this market is awesome
NASDAQ:APVO

₿itcoin: Holding steadySince our last update, Bitcoin has traded in a relatively stable range. As expected, there's still a strong case for the crypto leader to climb into the upper blue Target Zone between $117,553 and $130,891. However, a deeper pullback below the $100,000 mark remains a real possibility before that move unfolds. Regardless of the path it takes, we continue to expect Bitcoin to reach this upper zone, completing green wave B. From there, a corrective wave C—also in green—is likely to follow, driving the price down toward the lower blue Target Zone between $62,395 and $51,323. This move would mark the end of the broader orange wave a. For now, we’re watching for a potential b-wave recovery before the final leg lower toward the bottom of blue wave (ii) takes shape. That said, there's still a 30% chance that blue wave (i) isn’t done yet and could extend significantly above $130,891 before any meaningful correction begins.
📈 Over 190 precise analyses, clear entry points, and defined Target Zones - that's what we do.

Gold Climbs as Israel-Iran Conflict DeepensGold rose toward $3,380 on Thursday, recovering earlier losses as safe-haven demand grew amid the escalating Israel-Iran conflict, now in its seventh day. Reports say Israel hit over 20 sites near Tehran, including nuclear and missile facilities, while the U.S. may join the strikes, raising fears of a broader war.
Meanwhile, the Fed held rates steady Wednesday but signaled two possible cuts this year, despite high inflation and slowing growth. The move followed renewed pressure from President Trump for deeper cuts.
Resistance is seen at $3,370, while support holds at $3,316

EUR/USD Slips as Fed Stays HawkishEUR/USD fell toward 1.1465 in Thursday’s Asian session, pressured by a risk-off mood as Middle East tensions rise. The focus shifts to speeches from ECB officials Lagarde, Nagel, and de Guindos for further guidance.
On Wednesday, the Fed held rates at 4.25%–4.50% and signaled a slower pace of cuts, citing inflation risks from Trump’s new tariffs. The FOMC still projects two cuts in 2025
Bloomberg reported the US may strike Iran in the coming days, raising safe-haven demand for the dollar and adding pressure on the euro. ECB’s Lagarde said rate cuts are nearly done and that the ECB is well-positioned to manage current uncertainties.
Resistance is located at 1.1475, while support is seen at 1.1415

Amazon: Continuing to RiseWith Amazon’s recent climb, prices are edging closer to the top of wave (1) in magenta. However, there is still a bit of upside potential in the short term before wave (2) makes its corrective move. Our primary scenario does not anticipate a new low below $160.50. Instead, we expect wave (3) in magenta to eventually surpass resistance at $242.52. Under our alternative scenario, there is a 30% chance we could see new lows below $160.50. In this case, wave alt.B in beige would have peaked at $242.52, prompting us to focus on a magenta downward impulse.
📈 Over 190 precise analyses, clear entry points, and defined Target Zones - that's what we do.

₿itcoin: SetbackBitcoin has come under selling pressure in recent hours. We cannot rule out that a deeper dip may precede the next leg higher into the upper blue Target Zone between $117,553 and $130,891. Once green wave B concludes in this range, we anticipate a wave C decline into the lower blue Target Zone between $62,395 and $51,323 to complete the larger orange wave a. From there, a corrective rally in orange wave b is expected, which should set the stage for a final leg lower to finalize blue wave (ii). Meanwhile, we’re still monitoring the alternative scenario (30% probability), in which blue wave alt.(i) is still in progress. In this case, BTC would stage an immediate breakout above resistance at $130,891.
📈 Over 190 precise analyses, clear entry points, and defined Target Zones - that's what we do.

Gold | 4h Structural LookoutPEPPERSTONE:XAUUSD
📅 June 18, 2025
Chart Title: “Gold's Battle at the Midpoint – Compression Before Explosion”
Bias: Neutral-to-Bullish
Structure: Ranging with Bullish Channel
✳️ Technical Summary:
Gold continues to coil near the upper half of its multi-month structure, testing traders’ patience before a potentially explosive move. Current PA is forming a tight consolidation right beneath mid-channel resistance, suggesting a directional breakout is imminent — especially with the FOMC catalyst ahead.
📏 Key Chart Features:
Clear Rising Channel: Acting as medium-term trend guide
Major Consolidation: Identified around 3,330–3,380
Historical Boxes & Reaction Lows: Multiple orange circles show clear buying interest zones
Possible Long-Term Range: Defined between 3,123 and ATH zone (3,500)
EMA Support: Price currently holding both 15 & 60 EMAs
📈 Scenarios to Watch:
🔼 Bullish Breakout Path:
Trigger: Break and close above 3,400
Confirmation: Follow-through above consolidation +full body close
TP1: 3,460
TP2: ATH retest around 3,500–3,540
SL: Below 3,320 or lower trendline
Invalidation: Break below channel
🔽 Bearish Breakdown Path:
Trigger: Breakdown below 3,325 support
First Target: 3,250
Expansion Target: 3,123 – base of the macro range
Extreme Bear Target: 3,000 zone
SL: Above 3,400
Consolidation Zoom in:
#Xauusd #Gold #Trading #MJtrading #forex #Chart #chartanalysis #signal #freesignal

CHF/JPY Approaching the Danger Zone🧠 CHF/JPY Daily Chart
🗓️ June 18, 2025
Theme: "Approaching the Danger Zone – Will It Break or Bounce?"
Bias: Cautiously Bearish (near resistance)
Setup: Rising wedge into multi-year resistance zone
🔍 Market Structure Analysis:
The CHF/JPY has been riding a clean bullish wave since early 2025, but the pair now faces its most critical battle zone — the 179.50–180.00 multi-year resistance block, which previously marked a sharp reversal point.
The recent price action shows a rising wedge structure, which is often a bearish reversal pattern, especially when appearing near significant resistance.
🧬 Confluences in Play:
✅ Rising Wedge: Tightening structure indicates exhaustion of bullish momentum.
✅ Major Supply Zone: Price is approaching a high-likelihood reaction zone (180.00), where sellers aggressively took over in the past.
✅ Bearish Divergence Watch: (Not shown but likely developing on RSI or MACD)
✅ EMA Clustering: 15 & 60 EMAs rising, suggesting short-term momentum, but also acting as dynamic support if price breaks lower.
🔁 Scenario-Based Trade Plan:
🟥 Bearish Rejection Setup:
Entry: If price prints a strong bearish engulfing or pin bar near 179.50–180.00
SL: Above 180.20 (liquidity sweep buffer)
TP1: 174.50 (wedge base)
TP2: 172.00 (previous structure support)
TP3: 165.00 (macro demand zone)
R:R Potential: 3–5+
🟩 Breakout Continuation (Contingency Plan):
Buy Stop above 180.50 on strong close + retest
Targeting 184.00+ (measured move from wedge height)
🎯 Key Levels:
Major Resistance: 179.50–180.00
Trendline Support: 174.00
High-Volume Node: 172.00
Major Demand: 165.00–166.00 (long-term)
⚠️ Risks & Considerations:
JPY volatility due to BoJ surprises
CHF is sensitive to risk sentiment → geopolitical/macro shifts can rapidly flip bias
Wedge can fakeout before true move — confirm with volume + daily close
🧵 Summary Thought:
"Price is climbing a narrowing staircase into a wall. Will it punch through or trip on fatigue? Either way — the move from here is likely to be decisive. This is not the time to blink."
Share your Idea please...
#CHFJPY #MJTrading #Chart #Analysis #CHF #JPY

$6 to $27 in minutes after market open $CERONASDAQ:CERO went $6 to $27. All I did was just take safest piece of the move, bought right before halt and sold into easy gap up blowout after halt 🎯

Uber: Upward Momentum ExpectedUber attempted to counter recent sell-offs with an upward move; however, downward pressure quickly resumed. We must still consider a 35% chance that the turquoise wave alt.3 has already concluded, which would imply direct declines below support at $77.57 during wave alt.4 . In this scenario, long entry opportunities could emerge within our alternative turquoise Target Zone between $65.94 and $57.24. Primarily, the regular wave 3 should reach its peak well above the $94.10 mark, and wave 4 would start later.
📈 Over 190 precise analyses, clear entry points, and defined Target Zones - that's what we do.

₿itcoin: Directly or with a Detour?!Under our primary scenario, Bitcoin remains on track to climb into the upper blue Target Zone between $117,553 and $130,891 during green wave B. The key question at this stage: will the crypto giant head straight for the zone – or take a detour below the $100,000 level first? Either path remains structurally consistent with the broader outlook. Once wave B concludes, we expect a pullback to unfold in wave C, with the low of that move – and the bottom of orange wave a – anticipated in the lower blue Target Zone between $62,395 and $51,323. From there, orange wave b should initiate a corrective rally, likely rebounding toward the $100,000 mark. This would set the stage for the final leg down in blue wave (ii). Meanwhile, our alternative scenario remains intact on the 8-hour chart. This 30% likely scenario suggests Bitcoin is still advancing within blue wave alt.(i) , rather than correcting in wave (ii). A confirmed breakout above $130,891 would validate this outcome.
📈 Over 190 precise analyses, clear entry points, and defined Target Zones - that's what we do.

Brent OilGiven the conflicts in the Middle East, I think oil could reach $90. I hope that doesn't happen. What do you think? This is my analysis of oil. I think the upward trend will continue.

BTC/USDTHello friends, I hope you are doing well. This analysis came to my mind for Bitcoin. On the 4-hour time frame, if Bitcoin crosses the areas I specified, it will move towards its targets. It could be bullish because gold and oil were bearish yesterday. What do you think, friend?

MUTHOOT FINANCE at Best Resistance !! This is the Daily Chart of MUTHOOT FINANCE .
MUTHOOTFIN is currently trading near its resistance range around the 2700 range.
MUTHOOTFIN has completed its upward move as per its natural price behavior, with the rise reaching up to the 2700 range.
If This level is sustain , then we may see lower prices in MUTHOOTFIN.
Thank You !!

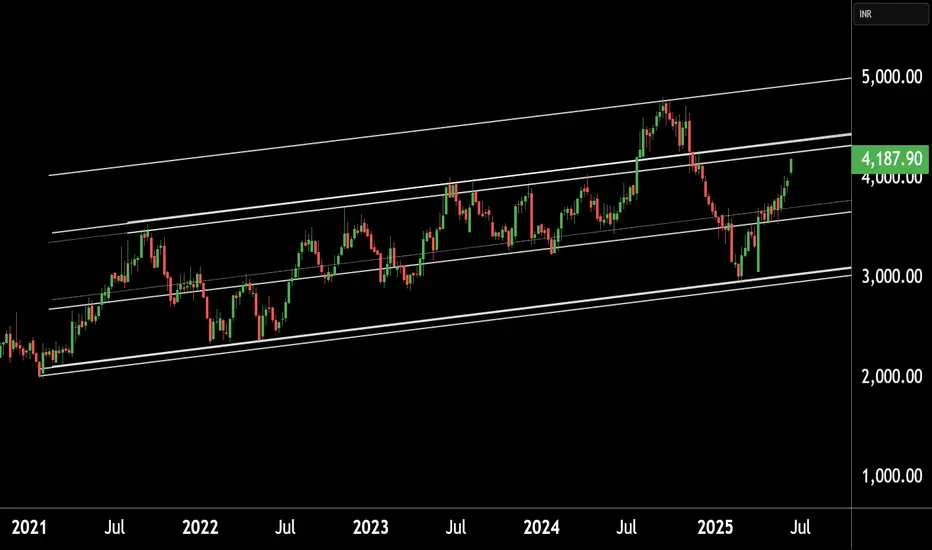
PI INDUSTRIES LTD at Key Resistance !!This is the Weekly chart of PI INDUSTRIES LTD.
PIIND having good law of polarity at 4300-4400 range.
If this level is sustain , then we may see lower prices in PIIND.
Thank You !!
HUGE $1.45 to $10.84 in hours +647% run with Double Buy! $SRMMentioned it in chat early premarket, then warned again as it started setting up. Buy Alert twice with $5.86 average price and waiting for the new highs blowout.
Huge win into the strong push 💸✈️ NASDAQ:SRM

₿itcoin: Continuing B WaveBitcoin has recently reclaimed the key $106,000 level. Under our primary scenario, we anticipate continued increases into the blue Target Zone between $117,553 and $130,891 – where green wave B is expected to conclude. From that corrective peak, we project a significant move lower in wave C, which should ultimately pull prices into the lower blue Target Zone between $62,395 and $51,323. This range is expected to mark the completion of orange wave a. We then foresee a brief corrective rally before wave (ii) completes its broader correction with a final sell-off.
📈 Over 190 precise analyses, clear entry points, and defined Target Zones - that's what we do.

Ripple: Lower Low ExpectedWe still expect magenta wave (2) to conclude within the magenta Target Zone between $1.03 and $0.38 – a range we consider attractive for long entries. That said, there's a 40% probability that magenta wave alt.(2) has already bottomed. If so, a direct breakout above resistance at $3.00 and $3.39 would confirm this alternative scenario and suggest that the corrective phase is already behind us.
📈 Over 190 precise analyses, clear entry points, and defined Target Zones - that's what we do.

$NMR Breakout 240% Upside Ahead$NMR/USDT has broken out of its long-term downtrend, bouncing from a key support zone around $7.20–$7.50.
The breakout signals a potential trend reversal. If this level holds, price could target $26.50, offering a 240% upside.
DYRO, NFA

AVAX/USDTFor the Ava currency, I found the weekly time frame more convenient for analysis. The story is that the channel has ended and we are currently in a trading range and are moving towards the bottom of the trading range. Do you know how we should trade in trading ranges?

DOGE/USDTDogecoin is currently in a trading range and could enter a trend if it breaks the upper and lower lines. We'll have to wait and see what happens.

Silver Gains on Tensions, Eyes on FedFriday’s strong U.S. data may support the dollar, as the University of Michigan’s Consumer Sentiment Index rose to 60.5 in June from 52.2, beating forecasts of 53.5 and marking the first gain in six months.
Geopolitical tensions continue to drive safe-haven demand, especially for silver. Israel struck Iranian nuclear and missile sites Friday, killing military officials. On Sunday, Iran began its fourth phase of response, warning of firm retaliation to further Israeli actions.
Markets now turn to Wednesday’s Fed meeting. While rates are expected to stay unchanged, futures still price in two cuts this year, possibly starting in September, supported by last week’s soft inflation data.
Resistance is set at 36.90, while support stands at 35.40.
