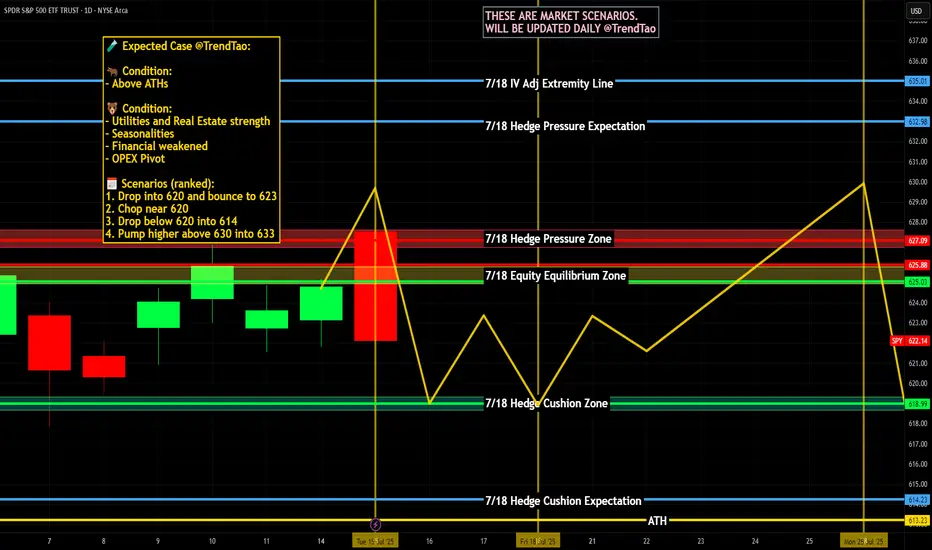
Nightly $SPY / $SPX Scenarios for July 16, 2025 🔮 Nightly AMEX:SPY / SP:SPX Scenarios for July 16, 2025 🔮
🌍 Market-Moving News 🌍
📈 Record Bullish Sentiment Signals Rotation
Bank of America reports the most bullish fund-manager sentiment since February. With 81% expecting one or two Fed rate cuts this year, the group sees a rotation strategy replacing outright selling, with investors tipping toward sector shifts over wholesale exits
⚠️ Trump’s Fed Attacks Stir Policy Concerns
President Trump’s public criticism of Fed Chair Powell—calling for steep rate cuts and threatening removal—has raised market alarms over the central bank’s independence. Analysts warn such interference could destabilize confidence in U.S. monetary policy
🏦 Banks Prepare for Earnings Surge
Major U.S. banks are expected to report strong Q2 results this week. Enhanced trading and investment banking revenues are forecasted to offset economic uncertainties tied to tariffs
📡 Nvidia CEO to Visit Beijing
Jensen Huang is set to hold a high-profile media briefing in Beijing on July 16, signaling continued emphasis on China for Nvidia despite U.S. export restrictions—potentially a key narrative for tech markets
📊 Key Data Releases & Events 📊
📅 Wednesday, July 16:
8:30 AM ET – Producer Price Index (June)
Gauges wholesale inflation pressures; June expected +0.2% MoM vs May’s +0.1%
9:15 AM ET – Industrial Production & Capacity Utilization (June)
Monitors factory and utilities output and usage rates—key for industrial-sector health
Jensen Huang in Beijing
Nvidia CEO to lead media briefing in Beijing—a potential market mover for chipmaking and AI sectors
⚠️ Disclaimer:
This info is for educational purposes only—not financial advice. Consult a licensed professional before making investment decisions.
📌 #trading #stockmarket #inflation #Fed #tech #industrial #PPI
Charting
NVIDIA -- Major Resistance // Confluence of 3 FactorsHello Traders!
WOW... This chart is quite incredible I must say.
It's amazing how price is currently at an exact point where 2 major trendlines converge which also nearly coincides with the 1.618 Fibonacci extension. Price closed almost to the penny just above the major trendline connecting the prior highs. It will be very interesting to see what price does over the next few days.
What Does These Converging Trendlines Mean?: Think of a trendline like a wall... Depending on how "strong" the trendline is, this wall could be made from wood all the way through to vibranium straight from Captain Americas shield! These two trendlines converging would likely resemble a steel wall and would be extremely hard to penetrate. (Although there are no gurantees in trading)
What To Watch For: I will be watching to see if price can both break and confirm above both resistance trendlines. It will take MEGA buying pressure to accomplish this and would likely mean continuation to the upside. If price cannot break and confirm above then we will likely see a large retrace to support.
Thanks everyone and best of luck on your trading journeys!

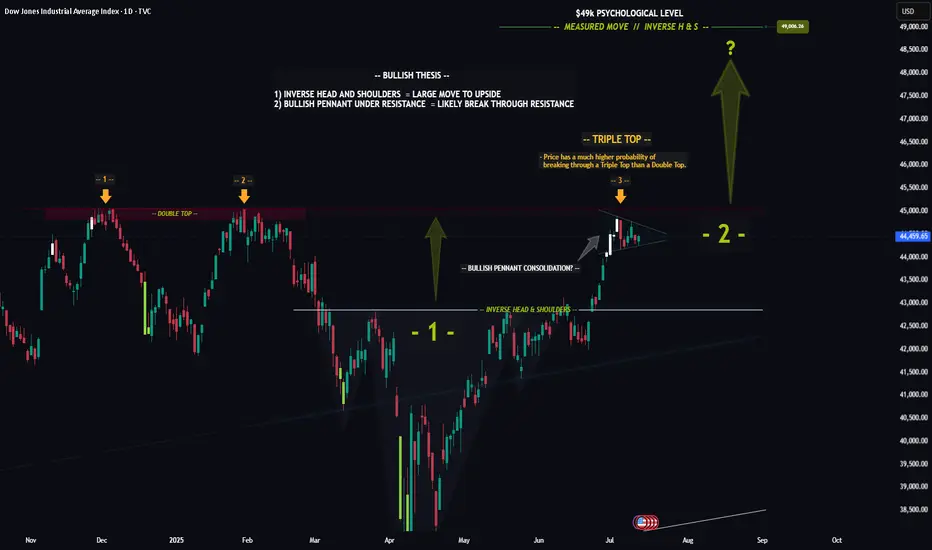
DOW (DJI) -- Preparing For The Next Big Move?Hello Traders!
The chart of the DOW is really quite incredible... Recently price formed a textbook Inverse Head & Shoulders pattern, which led to a nice nearly to the all time high. Furthermore price looks to be consolidating in a Bullish Pennant just below the all time high resistance level.
The reason the Pennant below resistance is so significant is because this signals that investors are likely preparing to drive price higher to new highs. Think about it like a fighter resting before the next big fight.
Triple Top: In addition to the pennant price has now hit this resistance level for the 3rd time. The more times price hits a level typically the weaker it gets. After the 3rd hit the chance of a breakout increases dramatically.
In Summary: The "Triple Top" in conjunction with the "Bullish Pennant" means that there is undoubtedly a very high probability that price will breakout and make new all time highs.
This post is primarily meant to be educational vs a trade idea. Its charts like this that invigorate my technical analysis side and I hope it does for you as well.
Best of luck on your trading journey!
Nightly $SPY / $SPX Scenarios for July 15, 2025🔮 Nightly AMEX:SPY / SP:SPX Scenarios for July 15, 2025 🔮
🌍 Market-Moving News 🌍
📦 Dow Futures Dip on New Tariff Announcements
President Trump announced new 30% tariffs on EU and Mexico, with additional duties on Japan, South Korea, Malaysia, Kazakhstan, South Africa, Laos, and Myanmar starting August 1. Dow, S&P, and Nasdaq futures each slipped ~0.3% as markets assess inflation risk ahead of key CPI data this week
📈 Tech & AI Stocks Lead Despite Tariffs
Stocks like Circle (+9.3%), CoreWeave (+5.2%), Palantir (+5%), Roblox (+5.8%), and Shopify (+4.1%) surged, showcasing sector resilience amid broader tariff fears
⚠️ Deutsche Bank Warns of Summer Volatility
With thin market liquidity and rising geopolitical tension (tariff deadline Aug 1), Deutsche Bank flags summer as a period prone to sudden corrections
📊 Key Data Releases & Events 📊
📅 Tuesday, July 15:
8:30 AM ET – CPI (June)
Core CPI is projected at +0.3% MoM (2.7% YoY) and headline CPI +0.3% MoM—signs tariff effects may be feeding into prices
8:30 AM ET – Core CPI (June)
Expected to come in around 3.0% YoY.
8:30 AM ET – Empire State Manufacturing Survey (July)
Forecast: –7.8 (less negative than June’s –16.0) — a modest sign of stabilizing factory conditions
Fed Speakers Throughout the Day
Watch for commentary from Fed officials (Michael Barr, Barkin, Collins, Logan) for fresh insights on inflation and monetary policy
⚠️ Market Interpretation:
Inflation Watch: A hotter-than-expected CPI could delay anticipated rate cuts and lift yields. A pick-up in core CPI above 3% would be a red flag.
Growth Signals: A less-negative Empire State reading may suggest improving industrial momentum but still signals contraction.
Political Risk: Tariff escalation could shift investor appetite, even if markets right now are focusing on broader macro narratives.
Volatility Setup: The combination of thin liquidity, tariff uncertainty, and critical data makes for a potentially choppy week.
📌 #trading #stockmarket #economy #inflation #tariffs #Fed #CPI #manufacturing #technicalanalysis

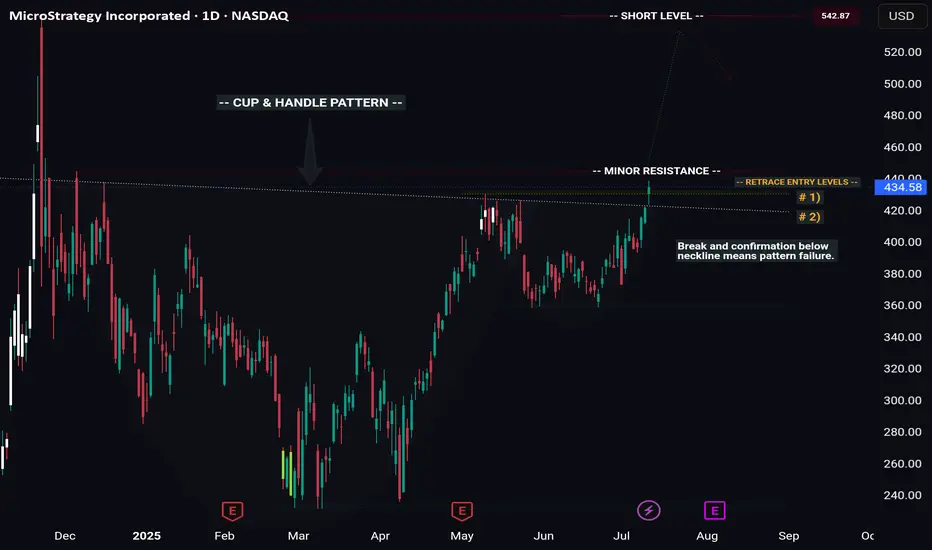
MSTR -- Cup & Handle Breakout // Long & Short SetupsHello Traders!
There is a beautiful cup and handle pattern that has formed on MSTR (Microstrategy).
This pattern offers us a wonderful long setup, as well as a potential short at the all time high.
Pattern Failure: If price both breaks and confirms below the C&P neckline the pattern is void.
Price will likely temporarily pull back from the all time high, giving us our short setup. However you'll want to be in and out quick considering price will likely continue to new highs after pulling back.
I will be swing trading the long setup and likely day trading the short setup.
Have fun and best of luck to everyone on their trading journey!
Weekly $SPY / $SPX Scenarios for July 14–18, 2025🔮 Weekly AMEX:SPY / SP:SPX Scenarios for July 14–18, 2025 🔮
🌍 Market-Moving News 🌍
⚖️ Powell Faces ‘Epic’ Trade‑Inflation Dilemma
Former Fed economists warn Chair Powell is navigating nearly unprecedented terrain: tariffs are pushing up prices even as the labor market cools. Striking a balance between inflation control and growth support remains a formidable challenge
📊 Tariff‑Driven Inflation May Peak This Week
June’s CPI is expected to show a 0.3% month-on-month increase, potentially lifting core inflation to ~2.7%—its highest level in 18 months. These data will heavily influence the Fed’s decision-making process
🏦 Big Bank Earnings Kick Off
Earnings season begins with JPMorgan ( NYSE:JPM ), Goldman Sachs ( NYSE:GS ), Wells Fargo ( NYSE:WFC ), and Citigroup ($C) reporting. Strong results could offset trade and inflation anxieties; expect volatility in financials
📈 Goldman Sees Broader S&P Rally
Goldman Sachs projects the S&P 500 to climb roughly 11% to 6,900 by mid‑2026, underpinned by firm earnings and expected Fed rate cuts. But warns that breadth remains narrow, increasing downside risk without robust participation
⚠️ Summer Volatility Risk Lingers
Deutsche Bank warns that summer’s low liquidity and the looming Aug 1 tariff re‑imposition deadline may spark sudden market turbulence—even amid bullish sentiment
📊 Key Data Releases & Events 📊
📅 Monday, July 14
Quiet start—markets digest back-to-back CPI, tariffs, and clearing post‑earnings.
📅 Tuesday, July 15
8:30 AM ET – Consumer Price Index (June)
Watch for potential tariff impact in CPI; core inflation data are crucial.
8:30 AM ET – Core CPI (June)
10:00 AM ET – Empire State Manufacturing Survey (July)
Early view on Northeast factory trends.
📅 Wednesday, July 16
8:30 AM ET – Producer Price Index (June)
Wholesale inflation signals to validate CPI trends.
10:00 AM ET – Housing Starts & Building Permits (June)
📅 Thursday, July 17
8:30 AM ET – Initial & Continuing Jobless Claims
A gauge on labor-market resilience amid talks of cooling.
📅 Friday, July 18
10:00 AM ET – Federal Reserve Beige Book Release
Fed’s regional economic snapshot ahead of next FOMC.
⚠️ Disclaimer:
This is for educational/informational use only—not financial advice. Consult a licensed professional before investing.
📌 #trading #stockmarket #economy #tariffs #inflation #earnings #Fed #CPI #technicalanalysis

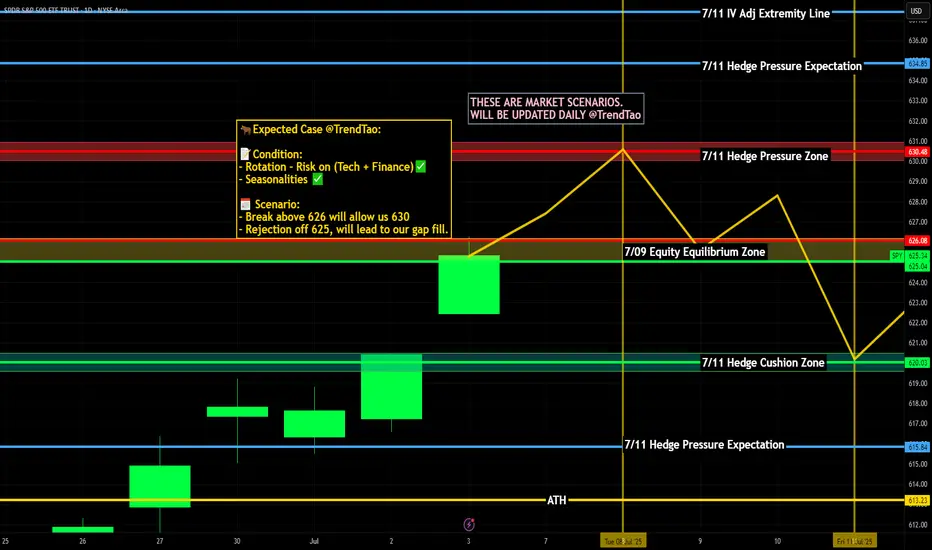
Nightly $SPY / $SPX Scenarios for July 11, 2025🔮 Nightly AMEX:SPY / SP:SPX Scenarios for July 11, 2025 🔮
🌍 Market-Moving News 🌍
🏦 Strong Bank Earnings Amid Tariff Churn
Next week’s Q2 forecasts point to robust earnings from U.S. banks—JPMorgan, Citi, Bank of America, Goldman Sachs, Morgan Stanley, and Wells Fargo—as trading and investment-banking revenue recover, offsetting uncertainties from ongoing tariffs
💬 Dimon Flags Fed Risk Pricing
JPMorgan’s Jamie Dimon cautioned that markets may be underestimating upside in interest rates. He sees a 40–50% probability of higher U.S. rates, driven by inflation from tariffs, migration, and fiscal deficits
⚖️ Tariff “Scattergun” Sparks Sector Disconnect
Trump’s plans to levy up to 200% tariffs on pharma and 50% on copper triggered uneven market reactions—copper prices rose 30% in six months, while European drugmakers remain flat, highlighting divergent sector sensitivities
📉 Tech & Macro Still Bullish
Despite policy turbulence, Nvidia climbed back above a $4 trillion valuation, and JPMorgan projects a $500 billion inflow into equities in H2—supporting gains even as broader macro pressures linger
📊 Key Data & Events
📅 Friday, July 11:
(No major U.S. economic data scheduled)
Markets will focus on bank earnings previews, tariff headlines, and the hold of the tech rally into a thin summer trading week.
⚠️ Disclaimer:
This information is for educational and informational purposes only and should not be construed as financial advice. Always consult a licensed financial advisor before making investment decisions.
📌 #trading #stockmarket #economy #tariffs #banks #tech #Fed #investing

Nightly $SPY / $SPX Scenarios for July 10, 2025🔮 Nightly AMEX:SPY / SP:SPX Scenarios for July 10, 2025 🔮
🌍 Market-Moving News 🌍
🏦 Global Banks Profit from Tariff Volatility
Major banks like JPMorgan, BofA, and Citigroup are expected to see ~10% growth in trading revenue in Q2, fueled by volatility from President Trump’s tariff policy shifts. Treasury trading volumes hit record highs as markets priced in policy swings
📈 S&P 500 Nears Lull Amid Bull Market Strains
Despite record highs in 2025, investors are warning that the rally may be reaching its limit. Bullish sentiment is strong, but analysts caution that sluggish consumer spending, rising inflation from tariffs, and few rate-cut signals from the Fed could cap downside momentum
🐻 Bear Case Gains Ground
Stifel’s Barry Bannister projected a potential ~12% correction in the second half of 2025. Key risks include slowing consumer spending, weak capital investment under tariff uncertainty, and persistent core inflation above 3%, negatively impacting earnings and growth outlooks
⚖️ “One Big Beautiful Bill” Could Add Trillions in Debt
The new fiscal package signed July 4 will add $3–4 trillion to national debt over the next decade while extending tax cuts and revising EV incentives. Bond market and Fed policy implications may become more pronounced if growth fails to keep pace
📊 Stocks vs Bonds: Diverging Signals
While equities climb and megacaps extend gains, Treasury yields have risen five days straight—signaling growing caution over real growth prospects. The yield curve steepening hints at mixed signals: growth optimism in stocks, but bond market signaling economic risk ahead
📊 Key Data & Events
📅 Thursday, July 10:
No major scheduled economic releases. Markets remain driven by tariff headlines, bank earnings reactions, and evolving Fed signals.
⚠️ Disclaimer:
This is for informational and educational purposes only—not financial advice. Consult a licensed advisor before making investment decisions.
📌 #trading #marketvolatility #tariffs #banks #Fed #debt #technicalanalysis

Nightly $SPY / $SPX Scenarios for July 9, 2025🔮 Nightly AMEX:SPY / SP:SPX Scenarios for July 9, 2025 🔮
🌍 Market-Moving News 🌍
📦 Tariff Pause Extended to August 1
President Trump delayed the July 9 tariff deadline, pushing negotiations into early August. Markets reacted with muted volatility, suggesting growing comfort that deals will be struck—yet widespread uncertainty remains
💵 Junk Bonds Rally Amid Tariff Tangling
Despite ongoing tariff risks, investors are doubling down on U.S. high-yield (junk) bonds. They anticipate the Fed may refrain from tightening further—favoring spread-tightening to around 7–8% yields—reflecting confidence in credit quality
🏦 Fed Faces Tough Call on Rate Path
New business surveys show conflicting signals: mixed revenue outlooks, cautious spending, and ongoing tariff pressures. The Fed must weigh slower growth against inflationary risks—keeping the door open to rate cuts in the autumn but unlikely before September
📊 Equities Firm Amid Tariff Uncertainty
Stocks showed resilience—S&P 500 and futures held position—after Monday’s tariff-triggered dip. Dip-buying and expectations of extended trade talks kept markets steady despite policy noise
📊 Key Data Releases & Events 📊
📅 Wednesday, July 9:
All Day – Ongoing U.S.–tariff negotiations; markets focused on any progress toward formal deal-making or extension terms.
Midday – Watch for headlines on tariff letters to 14 countries and any movement in trade discussions.
⚠️ Disclaimer:
This information is for educational and informational purposes only and should not be construed as financial advice. Always consult a licensed financial advisor before making investment decisions.
📌 #trading #stockmarket #economy #tariffs #Fed #fixedincome #credit #technicalanalysis

Nightly $SPY / $SPX Scenarios for July 8, 2025🔮 Nightly AMEX:SPY / SP:SPX Scenarios for July 8, 2025 🔮
🌍 Market-Moving News 🌍
📉 U.S. Stocks Slip on New Tariff Threats
President Trump announced plans to impose 25% tariffs on imports from Japan, South Korea, Malaysia, Kazakhstan, South Africa, Laos, and Myanmar starting August 1, reigniting trade jitters. The Dow fell ~0.9%, the S&P 500 dropped ~0.8%, and the Nasdaq slid ~0.9% on the news, while bond futures rallied and the dollar strengthened
⚖️ Tariff Pause Deadline Looms
Markets are focused on the July 9 deadline for the current tariff pause, which now hinges on imminent trade negotiations. Investors are balancing the risk of reimposition against progress with agreements involving the U.K., Vietnam, and Canada
💵 Consumer Credit Moderates
June’s consumer credit increase slowed to $10.60 billion vs. April’s $17.87 billion—still strong, but a cooling sign in household borrowing patterns. This tempered the dollar’s rise amid mixed signals on consumer resilience.
🛢️ Oil Drops on Rising OPEC+ Supply
Oil prices fell, with Brent dipping to ~$68.00/barrel and WTI to ~$65.30, after confirmation of OPEC+’s August supply hike—adding to bearish cues for energy stocks .
📊 Key Data Releases & Events 📊
📅 Tuesday, July 8:
3:00 PM ET – Consumer Credit (June)
Moderation in borrowing signals possible easing in consumer-driven growth.
4:30 PM ET – API Weekly Crude Inventories
A key indicator for energy markets; lower inventories lift oil prices, while builds push them down.
Throughout the Day – Tariff Pause Deadline
Market stability hinges on whether trade agreements materialize before the break expires.
⚠️ Disclaimer:
This information is for educational and informational purposes only and should not be construed as financial advice. Always consult a licensed financial advisor before making investment decisions.
📌 #trading #stockmarket #economy #tariffs #consumercredit #oil #technicalanalysis

Weekly $SPY / $SPX Scenarios for July 7–11, 2025🔮 Weekly AMEX:SPY / SP:SPX Scenarios for July 7–11, 2025 🔮
🌍 Market‑Moving News 🌍
📈 From Panic to "Goldilocks" Rally
The S&P 500 and Nasdaq hit fresh record highs, surging ~20% from April lows. Markets rallied on a combination of easing Middle East tensions, the 90‑day tariff pause, a new fiscal bill in Washington, and strong June jobs data. Still, strategists caution that optimism may be ahead of fundamentals, especially if trade volatility returns
💱 Dollar Weakness & Bond Market Watch
The U.S. dollar remains near 3.5‑year lows amid rate‑cut speculation and trade progress. Treasury yields are volatile this week, impacted by concerns over escalating debt issuance, upcoming tariff deadlines (July 9), and the Federal Reserve’s stance .
🏢 Tech Leadership Shifts
With the “Magnificent Seven” tech stocks near heights, growth is spreading: cyclical sectors, small‑caps, and industrials are gaining momentum. AI remains the primary engine, but resilience across a broader stock base is signaling a potentially sustainable rally
⚠️ Tariff Truce Deadline Looms (July 9)
The April tariff pause expires mid‑week. U.S. plans to extend exemptions via trade talks with partners like UK, Vietnam, and Canada—yet any delay or failure may shock markets. Watch for headlines that may trigger spillover effects .
📊 Key Data Releases & Events 📊
📅 Monday, July 7:
Independence Day markets resume. Light trading expected ahead of data and tariff deadline.
📅 Tuesday, July 8:
10:00 AM ET – Consumer Credit (June)
Gauges borrowing trends—an indicator of household health in a low‑rate environment.
📅 Wednesday, July 9:
EIA Crude Oil Inventories & MBA Mortgage Apps & Wholesale Inventories
Key mid‑week data points; oil builds may pressure energy stocks.
Tariff Pause Deadline – Expect market volatility on news of extension or reimposition.
📅 Thursday, July 10:
8:30 AM ET – Initial & Continuing Jobless Claims
10:00 AM ET – Natural Gas Inventories
Markets focus on labor health and energy trends.
📅 Friday, July 11:
10:00 AM ET – Treasury Budget Statement
Details on government borrowing and fiscal outlook—markets sensitive to deficit risks.
⚠️ Disclaimer:
These insights are for educational purposes only—not financial advice. Consult a licensed advisor before making investing decisions.
📌 #trading #stockmarket #economy #news #tariffs #Fed #AI #technicalanalysis
Nightly $SPY / $SPX Scenarios for July 3, 2025🔮 Nightly AMEX:SPY / SP:SPX Scenarios for July 3, 2025 🔮
🌍 Market-Moving News 🌍
📉 U.S. Private Payrolls Surround Weakness
The ADP report showed a drop of 33,000 private-sector jobs in June, the first decline in over two years, reflecting businesses holding back hiring amid trade uncertainty. However, layoffs remain low, signaling no acute stress yet
📊 Markets Braced for NFP Caution
Markets are wary ahead of this morning’s Non‑Farm Payroll (NFP) release—currently projected at +115,000 jobs and 4.3% unemployment—based on indications of labor-market cooling from weak ADP numbers
💵 Canadian Dollar Strengthens
The loonie jumped 0.4% as investors adjust expectations for broader central-bank dovishness, driven by the weak U.S. jobs signals and optimism over a revived U.S.–Canada trade dialogue
📊 Key Data Releases 📊
📅 Thursday, July 3:
8:30 AM ET – Non‑Farm Payrolls (June):
Forecast: +115,000; Previous: +139,000 (May). Watching for signs of sustained job-growth slowdown.
8:30 AM ET – Unemployment Rate:
Forecast: 4.3%, up from 4.2% in May. A rise may increase odds of rate cuts.
8:30 AM ET – Average Hourly Earnings (MoM):
Forecast: +0.3%; prior: +0.4%. Cooling wages would ease inflation pressures.
8:30 AM ET – Initial & Continuing Jobless Claims:
Track week-to-week stability or worsening of labor-market conditions.
9:45 AM ET – Services PMI (June, flash):
Monitor for signs of slowing in U.S. service-sector activity.
10:00 AM ET – ISM Non-Manufacturing PMI (June, flash):
Forecast: 50.8. A reading below 50 suggests contraction in services.
⚠️ Disclaimer:
For informational and educational purposes only. It does not constitute financial advice. Consult a licensed financial advisor before making investment decisions.
📌 #trading #stockmarket #economy #jobs #Fed #labor #technicalanalysis

Nightly $SPY / $SPX Scenarios for July 2, 2025🔮 Nightly AMEX:SPY / SP:SPX Scenarios for July 2, 2025 🔮
🌍 Market-Moving News 🌍
🏭 U.S. Manufacturing Remains Under Pressure
The ISM Manufacturing PMI for June rose slightly to 49.0 from 48.5 in May—still in contraction territory. Tariff-induced uncertainty and rising input costs continue to weigh on factory activity, with new orders still weak and employment contracting
📈 Global Factory Rebound Led by India & Europe
While U.S. factories struggle, India hit a 14-month high in its manufacturing PMI at 58.4, and euro‑zone factory orders stabilized at 49.5—the first sign of recovery in over three years. Asia-Europe divergence may shift global capital flows .
🏦 Powell Says Tariffs Are Delaying Rate Cuts
Fed Chair Powell warned at the ECB forum in Sintra that elevated inflation—driven in part by Trump-era tariffs—has postponed the timeline for U.S. rate cuts. The Fed’s dot-plot now indicates only two cuts for 2025, with markets adjusting accordingly
💵 Dollar Nears 3½-Year Lows
The U.S. dollar weakened further, trading near a three-and-a-half-year low amid soft PMI data, a dovish Fed tilt, and renewed optimism over U.S.–Canada trade talks
📊 Key Data Releases & Events 📊
📅 Wednesday, July 2:
(No major scheduled U.S. economic data)
Market focus shifts to upcoming Nonfarm Payrolls on July 3, Powell's remarks, and trade-talk headlines.
⚠️ Disclaimer:
This information is for educational and informational purposes only and should not be construed as financial advice. Always consult a licensed financial advisor before making investment decisions.
📌 #trading #stockmarket #economy #manufacturing #Fed #inflation #charting #technicalanalysis

Nightly $SPY / $SPX Scenarios for July 1, 2025 🔮 Nightly AMEX:SPY / SP:SPX Scenarios for July 1, 2025 🔮
🌍 Market-Moving News 🌍
📊 Core Inflation Edges Higher
May’s core inflation rose unexpectedly to 2.7% year-over-year, up from 2.6%, casting uncertainty over the Fed’s timeline for rate cuts. While headline CPI sits at 2.3%, the resilience in underlying prices complicates policymakers’ projections for later this year
💵 Weak Dollar, Rising Rate-Cut Bets
Markets are reacting to “summertime data”—like the core CPI uptick—with renewed optimism. Traders now see up to 75 bps in Fed rate cuts later this year, while the dollar remains near 3½-year lows on concerns about Powell’s independence and trade developments
🇨🇦 U.S.–Canada Trade Talks Resume
Trade talks between the U.S. and Canada restarted today, following Ottawa’s suspension of its digital-services tax. Progress toward a broader agreement could reduce tariff risk and offer further relief to risk assets
📊 Key Data Releases & Events 📊
📅 Tuesday, July 1:
All Day – U.S.–Canada Trade Talks
Markets will watch for updates on tariff resolution and broader trade deals. Any breakthrough could notably boost equities and improve trade sentiment.
10:00 AM ET – ISM Manufacturing PMI (June)
A below-50 reading again would reinforce the narrative of industrial weakness. A rebound could support equities and temper recession concerns
10:00 AM ET – JOLTS Job Openings (May)
Still at elevated levels (~7.39 million in April), this metric assesses labor-market resilience. A decline could shift rate-cut expectations.
⚠️ Disclaimer:
This is for educational and informational purposes only. It does not constitute financial advice. Consult a licensed financial advisor before investing.
📌 #trading #stockmarket #economy #news #trendtao #charting #technicalanalysis

Weekly $SPY / $SPX Scenarios for June 30 – July 3, 2025🔮 Weekly AMEX:SPY / SP:SPX Scenarios for June 30 – July 3, 2025 🔮
🌍 Market-Moving News 🌍
📈 US Stocks Rally to Record Highs
Following a volatile first half, U.S. equities surged into record territory in late June on a combination of easing Middle East tensions, cooling inflation data, and the 90-day tariff pause
💵 Dollar Weakens on Fed and Trade Uncertainty
The U.S. dollar fell to a 3½-year low, pressured by persistent speculations over President Trump replacing Fed Chair Powell and extending rate-cut expectations, as well as progress in U.S.-Canada trade talks
🇨🇦 U.S.–Canada Trade Talks Lift Sentiment
Canada temporarily repealed its digital services tax to facilitate talks seeking a broader trade agreement by July 21, boosting U.S. equity futures
🛢️ Oil Prices Stabilize
After spiking on geopolitical fears, oil traders settled between $65–78/bbl amid supply relief following ceasefire developments and easing Middle East risks
⚠️ July Risks Loom
The coming week will spotlight:
July 4 deadline for Trump’s tax bill
Expiry of the tariff pause on July 9
U.S. Nonfarm Payrolls on July 3
Each poses potential for increased volatility if outcomes disappoint
📊 Key Data Releases & Events 📊
📅 Monday, June 30
9:45 AM ET – Chicago PMI (June): Gauge of Midwestern factory activity
📅 Tuesday, July 1
U.S. markets open, watch trade developments
📅 Wednesday, July 2
Global PMI readings released
📅 Thursday, July 3 (Early close ahead of Independence Day)
8:30 AM ET – Nonfarm Payrolls (June)
8:30 AM ET – Unemployment Rate (June)
8:30 AM ET – Average Hourly Earnings (June)
These labor metrics will be critical for Fed rate outlooking
⚠️ Disclaimer:
This information is for educational and informational purposes only and should not be construed as financial advice. Always consult a licensed financial advisor before making investment decisions.
📌 #trading #stockmarket #economy #jobs #Fed #oil #trade #technicalanalysis

Nightly $SPY / $SPX Scenarios for June 27, 2025🔮 Nightly AMEX:SPY / SP:SPX Scenarios for June 27, 2025 🔮
🌍 Market-Moving News 🌍
📉 Global Markets Bet on Dovish Fed Pivot
Markets are pricing in more aggressive Federal Reserve rate cuts—approximately 125 bps by end-2026—due to speculation that President Trump may replace Chair Powell with a dovish successor. Investors caution excessive political influence could jeopardize Fed independence
🏦 Fed Governor Warns of Tariff Risks
Fed’s Michael Barr emphasized that tariffs could trigger inflation and unemployment, reinforcing the Fed’s wait‑and‑see approach. Expect modest rate cuts later this year, contingent on economic signals
📉 Q1 GDP Revised Sharply Lower
First-quarter U.S. GDP was downgraded to an annualized contraction of 0.5%, a deeper fall than previously reported. The revision underscores drag from weak consumer spending and trade disruptions
📃 Trade Deficit Widens in May
U.S. goods trade deficit expanded 11% to $96.6 billion, driven by a $9.7 billion drop in exports. Trade gap dynamics remain a headwind for growth projections
🐘 JPMorgan Sees Stagflation Risks
JPMorgan revised its U.S. GDP growth forecast down to 1.3%, warning that tariff-related “stagflationary impulse” is complicating growth and inflation outlooks—and making recession risks more real
📊 Key Data Releases 📊
📅 Friday, June 27:
8:30 AM ET – U. of Michigan Consumer Sentiment – June (Prelim.)
Expected to reflect growing economic caution. The index fell in May; traders will watch for further weakness.
10:00 AM ET – Fed Stress Test Results
Fed to release annual bank stress-test outcomes. Strong results support financial stability, while weak spots could unsettle markets
⚠️ Disclaimer:
This information is for educational and informational purposes only and should not be construed as financial advice. Always consult a licensed financial advisor before making investment decisions.
📌 #trading #stockmarket #economy #Fed #inflation #macro #charting #technicalanalysis

Nightly $SPY / $SPX Scenarios for June 26, 2025🔮 Nightly AMEX:SPY / SP:SPX Scenarios for June 26, 2025 🔮
🌍 Market-Moving News 🌍
💱 Dollar Mounts Decline on Fed Credibility Concerns
The U.S. dollar dropped to a 3½-year low against the euro after reports that President Trump is considering replacing Fed Chair Powell as early as September or October. The move fueled market concern about the Fed’s independence and prompted traders to raise the likelihood of a July rate cut to 25%, with nearly 64 bps of rate cuts priced in by year-end
📉 Markets Stay Cautious Ahead of Powell’s Testimony
Traders remain on edge as Fed Chair Powell’s Capitol Hill testimony continues. He reiterated caution, noting inflation risks tied to tariffs despite growing calls for easing, keeping interest-rate expectations in limbo .
📈 S&P 500 Nears All-Time Highs in Second-Biggest Bi‑Monthly Rally
The S&P 500 has notched its second-largest May–June rally on record (6.2% in May, further gains in June), bolstered by cooling inflation, easing Middle East tensions, and strong AI earnings momentum led by Nvidia. Bull-case scenarios could push the index to fresh highs
📊 Key Data Releases 📊
📅 Thursday, June 26:
(No major U.S. economic release—markets are focused on Powell’s remaining testimony and global risk dynamics.)
⚠️ Disclaimer:
This information is for educational and informational purposes only and should not be construed as financial advice. Always consult a licensed financial advisor before making investment decisions.
📌 #trading #stockmarket #economy #Fed #inflation #geopolitics #technicalanalysis

Nightly $SPY / $SPX Scenarios for June 25, 2025🔮 Nightly AMEX:SPY / SP:SPX Scenarios for June 25, 2025 🔮
🌍 Market-Moving News 🌍
💱 Dollar Slides on Middle East Ceasefire Optimism
A fragile ceasefire between Israel and Iran lifted risk sentiment across global markets. The U.S. dollar weakened, while the euro and British pound hovered near multi‑year highs
📈 Equities Near Record Highs
The S&P 500 and Nasdaq pushed toward all-time highs on June 25, supported by the Middle East truce and retreating energy prices. The S&P 500 rallied ~1.1%, with tech and discretionary sectors leading the charge
🛢 Oil & Treasuries Dip, Yield Cuts Anticipated
Oil plunged ~6% to ~$65/bbl as conflict fears eased. Softer prices plus weak consumer confidence spurred expectations of up to 60 bps in Fed rate cuts by December; Treasury yields pulled back accordingly
📉 Consumer Confidence Falls Again
The Conference Board’s index dropped to 93—the lowest level since May 2020—as concerns over tariffs and job availability weighed on households
📊 Key Data Releases 📊
📅 Wednesday, June 25:
(No major U.S. economic data scheduled)
Markets remain focused on geopolitical dynamics, Fed commentary, and next week’s PCE inflation release.
⚠️ Disclaimer:
This information is for educational and informational purposes only and should not be construed as financial advice. Always consult a licensed financial advisor before making investment decisions.
📌 #trading #stockmarket #economy #geopolitics #Fed #inflation #technicalanalysis
Nightly $SPY / $SPX Scenarios for June 24, 2025🔮 Nightly AMEX:SPY / SP:SPX Scenarios for June 24, 2025 🔮
🌍 Market-Moving News 🌍
🇺🇸 Markets Eye Powell Testimony & Consumer Confidence
Today brings a double dose of market-moving data: the June Consumer Confidence Index and Fed Chair Jerome Powell’s testimony before Congress. These will be key indicators of household sentiment and potential shifts in Fed rate guidance
🛢️ Oil Volatility Persists on Middle East Strain
Oil prices briefly spiked after U.S. strikes on Iran’s nuclear facilities, prompting fears of supply disruptions. However, prices have since dipped as ceasefire hopes emerge. Investors remain cautious on energy headwinds
💱 Dollar Retraces on Safe-Haven Rotation
The dollar softened after peaking as geopolitical tensions eased slightly. Still, it remains sensitive to Powell’s tone and confidence data, which could reintroduce volatility
📊 Key Data Releases & Events 📊
📅 Tuesday, June 24:
10:00 AM ET – Conference Board Consumer Confidence (June)
Monitors household optimism; a rebound could support consumer spending and equities.
10:00 AM ET – Fed Chair Powell Testimony Begins
Powell appears before the House Financial Services Committee. Market focus: inflation outlook, tariffs, and potential timing for rate cuts.
⚠️ Disclaimer:
This information is for educational and informational purposes only and should not be construed as financial advice. Always consult a licensed financial advisor before making investment decisions.
📌 #trading #stockmarket #economy #Fed #trade #energy #technicalanalysis

Weekly $SPY / $SPX Scenarios for June 23–27, 2025🔮 Weekly AMEX:SPY / SP:SPX Scenarios for June 23–27, 2025 🔮
🌍 Market-Moving News 🌍
🌐 Geopolitics Add to Risk Aversion
The S&P 500 is up about 0.9% so far in June, but analysts warn it’s facing a “precarious” phase amid renewed Middle East conflict and looming U.S. tariff deadlines in July–August. Elevated oil prices could fuel inflation, while fiscal and debt ceiling pressures weigh on sentiment
🎙️ Powell Heads to Capitol Hill
Fed Chair Powell will testify before Congress this week. His remarks on inflation and rate outlook—particularly regarding the Fed’s recent dot-plot revisions and monetary policy uncertainty—will be central to market direction
📈 Nike, FedEx & Micron Earnings Under Focus
Key corporate earnings (Nike, FedEx, Micron) could provide fresh insight into how tariffs and supply-chain disruptions are impacting major U.S. businesses
🛢️ Oil Prices Elevated
Oil remains range-bound at multi-week highs near $75–80/bbl following U.S.–Israel military action in Iran, which briefly spiked prices ~7–11%. Continued dependence on Middle Eastern supply may keep energy complex volatile
⚖️ NATO Summit Tightens Security Focus
NATO leaders meet in The Hague, marking an elevated global defense posture amid geopolitical uncertainty. Defense and aerospace stocks may remain pressured or volatile depending on summit outcomes
📊 Key Data Releases & Events 📊
📅 Monday, June 23
9:45 AM ET: S&P Global Flash U.S. Services & Manufacturing PMI (June)
10:00 AM ET: Existing Home Sales (May)
📅 Tuesday, June 24
10:00 AM ET: Consumer Confidence Index (June)
Testimony: Fed Chair Jerome Powell appears before Congress
📅 Wednesday, June 25
10:00 AM ET: New Home Sales (May)
📅 Thursday, June 26
8:30 AM ET: Advance Q1 GDP (Final Estimate)
📅 Friday, June 27
8:30 AM ET: Core PCE Price Index (May) — Fed’s preferred inflation gauge
⚠️ Disclaimer:
This is for educational and informational purposes only. It does not constitute financial advice. Always consult a licensed financial advisor before investing.
📌 #trading #stockmarket #economy #geopolitics #Fed #oil #charting #technicalanalysis

Nightly $SPY / $SPX Scenarios for June 20, 2025🔮 Nightly AMEX:SPY / SP:SPX Scenarios for June 20, 2025 🔮
🌍 Market-Moving News 🌍
🏦 Fed Holds Rates, Warns on Tariffs
Fed kept interest rates steady on June 19, cautioning that tariffs could stoke inflation and slow growth. Inflation projections were raised from 2.7% to 3.0%, while growth estimates were revised lower to 1.4%
🌍 Middle East Risk Drags Markets
Global stocks fell and safe-haven assets surged after U.S. futures weakened amid heightened tensions in the Israel–Iran conflict. Yields were mixed: gold weakened and bonds gained, while oil held steady near seven-week highs
📈 Treasury Yields Edge Higher
Despite safe-haven demand, U.S. 10‑year yields ticked up as markets absorbed the Fed’s updated rate outlook. The yield curve remains elevated ahead of next week’s $38 bn auction of long-dated notes
📊 Key Data Releases 📊
📅 Friday, June 20:
(No major U.S. economic reports)
Markets will be driven by Fed commentary follow-ups and geopolitical headlines over the weekend.
⚠️ Disclaimer:
This information is for educational and informational purposes only and should not be construed as financial advice. Always consult a licensed financial advisor before making investment decisions.
📌 #trading #stockmarket #economy #geopolitics #fixedincome #inflation #charting #technicalanalysis

Nightly $SPY / $SPX Scenarios for June 18, 2025🔮 Nightly AMEX:SPY / SP:SPX Scenarios for June 18, 2025 🔮
🌍 Market-Moving News 🌍
💼 Business Inventories Flat in April
U.S. business inventories held steady in April, indicating stable consumer and wholesale demand. That suggests production won't need to cut sharply in the near term, supporting GDP outlook
🏭 Industrial Production Slips
Industrial output declined 0.2% in May, signaling ongoing weakness in factory activity amid less favorable global trade conditions .
🌐 Geopolitical Pressures Persist
Heightened tension in the Middle East continues to pressure risk assets. Investors remain focused on safe-haven flows into gold, Treasuries, and defensive equities, with analysts noting the risk backdrop remains tilted to the downside
📊 Key Data Releases 📊
📅 Wednesday, June 18:
8:30 AM ET – Housing Starts & Building Permits (May)
Measures new residential construction — leading indication of housing sector health.
8:30 AM ET – Initial Jobless Claims
Tracks the weekly count of new unemployment filings — useful for spotting early labor-market weakening.
2:00 PM ET – FOMC Interest Rate Decision
The Federal Reserve is expected to hold steady. Market focus will be on any commentary that hints at future tightening or easing plans.
2:30 PM ET – Fed Chair Powell Press Conference
Investors will parse Powell’s remarks for guidance on rate paths, inflation trends, and economic risks.
⚠️ Disclaimer:
This is for educational/informational purposes only and does not constitute financial advice. Consult a licensed advisor before making investment decisions.
📌 #trading #stockmarket #economy #housing #Fed #geo_risk #charting #technicalanalysis

Nightly $SPY / $SPX Scenarios for June 17, 2025🔮 Nightly AMEX:SPY / SP:SPX Scenarios for June 17, 2025 🔮
🌍 Market-Moving News 🌍
📈 U.S. Retail Spending Holds Firm
May’s retail sales were flat month-over-month, defying expectations of a slowdown. Core retail sales (ex-autos) edged up +0.2%, signaling resilience in consumer purchases—an encouraging sign for economic momentum
🤖 Tesla’s Robotaxi Buzz Accelerates
Tesla stock surged after a weekend robotaxi video surfaced ahead of its planned Austin launch. A viral clip showed a Model Y “robotaxi” navigating traffic autonomously, sparking fresh investor enthusiasm despite safety debates
📊 BoJ Holds Rates; Dollar Edges Higher
Japan’s central bank left policy unchanged at 0.5%, maintaining its dovish bias. This lifted the dollar slightly versus the yen, drawing focus to global interest-rate divergence
📊 Key Data Releases 📊
📅 Tuesday, June 17:
8:30 AM ET – Retail Sales (May)
Consumer purchases are tracked, excluding autos. Monitor if activity stays steady despite inflation and rate pressures.
9:15 AM ET – Industrial Production & Capacity Utilization (May)
Provides insight into factory activity and plant usage—a gauge of economic health amid global slowdown concerns.
10:00 AM ET – Business Inventories (April)
Shows stock levels held by wholesalers and manufacturers. Higher inventories with weaker sales may signal slowing demand.
⚠️ Disclaimer:
This information is for educational and informational purposes only and should not be construed as financial advice. Always consult a licensed financial advisor before making investment decisions.
📌 #trading #stockmarket #economy #news #trendtao #charting #technicalanalysis
