EURUSD – From Structure to Shift
1H Technical Outlook by MJTrading
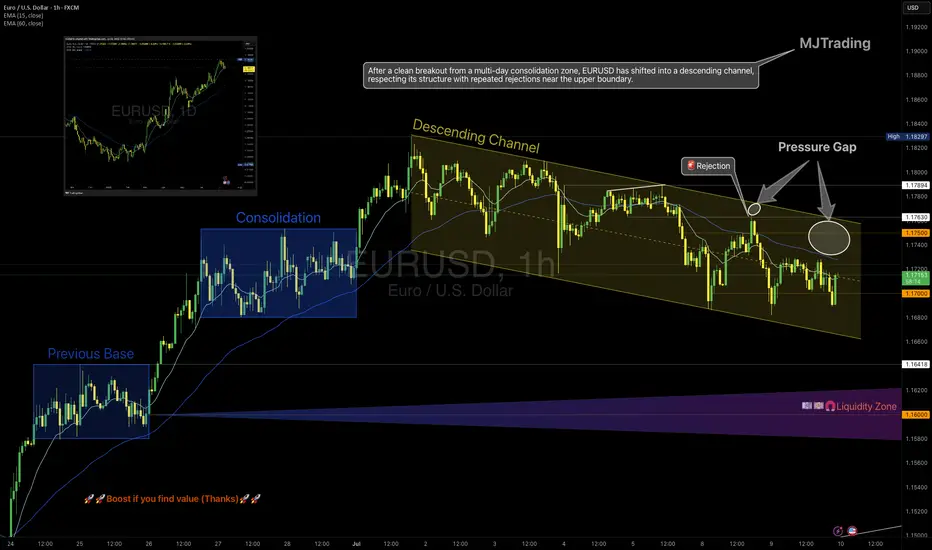
EURUSD moved cleanly through a sequence of structural phases:
• Previous Base
• Multi-day Consolidation (potential quiet accumulation)
• Transition into a well-respected Descending Channel
Price has since shown repeated rejections from the upper boundary, including a decisive selloff from the 1.1750 zone, forming what we now label a "Pressure Gap" — a space where aggressive sellers overwhelmed price.
🧭 Key Scenarios Ahead:
🔻 Bearish Continuation:
Breakdown below 1.1700 opens room toward:
• 1.1640 (channel bottom)
• 1.1600 Liquidity Zone
Watch for impulsive sell candles + EMA rejection
🔁 Short-Term Bounce or Trap:
Holding above 1.1700 could spark a rebound toward 1.1750
This may serve as a final test before another leg lower
Only a clean break and hold above 1.1763 flips structure bullish
🔍 Bonus Confluence:
1D Chart shows broader bullish context (inset)
EMAs tightening = expect volatility burst
Well-defined structure gives clear invalidation and targets
Every trend tells a story — from base building to breakout, and now a possible breakdown. Trade the structure, not the prediction.
#EURUSD #Forex #TradingView #TechnicalAnalysis #PriceAction #DescendingChannel #LiquidityZone #SmartMoney #MJTrading
Chartist
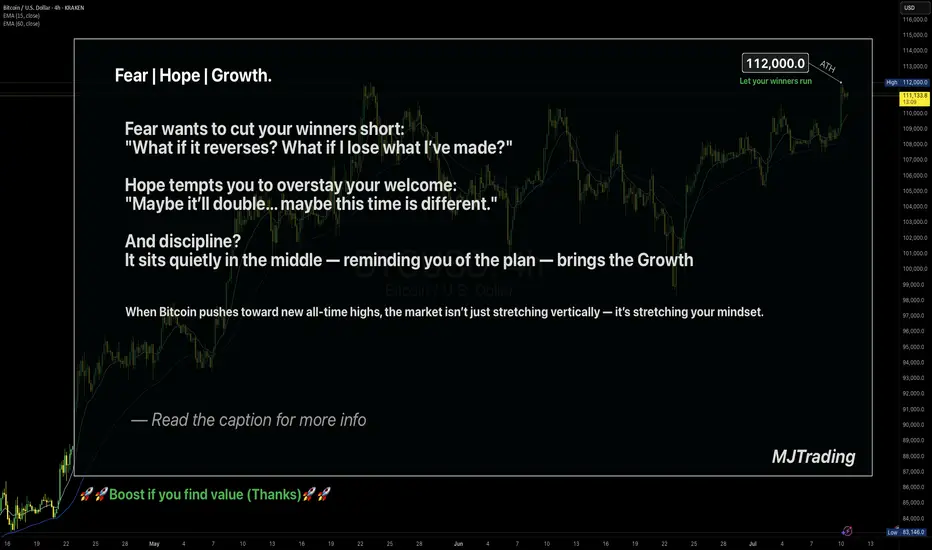
Let your winners run🧠 Fear | Hope | Growth – When Trading Meets Emotion
The message on the chart isn't just poetic — it's real psychology.
🔹 Fear wants to cut your winners short.
It sneaks in after a small move in your favor.
"What if it reverses? I better lock this in."
And just like that, a great trade turns into a missed opportunity.
🔹 Hope drags you into holding too long.
It dreams: "Maybe it doubles... maybe this time it'll be massive."
But it's not guided by data — it's driven by fantasy.
🔹 Discipline is what sits in the middle.
Quiet. Neutral.
It doesn’t scream or seduce — it just follows the plan.
And that’s where Growth lives — not just on the PnL, but in your psychology.
When Bitcoin pushes toward new ATHs, these emotions get amplified.
The real question becomes: Can you manage yourself, not just your trade?
📌 A Real Example from My Desk
In my earlier BTCUSD idea — “Another Edge – Decision Time” (shared above) —
I sent that setup to one of my managed clients.
He entered long exactly at the edge of the channel — a clean, strategic buy.
Price moved beautifully in our favor…
But he manually closed the trade at 106,600 — long before the move matured.
Why?
Because fear of giving back profit overwhelmed the original plan.
The chart was right. The timing was right.
But the exit was emotional, not tactical.
✅ The trade made money.
❌ But the lesson is clear: a profitable trade doesn’t always mean a disciplined one.
🎯 Final Takeaway:
“Fear kills your winners. Hope kills your timing. Discipline grows your equity and your character.”
🗣 What would you have done in that position?
Held longer? Closed at resistance? Let it run toward ATH?
Let’s talk psychology — drop your thoughts 👇
#MJTrading
#TradingPsychology #BTCUSD #FearHopeDiscipline #LetYourWinnersRun #PriceAction #BTCATH #ForexMindset #CryptoStrategy
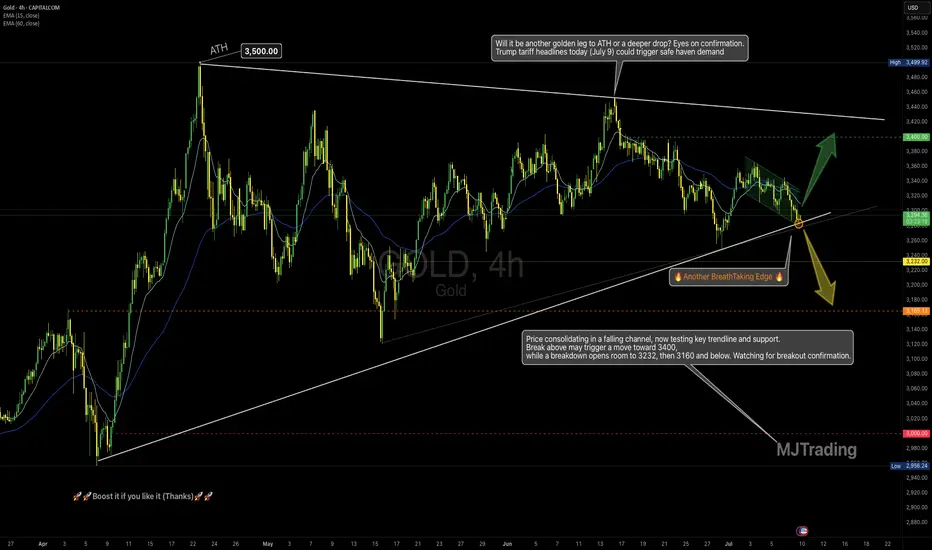
Gold at a Decision Point-Just as Tariff Headlines Return(July 9)📌
4H Technical Outlook by MJTrading
Price is compressing inside a falling channel, nested within a large symmetrical triangle, and now sits right at a high-stakes confluence zone — a perfect intersection of dynamic EMAs, rising trendline support, and local structure.
This could be a pivot point for the next major leg.
🧭 Key Scenarios:
🟢 Bullish Breakout Potential:
If price breaks above the falling channel and holds above $3,310–$3,320:
🎯 Target: $3,400, and eventually upper triangle resistance near $3,480–$3,500
✅ Watch for impulsive breakout + retest confirmation
🟡 Bearish Breakdown Risk:
If the rising trendline gives way and price closes below $3,275 (High Risk) and $3,245(Low Risk):
🎯 Targets: First $3,232, then key level $3,166
⚠️ Further weakness may expose $3,000 psychological support
🔍 Why It Matters:
• Symmetry + compression = potential volatility expansion
• Trump tariff headlines today (July 9) could trigger safe haven demand
• Strong historical respect of these trendlines
• EMAs aligning around decision zone
“Another BreathTaking Edge” — because this is one of those moments where market structure whispers louder than words.
🗣 Boost if you find value, and follow MJTrading for more clean setups.🚀🚀
#XAUUSD #Gold #TradingView #TechnicalAnalysis #ChartPatterns #PriceAction #BreakoutTrade #Forex #MJTrading
Zoom in to get closer to battlefield:
Zoom out to see where we are:
PRZ at 0.6600? | Watching for Reversal from Channel Top👆🚀Boost it if you like it... (Thank you) 🚀👆
Pair: AUD/USD Timeframe: 4H Bias: Short-term bearish Custom Term: PRZ (Possible Reversal Zone) = 0.65696
📈 Technical Structure:
AUD/USD is trading within a well-respected ascending channel, with price currently hovering near 0.6570. The upper boundary of the channel aligns closely with the PRP zone at 0.6600, which also coincides with:
A prior supply zone (visible on higher timeframes).
Confluence of the 15 EMA (0.65692) and 60 EMA (0.65534) flattening out.
Psychological round number resistance.
Entry: 0.65700
Stop: Above 0.66064 (channel breakout invalidation)
Target 1: 0.6540
Target 2: 0.6500
Risk/Reward: ~1.8
(Warning: This is an early entry )
🧠 Psychology Insight:
The PRP concept helps frame trades around areas of emotional overextension—where traders may overcommit to a breakout. By identifying these zones in advance, you stay objective and avoid reactive decisions.
PRZ: Possible Reversal Zone
#AUDUSD #PRZ #Forex #TechnicalAnalysis #ChannelTrading #ReversalZone #PriceAction #MJFX #TradingPsychology #ToughButSuccessful

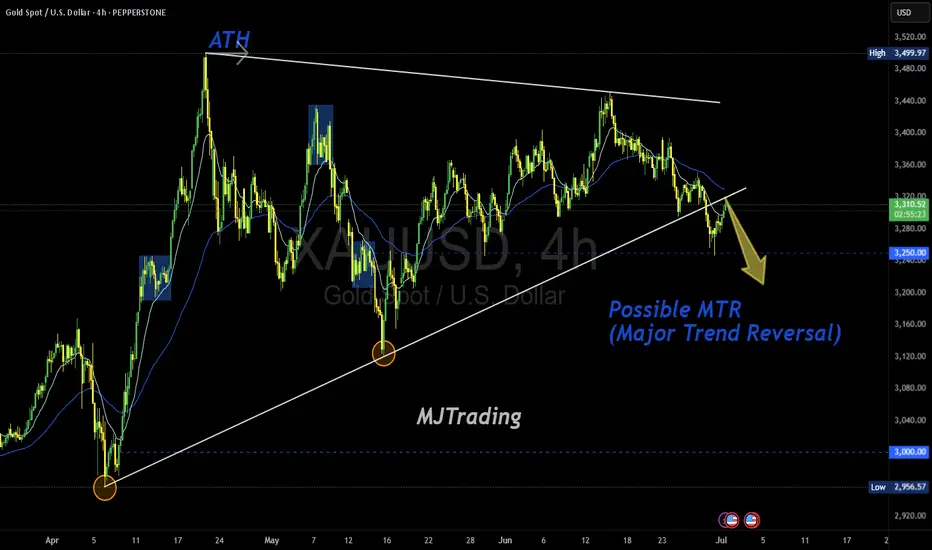
Possible MTR in Play (TBC)Gold has printed a textbook structure for a potential Major Trend Reversal (MTR) off the ATH zone, with a clean rejection and a shift in character. The descending trendline from the top aligns with lower highs, while the ascending base from April is now under pressure.
📌 Key Levels to Watch:
3,280.0 – neckline of the potential MTR
3,250.00 – psychological magnet and structural support
3,000.00 – major downside target if the reversal confirms
🧠 “Markets top on euphoria, not logic.” If price breaks and retests the neckline with momentum, the MTR thesis gains traction. Until then — TBC.
#XAUUSD #Gold #MajorTrendReversal #MTR #PriceAction #TechnicalAnalysis #GoldBears #ATHRejection #TrendShift #MJTrading
BTCUSD – Major Decision Point at The Edge📍 By: MJTrading |||
Bitcoin has rallied sharply from ~$98K and is now testing a critical confluence zone — the top of the descending channel and a strong supply area, known as "The Edge."
EMAs are turning up, supporting bullish momentum
⏳ What’s Next?
At this stage, two scenarios emerge:
⚠️ This is a make-or-break zone:
🟩 Breakout above the channel signals trend reversal → next resistance: $111K
🟨 Rejection leads to a move back to the $103K or $100K levels
This setup offers a high-RR opportunity for both breakout traders and mean reversion players.
🧠 Trade the reaction at the edge, not the prediction.
Thanks for your attention...
Share your thoughts...
—
#BTCUSD #Bitcoin #CryptoTrading #TheEdge #BreakoutOrBounce #CryptoSetup #DescendingChannel #SmartMoney #TechnicalAnalysis #PriceAction #SwingTrade #EMA #RiskReward #MJTrading #4hChart #TrendDecision #SupplyZone

Retest of New Highs and Pullback Zone✨ By MJTrading:
Chart Overview:
AUDUSD reached a 2025 new high around 0.65600 before pulling back sharply. Price broke out of a consolidation wedge and is now retesting the prior breakout and dynamic support area.
🔹 Key Points:
Structure: Clear impulse move to new highs, followed by corrective pullback.
Support Zone: Blue box ~0.6480–0.6500 could act as a demand area if price extends lower.
EMAs: Price testing the 60 EMA (~0.6523) after losing short-term momentum.
Trade Setup:
Entry: 0.65250
SL: 0.65510
TP1: 0.65000
(Please Manage your Risk)( Ideal: 1% Per Trade)
Possible Scenarios:
Bullish reaction from current EMA support or the blue demand zone.
Deeper retracement if price fails to hold above 0.6500.
💡 Note:
This chart highlights how prior consolidation and breakout zones can offer potential retest entries in trending markets.
Thanks for your time an attention...
Follow for more setups.
#MJTrading
#AUDUSD #Forex #TechnicalAnalysis #PriceAction #BreakoutTrading #SupportResistance #TradingView #FX

Silver - M30What a breath-taking EDGE...
Wait for confirmation then enter...
Please Manage Your Risk.
#Silver #XAGUSD #Forex #chart #Edge #MJTrading

EURUSD Sell SetupBy: MJTrading:
EUR/USD has rallied into a significant resistance zone, approaching the upper boundary of a rising wedge/channel pattern. The price is now hovering around a key confluence zone, where trendline resistance and horizontal supply intersect ( 1.16300 —1.16500 )
There are to possible scenarios:
1) If the price Rejects directly from previous High
🔹 Position 1: Sell Stop @ 1.15915
🛑 Stop Loss: 1.6375
🎯 Take Profit: 1.5454
R/R:1
isk Level: Medium
2) If price tries to reach the boundary of the wedge or make a Fake breakout:
🔹🔹 Position 2: Sell Limit @ 1.16300
🛑 Stop Loss: 1.6930
🎯 Take Profit: 1.5000
R/R:2
Risk Level: Low
📌 This zone offers a high-probability reversal setup
📉 Why it Matters:
Price action shows signs of exhaustion after a parabolic move.
EMA structure is stretched, hinting at a potential pullback.
Lets ZOOM OUT:
Daily Chart:
ZOOM IN:
Stay disciplined, let price come to you, and manage risk.
—
#EURUSD #ForexSetup #TradingStrategy #TechnicalAnalysis #ChartPattern #FXTrading #ShortTrade #MJTrading #BearishReversal #PriceAction #SwingTrade #ForexIdeas #Trendlines #BreakoutOrFakeout #RiskReward

AUD/USD – Rejection at 2025 High?By: MJTrading
📉 AUD/USD – Rejection at 2025 High?
The Aussie is struggling at its 2025 high, printing successive lower highs (LH) and flirting with the 60-period EMA. With momentum leaning bearish, a short opportunity opens up near 0.64878, targeting the 0.64094 support zone. Confirmation from the EMA breakdown and rejection wicks strengthens the setup. Stop-loss above 0.65285 protects against a breakout trap.
Entry: 0.64883
Stop Loss: 0.65285
TP1: 0.64500
TP2: 0.64100
#Hashtags: #AUDUSD #ForexTrading #TechnicalAnalysis #ReversalSetup #BearishBias #LowerHighs #EMARejection #ShortThePop #PriceAction

BTCUSD – Price Approaching The Edge of the Channel📍 BTCUSD – Price Approaching The Edge of the Channel
Bitcoin has surged sharply from the lower boundary of its descending channel and is now reaching another “Edge” — the upper resistance line.
🎯 Two Key Scenarios:
🟩 Bullish Breakout: A clear breakout above ~$108,000 with strong volume could initiate a new leg toward $111K and beyond
🟨 Bearish Rejection: Failure to break the channel may lead to a corrective wave back toward $103K or lower
This is a classic "decision point" — where market structure and momentum meet supply and resistance.
—
#BTCUSD #Bitcoin #CryptoTrading #TechnicalAnalysis #PriceAction #TheEdge #ChannelTrading #EMA #BitcoinResistance #MJTrading #CryptoSetup #SwingTrade #MarketStructure #BreakoutOrRejection #KeyLevel #TrendWatch

Edge of the Wedge || GBPJPY
Simply Breakout and retest of the Edge of the Wedge
Entry: 198
Tp1: 200
TP2: 202
TP3: 204
SL: 196
A classic trend following setup

High Probability BUY Zone at The Edge📍 XAUUSD – High Probability BUY Zone at The Edge
Gold is currently reacting at a high probability BUY area, supported by multiple technical confluences:
✅ $3,300 Round Number: Psychological level and historical reaction zone
✅ Completion of 2nd Bearish Leg: A classic two-leg correction often signals exhaustion
✅ Retest of Uptrend Boundary: Long-term ascending trendline that has supported price since March
📌 Entry: Current price zone
🎯 TP1: Local highs ($3,353)
🎯 TP2: Mid-channel or upper resistance zone ($3,398)
❌ SL: 3263
This is a textbook trend continuation setup — the structure remains bullish unless proven otherwise.
Wait for confirmation or manage your risk accordingly.
—
#XAUUSD #Gold #ForexTrading #MJTrading #TechnicalAnalysis #BuyZone #SwingTrade #SupportZone #TrendlineSupport #SmartMoney #PriceAction #ForexSignals #CommodityTrading #MarketStructure #RiskReward #ChartSetup #ForexCommunity

EURUSD entering the Bear Zone ...Have an eye on the Orange Circle for a possible short position...
Stay tuned for the comprehensive analysis in next IDEA...
Thank you for your attention and support...
#EURUSD #MJTRADING #FOREX

Breakout from Demand Zone🟡 XAU/USD – 2H Chart Analysis
Title: “Compression Breakout From Demand Zone – Room to Revisit Highs”
Bias: Bullish (Momentum Confirmation)
Timeframe: 2H
Chart Reference: MJTrading – June 23, 2025
📍 Context & Structure:
Gold has just broken out of a multi-candle compression range after tapping into a well-defined demand zone between $3,333 – $3,346. This area acted as the launchpad for previous rallies and is now showing fresh signs of accumulation.
Two EMAs (15 & 60) are attempting a bullish crossover, supporting a shift in momentum.
📈 Trade Setup (Long Bias):
Entry: ✅ Market or retest at $3,366
Stop Loss: 🔴 Below the recent demand base at $3,330
Target 1: 🟢 $3,415 (local swing high)
Target 2: 🟢 $3,460–$3,480 (upper major supply / range top)
R/R Ratio: 🔁 ~2
🔍 Why It Matters:
✅ Price defended key demand zone
✅ Strong engulfing candle with decent volume signals a reversal
⚖️ MJTrading Note:
“Gold thrives on uncertainty — and this bounce from a high-confluence demand zone could be the beginning of a push back toward the highs, especially if macro data shifts in favor.”
#MJTrading #Gold #XAUUSD #Forex #chart #signal #buy #long

GOLD PLAYGROUND AROUND $3000-$3100? FED SPEECH NEXT WEEK!!!GOLD currently trade at $2987 when i write this idea. GOLD bullish momentum started when CPI data released followed by PPI data. Both of data show inflation slowdown. Last Tuesday, job opening data also showed us a neutral level and we can conclude that the labor market is still in slow pace. A week ago NFP also showed us weak data and slow down in labor market. Fundamentally, this labor market slow down and inflation that coming up in a lower level will give THE FED to cut rate in the next May or June.
Besides all that the trade war still heating up and there is no clear way how to end the geopolitical war in Russia - Ukraine and also Middle East. Traders seems just make early entry and buying GOLD as safe haven commodity and assume THE FED will cost lower borrowing rate.
Technically, GOLD just broke it's resistance trendline on symmetrical triangle pattern. It's just indicates that bullish movement of this instrument still going on and we don't know where it will stop. I see $3032 as the next level if $2986-$2987 broke up.
Is there any surprises in the next week? IF THE FED revised it's Federal Fund Rate to 3.4% or lower i see GOLD will play at $3000-$3100 for a few next month
Do you have any opinion guys?? Just give your comments below!

Will Geopolitical and Trade War Uncertainty boost GOLD?GOLD now seen climbs to it's last ATH. Technically, GOLD just made a minor wave and stopped just at 38.2 fibonacci TF H1. I see GOLD still high chance to reach it's last ATH and still have rooms to make a new ATH again.
Current geopolitical and trade war sentiment just boost gold. Traders also can check dollar index which move lower amid strong inflation data. This show us that 'big whale' have some worries on current uncertainty.
I just take buy chance at 2925 and see 2940 as take profit target with a narrow stop loss at 2921,80. Please do your research guys before entry to market because GOLD could be more volatile.

POUNDS CLIMBS amid Eco Growth & Slower Inflation. What's Next?A week ago BOE just cut it's rate by 25 bps and still have possibility to continue it's normalization cycle. Yesterday we saw GDP m/m actual data higher than expected and it's good for currency. YoY inflation rate also still in control and it's also good for currency.
Technically, the bullish momentum just paused by trendline resistance and classical resistance. Pounds may have correction movement before he continue it's uptrend. Traders may use 1.25000 and see buy chance with a stoploss at 1.24440

GOLD BULLISH TARGET 2025Based on Elliot Wave analysis, SAXO:XAUUSD Gold is currently in 4th wave of the trend where it has potential to continue moving up to its 5th wave completing it's wave. By using the Fibonacci ratio to measure the upside, it indicates that Gold will probably hit 2858 and 2946 in the future. Taking 3000 as its psychological resistance.
Pattern analysis also shows symmetrical triangle pattern where if Gold has successfully breaks the downtrend line of the pattern, this will confirm that the 4th wave is completed and will continue catching upside target of the wave analysis.
However, if Gold hits the downtrend line resistance which the area correspondent to the Fair Value Gap (FVG) area and starts to decline making minor correction, I would strongly recommend to find the nearest support to become entry point. Note that 2620 - 2610 is the strong support that Gold will probably not going to break to maintain its bullish pattern.
Short term upside Target of SAXO:XAUUSD will be at 2762 as it is the Daily Fair Value Gap (FVG) which is likely for GOLD to hit this area.
Gold Bullish Indication points:
1. Elliot wave on 4th wave
2. Symmetrical triangle pattern
3. Strong uptrend
3. Geopolitical tension
4. Expecting another rate cuts in 2025
History repeats itself:
Last year on mid of February, Gold started its strong uptrend momentum until today where it has gained more than $700 in price. I would expect upward momentum later next February where it will continue going up until 2nd quarter of the year.
Disclaimer!!! Do your own research!!!
If you have any comments on my analysis feel free to drop comments below. Hopefully my analysis can be useful for traders around the world.

$NVDA - Majorly Bearish Macro StructureMy previous NVDA previous came in massively early. I think the stock made a 100% increase in value since the time of my original post, shown below. Despite this fact and the recent split, the overall macro formation of the chart has not changed. Although, I was earlier than I would have liked to have been, I fully believe the general sentiment and drastic nature of my prediction to be spot on.
NVDA has legs to climb up to $150-$200 possibly, but the tumble will be tremendous, over time. With 5 waves up, my fellow Elliotticians, we all know what follows.
Do I think NVDA is a crappy company? No.
Do I seriously think $2 will come? Yes

🔔🏄 Gold Goals Revised: Pending ATH @ $2300-$2700Being one of those instances were a few micro level invalidations reverberates throughout both short-term and long-term analysis, I've adjusted my Gold ( OANDA:XAUUSD ) wavemap a bit. On my last shared idea, I was under the impression that Gold would make a big stretch upwards through the middle range of the $2000s before meeting its next considerable resistance level however, re-checking the count from last year's bottom near $1620 I am led to believe differently. I have cancelled the last idea and shared this one under a new thread due to drastic differences in mid-micro wave expectations.
It seemed that a XAU route to $17xx was off limits but with a likely correction soon to come, $1800 may be the minimally expected correction level, making it very possible that Gold could slip into the $178x-$179x range before finding its ground again. Some believe that a $3K ticket could come for XAUUSD in the years ahead, based on the technicals, I am doubtful of this outcome. Instead, considering the already developed internals of the pink wave structure, $2298-$2442 are very much within the expected range based on common fib levels. To also consider the length of the apparent Wave A move in yellow , if Wave C were to match this length, we could see a maximal price tag near $2696.
The observed RSI divergence should continue to remain tru as commonly seen in Wave 5 (when compared to Wave 3). I suspect that the $2298-$2696 price tag could be reached between 2025 and 2026 though timing is always tricky to accurate gauge. Surf well :)

XAUUSD: FOMC will drive the markets, A fake breakout tale!Hello traders,
A fake breakout out of trendline may happen!
FOMC meeting could devaluate this setup.
While There are more buyers in the market today. we expect a reversal from around 1945.00.
There is one entry and 2 TPs for the gold.
Levels calculated order_block, regarding support and resistances, channel and pivot points.

BTC dominance #BTC DOMINANCE UPDATE
Bitcoin Dominance has reached the 46% resistance which correlated with the level 1 by Fibo. Strong resistance from where we can expect a rejection
However, if Bitcoin returns to $25,000+ zone and continues pumping, then this level will be broken and lead Dominance to ultimate resistance of 48% - 48.5%
This is the zone when you can enter any altcoin and with 95%+ probability it will be sold in great profit. Let's pray this zone will be reached
