Gold Bulls Loading Up – Our Short Squeeze Trigger is Set!🚨 Gold Bulls Loading Up – Our Short Squeeze Trigger is Set!
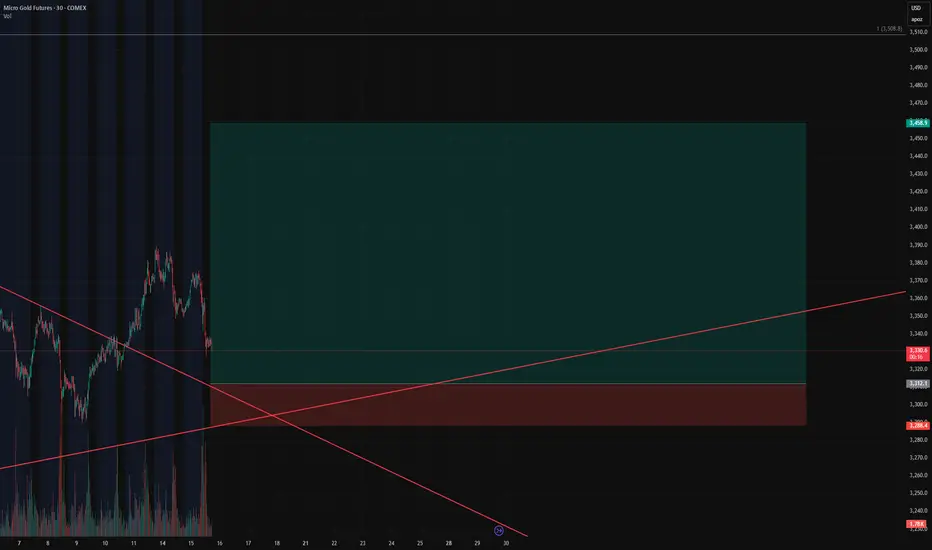
We’re flipping the script on COMEX_MINI:MGC1! After a prolonged downtrend and textbook wedge compression, our breakout long is LIVE – but not without trapping the late shorts first.
💥 Entry: $3,312.1
🛑 Stop: $3,288.4
🎯 Target: $3,458.9
🧮 Risk/Reward: 6.19
Price just bounced at the retest of the wedge apex, and volume is confirming the move. If this holds, we’re riding momentum all the way up – and letting short pressure fuel the breakout.
📈 Trendline breached.
⏳ Time compression converging.
⚠️ If you’re still short, watch your stops!
Chartoftheweek
trend line work support and resistance finally breakout 1) weak chart analysis
2) chart following trend line from 2011 to 2023
3) Trend lines work as support and resistance.
4) December 2009 and July 2011 trend lines work as support
5) 2011 February to July may time work as support and finally break down.
6) this same trend line worked as resistance in august 2014, January 2018 and April 2022
7) August 2014: breakout of this resistance trend line but no sustained upside.
8) Finally, break down bottom level 7 (resistance at 35 and fall down from 40)
9) From bottom level 7 to resistance level 63, it takes 2 years (771% return).
10) from resistance comes down at 9 level
11) may 2022 attempt for break level but not possible that time
12) now this line is breaking out and moving new life time high
13) take 200 as stop loss and get 300-350 first target
no recommendation for buy and sell

Breakout of 8 years chartoftheweak considering "MARKSANS PHARMA LTD"
1) studying weakly chart (long term)
2) eight years breakout
3) formation of #cupandhandle #patter
4) July 2015 to July 2023 time taken for pattern breakout
5) Cup bottom is very low 570% down compare breakout line
6) #fibretracement plot on this Cup and handle pattern exactly match breakouts of support and resistance
7) keeping stop loss of 98
8) upside level 153 short term
9) long term 240& 325
No recommendation for buy and sell
I'm not professionalists just Learning

Exhaustion gap in Infosys stockInfosys stock covered it gap with High valume and bullish candle it will touch new 52 weak high. No recommendation for buy and sell


Breakout 📈Syngene international chart breakout two and half years consolidation and triangle break out ready to hit new 52weak High
Take one risk not for buy and sell just sharing knowledge

Chart of The Week (20/2/2021)This week we are looking at CRISIL Limited. The chart is quite self explanatory and the support line is drawn on the chart. The stock is in good buying zone currently.

EIH : Chart of the week for Swing TradingChart name : EIH
Risk:Reward : 1.94
Trading Style : Swing Trading for 1-4 weeks
DISCLAIMER:
As a trader, you should consider your own risk: reward ratio and do proper lot sizing according to your margin and leverage level. This analysis is a trading idea, not a trading signal for you. Consult your financial advisor before making any trade.
My own trend direction estimation, entry point, stop loss and take profit levels are on the chart.
Please like, comment, and subscribe; if you find value on my analysis and/or liked my strategy.
Good Lucks.

eurusd channeleurusd short channel overnight trade anymore info click on the profile or send a message.

CHF/JPY ready to go higherEver since we hit weekly support level, we saw price price consolidate and now it seems to me that major uptrend is on the way!

TRX/USD Inverse H&S completed!Inverse Head and Shoulder is completed now. So I'm waiting for conformation --> cutting the neck line with high volume.
Stop loss is debatable. I prefer tighter than this. Nothing wrong with looser as well.
_________________________________________________________________________________
If you've found the idea helpful - please like it or smash the follow button!
Other ways to support my work - you can choose to:
--> Sign up on Binance with my Referral Link: www.binance.com
--> Sign up on BitMEX and get 10% discount on all fees for 6 months after you sign up using this Affiliate Link: www.bitmex.com
The supporters will get all the help you need to learn how to use different trading platforms AND understand risk management in trading via Private Messages, Discord, Skype...
Have a plan. Set a stop loss. Set a profit target. Trade.
You can choose instead to make a donation on one of my addresses:
BTC: 12qe5buhPQTAEnqmMYBNafymePd9BAgqJT
ETH: 0x134c60f13c48fe1ea48b10f980a2c68070f1bf82
LTC: LTuRNgXDU2ojj7DseX4GRhQcFyJzXo82mn
Stick to the plan!


USDJPY WEEKLY ANALYSIS I Beleive that the price will sink to around 109.101, before rebounding off the lower support level of the channel that USDJPY has been playing in, supporting this idea is the stochastic K% AND D % lines getting ready for an intersection.

$ZRX #0x - a perfect example of 61.8% Fibonacci retracementHello Lads and Ladies,
The daily TA grind continues now and we will start now with the requested coin 0xBTC. It has had some pretty nice and steady pushes and made it into headlines recently.
To begin with, we can see a very clear ascending trend line which has been confirmed multiple times since the beginning of this year.
We saw 0xBTC coming down to it once again and bouncing from there while making 60% gains, of course it had to retrace and in this case it was very obvious to use the fibonacci tool because, which then worked out like in the textbook. It bounced from the 61.8% line and made another 50% gains and is now currently in its retracement process.
The winning question here is to where it will retrace and where should you put in buy orders.
Here come some interesting factors into account. First of all, the easiest and safest way would be to say it will retrace again to the 61.8% line and then make another 40% push.
BUT we have two intermediate supports on its way down, which might be strong enough to hold 0xBTC there and start a new push from there. These two intermediate supports are located at 16k satoshi and 15.5k satoshi.
Here is what I think will happen and why.
I strongly believe that we will see 0xBTC hit the recent 61.8% line and then a bounce from there on. A very strong indicator for this is that this particular line is not just the 61.8% line but as well a strong support and resistance line historically. Moreover, the two intermediate support lines are just not strong enough to make it bounce from there. I would give them maximum just one small green candle on the daily and then we would see the retirement continue. In addition to that, right now as alt coins are just "suffering" from the Bitcoin push, these small supports are less likely to hold. The desired solution for this would be the recent 61.8% line and after it a bounce. Nevertheless, keeping a tight stop loss is very important because after that there is not much support left downwards and the next stop would be most likely the previous 61.8% and with it the ascending trend line. By saying support I mean here a "trend-turning and new-push-starting" support line.
I always like to analyse first and then take a look at the indicators that I use to see how this would or could work out and if you take a closer look at those the first thing you see is that the RSI is as well following an ascending trend line to which it might come back and from there on continue the push into an overbought region. This would be equivalent to the bounce of one of the intermediate support lines. Looking at Stoch there is still some space for this move.
Nevertheless, the move you want to and I will be putting my money on is RSI retracing down to a strong support at 41 points and with it forming a double bottom, indicating a bounce or stringer movement upwards. This would be equivalent to the retracement to recent 61.8% line and the previous mentioned bounce.
IN NUMBERS -
- BUY 10%@15.5k 90%@14.5k
- SELL 60%@18k 30%@20k leave 10% for above 20k
- SL @13.9k
P.S. we will be covering the correlation between alts an BTC in the next session, so you understand when BTC and alts have a positive or a negative correlation like right now.
Like and Follow me and you will find this page interesting because I am a TA expert and day trader that does daily updates and new posts about the hottest and most discussed coins.
Fell free to request TA for ANY coin you are interested in!!!
Cheers, Tomas

$BTC #Bitcoin - Is Satoshi communicating to us???Hello Lads and Ladies,
This is just a joke to make your day even better and kill all toxic thoughts from the last days!!
The question is though, what is Bitcoin trying to say us?? Or is here even Satoshi trying to communicate to us?!?! Tell me what you think abut that and what might happen next!!
Nevertheless, I see it coming down a little and turning the blue lines into support, from where we could easily get a little rest and start something great again!!! If the blue lines (around 6250) don't hold, I think we will go down even more.
If the resistance at 6800 breaks and we can turn it into support, it looks very nice and we will be heading towards 7800.
Like and Follow me and you will find this page interesting because I am a TA expert and day trader that does daily updates and new posts about the hottest and most discussed coins.
Fell free to request TA for ANY coin you are interested in!!!
Cheers, Tomas

$SC #SIACOIN - Is SIACOIN ready for a move up or fall down?Hello Lads and Ladies,
Today we are looking into a highly traded coin on many exchanges SCBTC.
As we can see in the chart, we see a big triangle forming and getting very close to an end. Looking at the fibs retracement starting in the beginning of the triangle, these have been respected all along. Therefore we will most likely see a very important and dicing point when SCBTC hits 300 satoshi again. Either it will retrace back to the big increasing trend line or will have a move upwards towards the range of 378 and 455.
ANYHOW, there is still a possibility that it will just break down from the trend line and retrace back to 44 satoshi, this is a worst case scenario that is very unlikely to happen.
Therefore, I would say overall we are in an uptrend movement and we will see it continue for quite a while. The next time we see SCBTC hit 300 will be deciding point, it seems like that we are going to test it very soon although not too soon because looking at RSI we are very close to 80 points, which have NOT been crossed a lot of times before.
Like and Follow me and you will find this page interesting because I am a TA expert and day trader that does daily updates and new posts about the hottest and most discussed coins.
Cheers, Tomas

$BTC #BTCUSD stuck in a channel and tired of it. NEW HIGHS AHEADHello Lads and Ladies,
I was looking into BTC -0.22% USD quite a bit right now. Since the yearly low and it's bounce back we are in channel between 5900$ and 12000$. In this channel the fibs lines are almost a law how much they are respected. As well as the over all uptrend line, which many people would set a little higher I see no real confirmation to do so. Therefore, the trend line I see would be confirmed now at 6800$ not 7200$ as many people say. The 7200$ is a part of the 23.6% fibs line, which is on 7400$ but has a range of 2-300 in each direction. If this trend line t 6800 does not have a big bounce back, we will come shortly in the previous regions of 6000-5900$ where it is again STRONGLY OVERSOLD, so from there a huge bounce back will come.
ANYHOW, it is very likely that we will stay at the displayed 23.6% fibs line at 7400$ with a range of 2-300$ for a few days or even a week, and start the next upwards movement from there.
There is right now real reason to go back to the very bottom. The news are mostly neutral and we have touched the space of 10k just a few days ago so it is easier to break the 10k the next time we come near it, what in my opinion will be very soon. We have been long enough in this channel and it is time to leave it and start testing new highs.
Enjoy the ride!!
Cheers, Tomas

GBP/USD : Chart of the week The daily chart shows us a bearish engulfing candle, formed at this resistance line of 1.5780. So we might see a pullback into:
- TL ( 3rd bounce )
- Fib level(s) 38% ( or 50% )
- Zone of support ( where last higher high was formed )
It is here, that we want to go long again and fulfill the fib play and follow the uptrend
