U.S. NATURAL GAS SUCCESSFULLY REBOUNDED FROM FIRM SUPPORT.U.S. NATURAL GAS SUCCESSFULLY REBOUNDED FROM FIRM SUPPORT.
Yesterday the natural gas storage report came out higher than expected. U.S. natural gas inventories increased by 48 billion cubic feet last week to 3,123 Bcf, increasing the surplus over the five-year average to 195 Bcf from 171 Bcf the week before, the EIA reports. The storage increase was bigger than the 24 Bcf average for the week, and above the 36 Bcf estimate. However, the price rised on 2.35% afterwards, supported by increased volume, which indicates the strength of the level. The upward movement towards the 3.3000 level is highly expected.
Additionally, seasonals suggest us that current prices may become the lowest till the end of the year. Historically, since August the natural gas prices increase in anticipation of a new heating season and higher energy demand (pic2).
Chart Patterns

The Low Is In: Why the S&P 500 Just Confirmed a Bullish Reversal🔥 The Low Is In: Why the S&P 500 Just Confirmed a Major Bullish Reversal 🔥
The market just gave us a gift.
After weeks of drifting lower and sentiment turning cautious, the S&P 500 has touched — and bounced — off a critical rising trendline for the third time since May 2025. That third touch isn't just a technical coincidence… it's often the launchpad for a new impulsive leg higher.
📈 The Power of the 3rd Touch: Trendline Validation Complete
Look at the chart. This isn’t guesswork. Since May, the S&P 500 has been respecting a well-defined ascending trendline, one that connects multiple higher lows during this bull run.
The first touch was the May liftoff after the April consolidation.
The second came in June — a clean retest and bounce.
Now, as of early August, the third touch has held once again, exactly where the bulls needed it most.
This isn’t a random line on a chart. This is institutional flow stepping in to defend structure.
And when a rising trendline holds for a third time after a strong uptrend? That’s a classic continuation signal.
📉 RSI Washout + Structural Support = Perfect Storm for a Bottom
The RSI printed a dramatic dip to ~32, a level that screams “oversold” on the 4-hour timeframe. But notice the context — it happened right at structural support.
This is not weakness. This is accumulation.
Big players shake out weak hands on low timeframes… right before they send it.
🧠 Sentiment Is Offside… Again
Let’s not forget: this retrace came after a huge run-up since March. People expected a deeper correction. Bears started getting loud again.
That’s how bull markets trap you — by convincing you it’s over right before the next leg higher.
And with macro tailwinds (liquidity expansion, fiscal spend, tariff rollbacks), earnings season beats, and global capital rotation into U.S. equities, this setup is ripe for a violent upside squeeze.
🚀 8,700 in Sight: My End-of-Year Price Target Is Very Much in Play
Today’s close around 6,220 means the S&P 500 would need to rally ~40% to hit my target of 8,700 by year-end.
Sounds crazy? Not if you’ve seen what happens during parabolic melt-ups.
This isn’t just hope:
📊 Strong breadth under the surface
🏛️ Dovish policy pivot now expected in Q4
💸 Retail and institutional capital both re-engaging
📉 Bond yields are starting to roll over, supporting equity valuations
When bull markets enter their euphoria phase, they don’t stop at “reasonable” targets. They blast through them.
💡 The Setup Is Textbook — Now It’s About Execution
✅ Trendline defended
✅ RSI reset
✅ Sentiment shaken out
✅ Structure intact
The technicals just aligned with the macro. The low is in — and the runway to 8,700 is wide open.
Strap in. Q4 could be one for the history books.

Litecoin H4 | Bullish bounce off 50% Fibonacci supportLTC/USD is falling towards the overlap support and could bounce to the take profit
Buy entry is at 101.85, which is an overlap support that lines up with the 50% Fibonacci retracement.
Stop loss is at 97.43, which is a pullback support that aligns with hte 61.8% Fibonacci retracement.
Take profit is at 110.38, an overlap resistance.
High Risk Investment Warning
Trading Forex/CFDs on margin carries a high level of risk and may not be suitable for all investors. Leverage can work against you.
Stratos Markets Limited (tradu.com ):
CFDs are complex instruments and come with a high risk of losing money rapidly due to leverage. 65% of retail investor accounts lose money when trading CFDs with this provider. You should consider whether you understand how CFDs work and whether you can afford to take the high risk of losing your money.
Stratos Europe Ltd (tradu.com ):
CFDs are complex instruments and come with a high risk of losing money rapidly due to leverage. 66% of retail investor accounts lose money when trading CFDs with this provider. You should consider whether you understand how CFDs work and whether you can afford to take the high risk of losing your money.
Stratos Global LLC (tradu.com ):
Losses can exceed deposits.
Please be advised that the information presented on TradingView is provided to Tradu (‘Company’, ‘we’) by a third-party provider (‘TFA Global Pte Ltd’). Please be reminded that you are solely responsible for the trading decisions on your account. There is a very high degree of risk involved in trading. Any information and/or content is intended entirely for research, educational and informational purposes only and does not constitute investment or consultation advice or investment strategy. The information is not tailored to the investment needs of any specific person and therefore does not involve a consideration of any of the investment objectives, financial situation or needs of any viewer that may receive it. Kindly also note that past performance is not a reliable indicator of future results. Actual results may differ materially from those anticipated in forward-looking or past performance statements. We assume no liability as to the accuracy or completeness of any of the information and/or content provided herein and the Company cannot be held responsible for any omission, mistake nor for any loss or damage including without limitation to any loss of profit which may arise from reliance on any information supplied by TFA Global Pte Ltd.
The speaker(s) is neither an employee, agent nor representative of Tradu and is therefore acting independently. The opinions given are their own, constitute general market commentary, and do not constitute the opinion or advice of Tradu or any form of personal or investment advice. Tradu neither endorses nor guarantees offerings of third-party speakers, nor is Tradu responsible for the content, veracity or opinions of third-party speakers, presenters or participants.

XAUUSD – the calm before the next breakout?Hello traders, what’s your take on the current trend in OANDA:XAUUSD ?
Looking back over the past 12 months, gold has delivered a truly impressive performance. From around $2,380 in August 2024, the precious metal surged to an all-time high of $3,432 by April this year — a gain of more than $1,000 in less than a year. But what’s more telling than the rise itself is how the market behaved afterward: instead of crashing, gold has maintained a high consolidation range, suggesting the uptrend is still very much alive.
This powerful rally didn’t happen in isolation. In a world marked by uncertainty, gold has once again asserted its role as a safe-haven asset. Inflation remains persistent across major economies, geopolitical tensions continue to stretch from Eastern Europe to the Middle East and Asia, and de-dollarization efforts by countries like China and Russia are reshaping global capital flows. None of these events alone could shake the markets, but together, they have laid the groundwork for gold’s sustained relevance.
From a technical standpoint, the long-term bullish structure remains intact. Following its peak at $3,432, gold has entered a modest correction phase — one that may well be a healthy consolidation before the next directional move.
Interestingly, while many investors remain cautious, the chart paints a different story: a market that isn’t afraid, but simply catching its breath. The real question is no longer “Can gold hold above $3,400?” but rather “Is the market gearing up for a fresh breakout — or a deeper correction?”
We may not be able to predict the future, but we can observe how price reacts at key levels. And sometimes, it’s in these seemingly quiet phases that the biggest turning points begin to form.
What do you think — is gold preparing for another leg up?
Drop your thoughts in the comments below! 👇

S&P 500 ETF & Index– Technicals Hint at a Possible Correction📉📊 S&P 500 ETF & Index at Resistance – Technicals Hint at a Possible Correction 🔍⚠️
Everything here is pure technicals— but sometimes, the market whispers loud and clear if you know how to listen. 🧠📐
The VOO ETF, which tracks the S&P 500 , has now reached the upper boundary of a long-term ascending channel, once again brushing against resistance near 590.85. This zone has consistently led to major pullbacks in the past.
On the right panel, the US500 Index mirrors this move—pushing toward all-time highs, right as broader sentiment turns euphoric. Technically, both charts are overextended and pressing into key zones.
👀 Potential Path:
🔻 Rejection from current zone ➝ Down toward 526.17, then 465.72 (green support channel)
🔁 Possible bounce after correction — trend still intact long term
And while we’re keeping it technical, it’s worth noting that the Buffett Indicator (Stocks-to-GDP) i s currently screaming “overvaluation.” This doesn't predict timing—but it adds macro context to an already overheated chart setup.
The lesson? Price respects structure. Whether or not the fundamentals are in agreement, the charts are warning that now may not be the time to chase.
History doesn’t repeat, but it often rhymes. Stay sharp, stay technical. 🎯
One Love,
The FX PROFESSOR 💙
ps. the beauty of these levels? Tight Stop loss- excellent R/R
Disclosure: I am happy to be part of the Trade Nation's Influencer program and receive a monthly fee for using their TradingView charts in my analysis. Awesome broker, where the trader really comes first! 🌟🤝📈

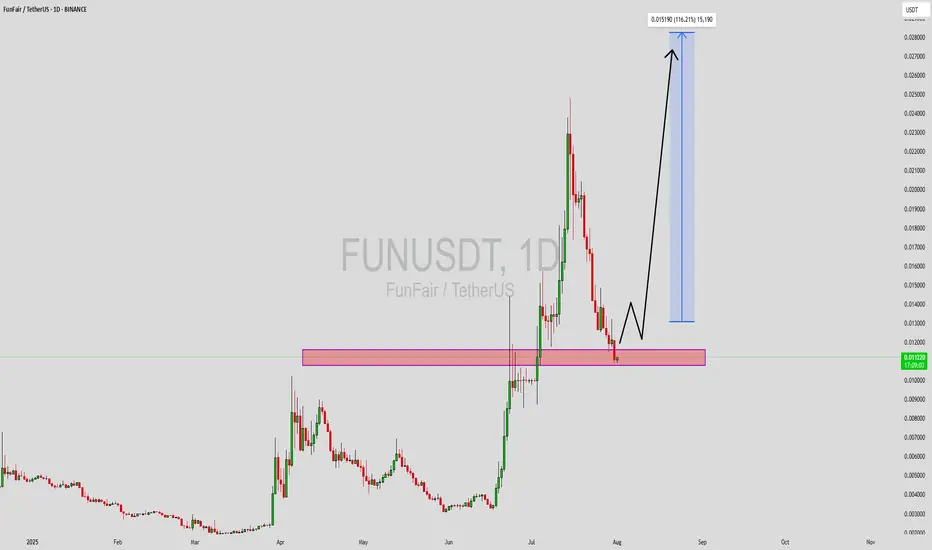
FUNUSDT Forming Bullish ReversalFUNUSDT is currently forming a bullish reversal pattern, signaling a potential shift in market momentum after a prolonged consolidation. This pattern, combined with a steady increase in trading volume, suggests growing investor interest and the possibility of an upcoming trend reversal. The structure aligns well with historical price action, where FUN has previously bounced from similar technical setups, making this an attractive chart for swing traders and medium-term investors.
The volume profile shows accumulation behavior, typically seen before major breakouts. This reflects the confidence of larger market participants entering at lower levels. If FUNUSDT confirms the breakout above resistance zones, the next leg up could lead to a potential price surge of 140% to 150% from current levels. Given its relatively low market cap and recent technical developments, the upside potential remains significant if momentum sustains.
What adds to the bullish thesis is the overall pattern integrity supported by clear trendline reactions and support zone validation. FUN has also maintained a healthy base formation, which often precedes explosive upward moves. A close above key resistance with volume confirmation would likely attract more traders and potentially push FUN into price discovery territory.
Keep this altcoin on your watchlist as it presents a high-reward setup supported by solid technical foundations and increasing trader sentiment.
✅ Show your support by hitting the like button and
✅ Leaving a comment below! (What is You opinion about this Coin)
Your feedback and engagement keep me inspired to share more insightful market analysis with you!
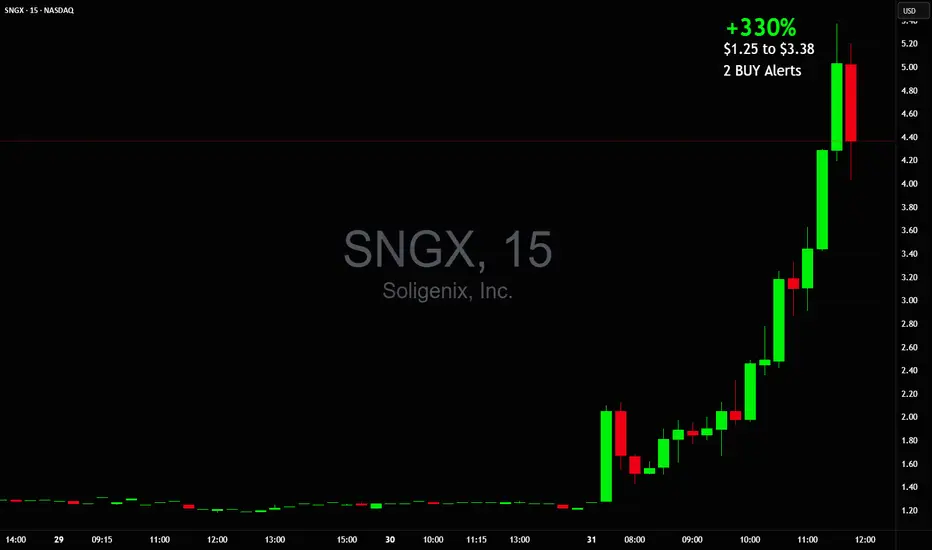
+330% this morning $1.25 to $5.38 on massive 270 million volume🚀 +330% this morning 💥 $1.25 to $5.38 on massive 270 million shares traded volume so far
NASDAQ:SNGX money maker of the day!
2 Buy Alerts sent out, also posted it in my premarket watchlist while it was still up only +30%!
Forget about NASDAQ:MSFT NASDAQ:META NASDAQ:AMZN NASDAQ:NVDA NASDAQ:AAPL AMEX:SPY NASDAQ:QQQ they will never be able to create such gains in a single day or should I say minutes
This isn't options trading either, it's a stock that went up that much this morning
DOGE (Y25.P3.E1). More lows to come before a longHi traders,
My thoughts on taking a short trade on Doge
why?
confluence on … 200 D ema, Avwap , previous support, etc
All the best,
S.SAri.

Nice Bitcoin Bullish Set Up On The Hourly I noticed something that may look interesting on the hourly time frame. So here's a little heads up!

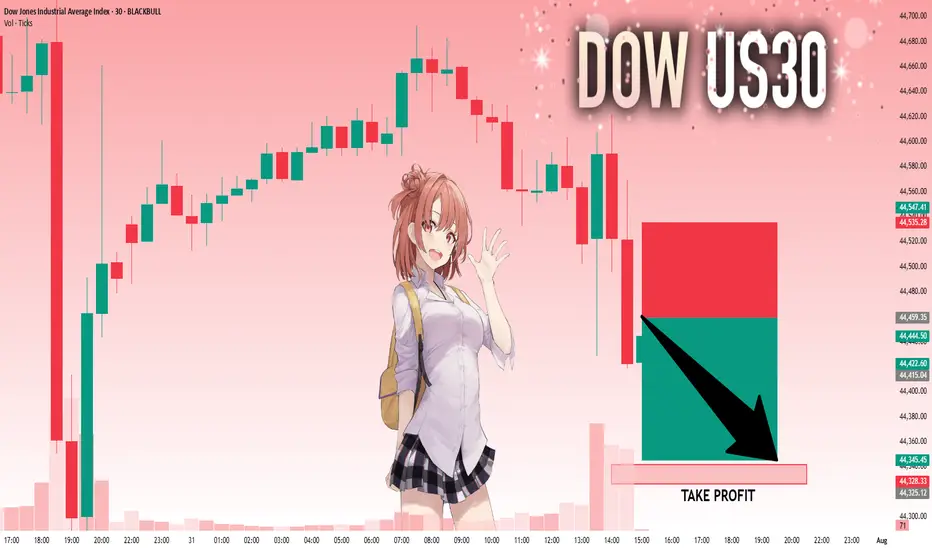
US30: Absolute Price Collapse Ahead! Short!
My dear friends,
Today we will analyse US30 together☺️
The in-trend continuation seems likely as the current long-term trend appears to be strong, and price is holding below a key level of 44,459.35 So a bearish continuation seems plausible, targeting the next low. We should enter on confirmation, and place a stop-loss beyond the recent swing level.
❤️Sending you lots of Love and Hugs❤️
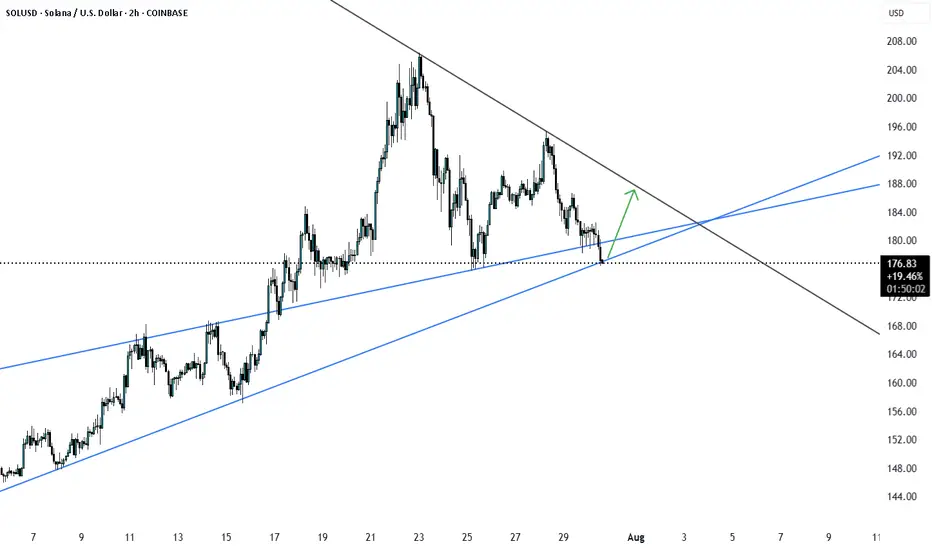
SOLUSD at Major support SOLUSD has reached major support from here we may see a good pullback. Let us see how it plays out.
Chainlink (LINKUSDT) has shown strong bullish momentumKey Points
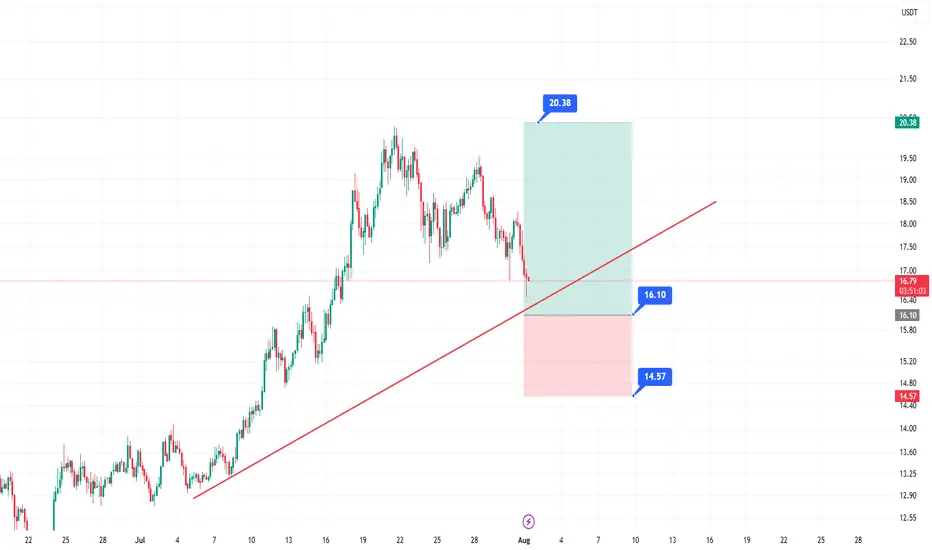
It seems likely that a long entry for LINKUSDT at $15.70–$16.10 using a limit order is a valid strategy, given recent bullish trends and technical support levels.
The take profit at $20.38 and stop loss at $14.57 suggest a favorable risk-reward ratio, but market volatility could affect outcomes.
Research suggests waiting for a pullback to the entry range, as the current price ($16.86) is slightly above it.
Market Context
Chainlink (LINKUSDT) has shown strong bullish momentum, rallying from $11.45 to $19.66 earlier in 2025, and is currently consolidating. The $15.70–$16.10 entry range aligns with key technical levels, including a 0.618 Fibonacci retracement and the 20-period EMA on the 4H chart, making it a potential support zone for a long entry.
Trade Plan
Entry: Use a limit order between $15.70 and $16.10, splitting entries for better average price.
Take Profit: Aim for $20.38, offering a significant upside potential.
Stop Loss: Set at $14.57 to manage risk, ensuring a clear invalidation level.
Risk Management: Risk 1–2% of your account, adjusting position size based on the stop distance.
Considerations
Given the current price is $16.86, you may need to wait for a pullback to enter at the desired range. Monitor Bitcoin’s price action, as it can influence altcoins like LINKUSDT. Always do your own research, as crypto markets are highly volatile.
Survey Note: Detailed Analysis of LINKUSDT Long Entry Strategy
This survey note provides a comprehensive analysis of the proposed LINKUSDT long entry strategy, incorporating your specified parameters (entry at $15.70–$16.10, take profit at $20.38, and stop loss at $14.57) and recent market data as of 09:31 AM +0530 on Friday, August 01, 2025. The goal is to create a detailed trading idea suitable for publishing on TradingView, with technical analysis, risk management, and community engagement considerations.
Market Overview and Recent Price Action
Chainlink (LINKUSDT) has demonstrated significant bullish momentum throughout 2025, breaking out of a multi-month descending channel and rallying from a low of $11.45 to a high of $19.66. As of today, the current price is $16.86 USD, based on the most reliable price data available. This price reflects a pullback from recent highs, suggesting a consolidation phase after a 58% rally, which is typical for healthy trend continuation.
Recent analyses on TradingView and X posts indicate a bullish outlook, with several traders targeting levels above $20, supported by strong fundamentals such as Chainlink’s role as a leading DeFi oracle. For instance, an X post from @cryptoolivee on July 29, 2025, suggested that if $17 holds, targets could reach $22.50–$30.60, while another from @Solfishsoul highlighted a descending wedge breakout with a potential target above $20, backed by RSI crossing 50 and volume spikes.
However, the current price of $16.86 is slightly above your proposed entry range of $15.70–$16.10, which may require waiting for a pullback or adjusting the strategy. Given Bitcoin’s price above $95,000, altcoin strength is supported, but monitor BTC dominance for potential impacts on LINKUSDT.
Technical Analysis
To justify the entry range and targets, let’s break down the technical setup:
Price Action and Structure:
On the 4H and 1D charts, LINKUSDT is forming higher highs and higher lows, confirming a bullish trend. The pullback to $15.70–$16.10 aligns with:
A 0.618 Fibonacci retracement level from the $11.45 low to $19.66 high, a common reversal zone.
A previous resistance-turned-support zone around $16.00, based on historical price action.
The 20-period EMA on the 4H chart, acting as dynamic support, which recent analyses on TradingView confirm as a key level.
Key Levels:
Support Zone: $15.70–$16.10, with stacked confluence from Fib, prior structure, and EMA.
Resistance Targets:
T1: $17.50 (recent consolidation low, +9% from entry).
T2: $19.80 (prior high, +23% from entry).
T3: $21.00 (channel breakout target, +31% from entry).
Your specified take profit at $20.38 fits within this bullish range, offering a significant upside potential.
Invalidation: A 4H close below $15.20 signals a potential trend reversal, but your stop loss at $14.57 provides a wider buffer, which is prudent given crypto volatility.
Indicators:
RSI (4H): Currently at 58, indicating bullish momentum without being overbought, with room for upside before reaching 70.
Volume: Recent breakouts ($15–$17 and $19) showed increasing volume, suggesting strong buying interest. The current pullback shows lower volume, typical of a healthy retracement, as noted in TradingView analyses.
MACD (4H): Bullish crossover intact, with the histogram showing slight weakening but no bearish divergence, supporting the setup.
Market Context and Sentiment:
TradingView’s technical ratings as of today show a neutral signal, but a buy signal for 1 week and a strong buy for 1 month, aligning with the bullish sentiment. Volatility is 3.28% today, with a 24-hour change of -0.11%, -2.70% for 1 week, but +32.31% for 1 month and +32.37% for 1 year, indicating strong longer-term momentum.
X posts, such as one from @Arvintd on July 25, 2025, suggest long entries at $17.150–$17.600 with targets up to $19.650, slightly above your range but supportive of bullish moves. Another from @2gentledude echoed similar levels, using 50x leverage, though caution is advised for such high leverage.
Trade Plan and Execution
Given your parameters, here’s how to structure the trade for TradingView publication:
Setup: Long LINKUSDT with a limit order in the $15.70–$16.10 range.
Entry Zone: Place limit orders between $15.70 and $16.10, splitting entries for better average price to manage slippage.
Take Profit Targets:
Your specified TP at $20.38 can be the primary target, offering a significant upside. For scaling, consider:
T1: $17.50 (50% position, R:R 2.5:1).
T2: $19.80 (30% position, R:R 5:1).
T3: $21.00 (20% position, R:R 6.5:1), given the bullish targets in analyses.
Stop Loss: Set at $14.57, as specified, which is below the $15.20 invalidation level, providing a wider buffer for volatility.
Risk Management:
Risk 1–2% of your account per trade, adjusting position size based on the stop distance (from $15.90 average entry to $14.57 SL, ~8.5% risk, so size accordingly).
Use spot or low leverage (3–5x) to manage risk, as futures trading amplifies losses, especially given recent X posts suggesting 50x leverage, which is high risk.
Trade Duration: Expected 3–10 days, depending on momentum and BTC price action.
Execution Notes:
Wait for price to enter the $15.70–$16.10 zone and show bullish confirmation, such as a 1H bullish candle, RSI bounce, or volume increase, to ensure entry at support.
Avoid chasing if price breaks above $16.50 without testing the entry zone, as it may indicate a stronger upward move bypassing your range.
Risk Assessment and Considerations
Crypto markets are highly volatile, and several factors could impact this setup:
A Bitcoin drop could drag LINK below $15.20, potentially hitting your SL at $14.57. Monitor BTC dominance and LINK/BTC pair for correlations.
False breakouts are possible; if $15.70 fails to hold, price may test lower supports like $14.00–$14.20, as noted in some TradingView analyses.
Given the current price of $16.86, you may need to wait for a pullback, which could take time or not occur, adding uncertainty. Adjust expectations if the market continues upward.
Community Engagement and Publishing Notes
To maximize engagement on TradingView:
Chart Setup: Attach a 4H or 1D chart with:
Marked entry zone ($15.70–$16.10).
Fibonacci retracement levels (0.618 at ~$16.00).
20 EMA on 4H.
Support/resistance zones ($17.50, $19.80, $21.00).
Stop loss level ($14.57, as specified).
Tags: #LINKUSDT #Chainlink #CryptoTrading #BullishSetup #TechnicalAnalysis #Altcoins
Visibility: Set to public for maximum reach.
Engagement: Encourage comments, such as “What’s your take on LINKUSDT? Are you bullish or waiting for a deeper dip? Drop a comment below, and let’s discuss!” and respond to feedback to build credibility.
Summary Table of Key Levels and Targets
Level/Type
Price (USD)
Description
Entry Range
15.70–16.10
Limit order zone, Fib and EMA support
Take Profit (TP)
20.38
Primary target, aligns with bullish targets
Stop Loss (SL)
14.57
Wide buffer below invalidation at $15.20
Support Levels
14.00–14.20
Potential lower test if entry fails
Resistance Targets
17.50, 19.80, 21.00
Scaling targets for partial profits
This table summarizes the critical levels for your trade, ensuring clarity for TradingView readers.
Disclaimer and Final Notes
Trading cryptocurrencies involves high risk, and you may lose more than your initial capital. Always use proper risk management and consult your financial advisor before trading. This idea is based on available data and analyses but is not financial advice—do your own research (DYOR).
Given the current price of $16.86, this setup may require patience for a pullback, but the technical confluence and bullish sentiment support its validity. Adjust as needed based on market developments.
Key Citations
Chainlink/Tether Price Chart Analysis
Recent LINKUSDT Trade Ideas
Chainlink Price and Chart Data
LINKUSDT Trading Idea from Arvintd
LINKUSDT Monthly Analysis from cryptoolivee
LINKUSDT Breakout Analysis from Solfishsoul
LINKUSDT Long Idea from 2gentledude
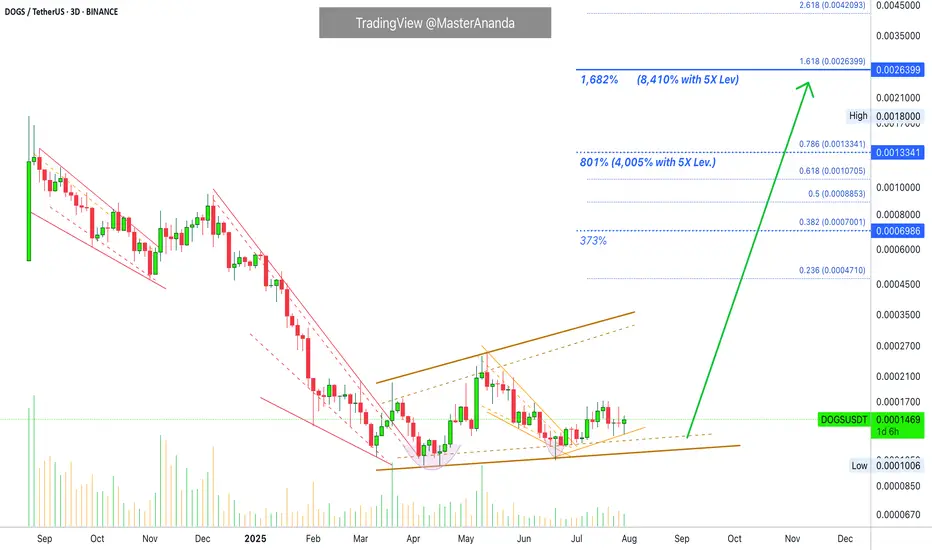
Dogs 5X Leveraged Trade-Setup (8,410% Profits Potential)Dogs continues to consolidation at bottom prices producing higher lows. With each passing day/session and candle, DOGSUSDT gets closer and closer to a strong bullish breakout. If you remember recently this pair produced for us more than 800% profits with 7X, the entire move was about 150% strong, between April and May. The move that will develop now will be many times stronger. With a leveraged position we can easily aim for 300-500% profits. So 5X lev. can easily do 1,500 to 2,500%. But this is only the start, the move that is developing now is a major advance, bull market type of situation, and this can result in more than 1,000% growth for Dogs and many other altcoins. This can mean really high profits with leverage.
Leverage increases the risk of default and makes the game that much more complex, so you should avoid it if you want peace of mind. If you don't mind the extra risk and stress, you can go for the higher profits. Timing right now is great.
Once or twice per year only we get this major positive entry, high probability entry. It doesn't happen often. Only once in a while the market forms a clear bottom, a support zone, and from this bottom a new bullish impulse is launched. Only once every several years, the time is now.
This is a strong chart setup. Dogs has been sideways now for a full six months. Six months sideways is the perfect time duration for a 1,000% bullish jump. Give or take 5X, we are looking at 5,000% potential for growth.
Patience is key. The market will bless us with endless opportunities like this. I will show you another one right away.
Thank you for reading.
Namaste.
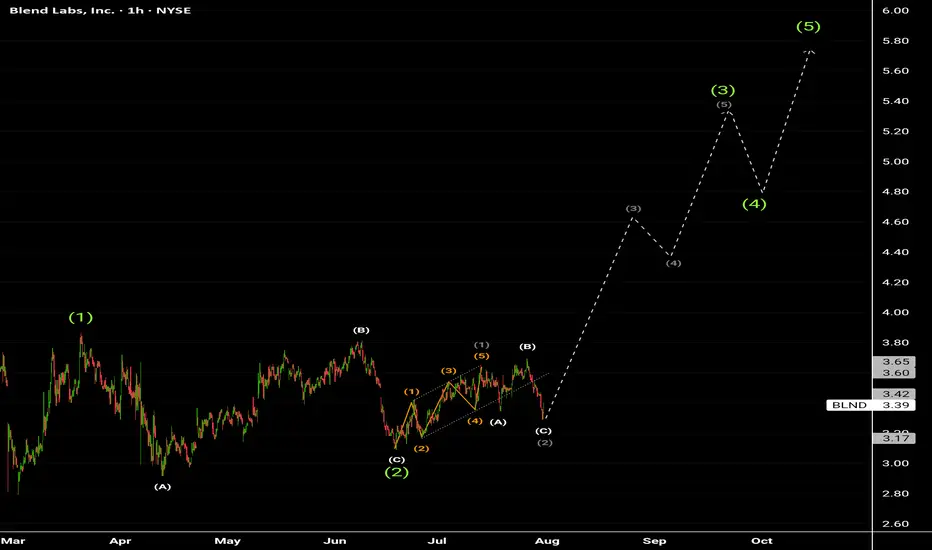
Blend labs inc. w1 completed of W3 , Rally expected to start to almost 4.60$ and above .
Target price 5.35$ and above shortly. 💥
It seems to me a great Earnings coming in August.
Highly recommended for Buying Now from present level.
Buy it ASAP 💣.
USDCHF--Short--short term bearish possibility
--strong reaction from monthly resistance around 0.8180
-- lets look at two case. CASE1)Tendency is bearsih. then price will fall. CASE-2) Tendency is bullish.Even if the price will rise later, first it will pullback to 0.7978 level then rise.

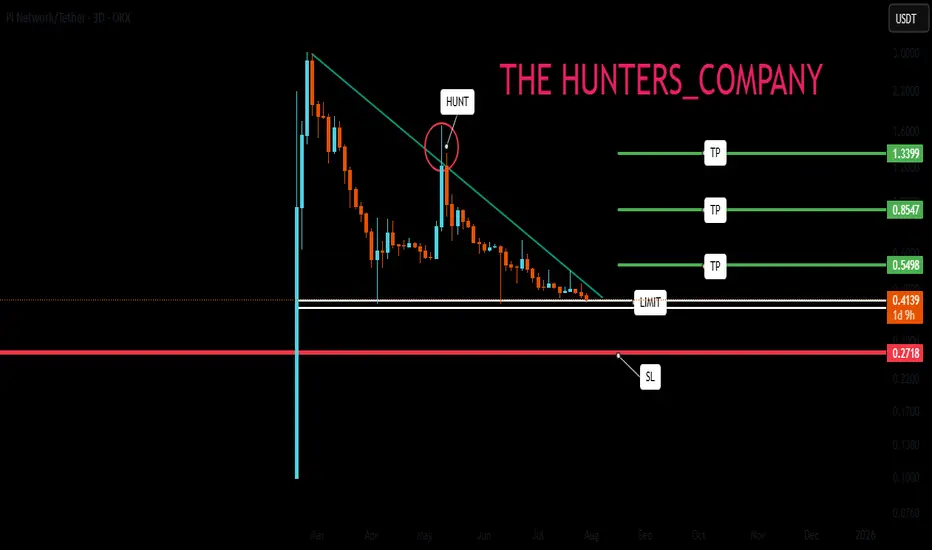
PI NETWORK : Will it finally be pumped?Hello friends🙌
👀According to the decline we had, you can see that the price has reached an important area and has formed a floor in this area. Considering the classic ego that is forming on support, you can enter the trade by breaking the resistance, of course, by managing risk and capital and moving with it to the specified goals.
🔥Follow us for more signals🔥
*Trade safely with us*
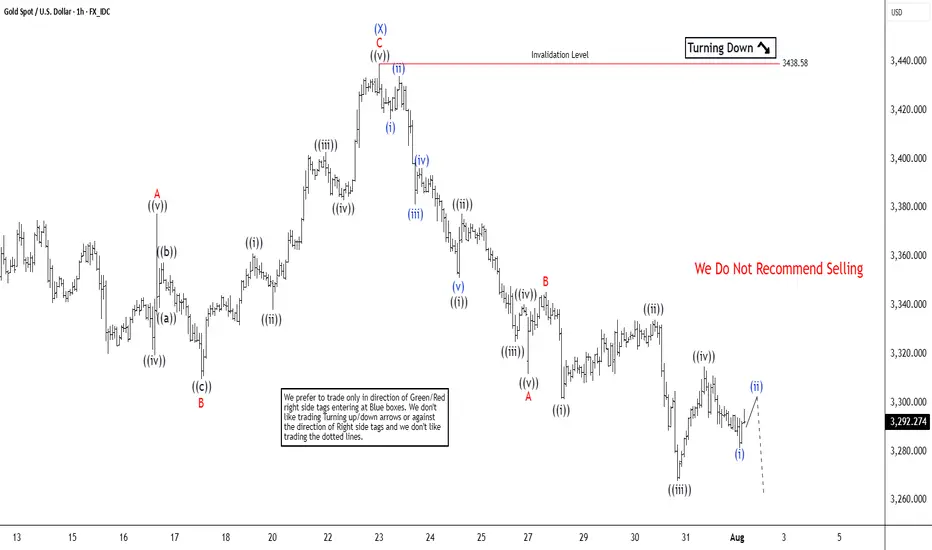
Elliott Wave Analysis Points to Gold (XAUUSD) Support Near 3320Gold (XAUUSD) appears poised for a double correction from its 16 June 2025 high. A double three consists of two corrective patterns, typically zigzags. From the June peak, wave (W) concluded at 3246.55, and wave (X) rallied to 3438.58, as shown on the 1-hour chart. Wave (Y) is now unfolding lower with internal subdivision as a zigzag. From wave (X), wave ((i)) ended at 3351.17, and wave ((ii)) peaked at 3377.45. Wave ((iii)) declined to 3324.80, followed by a wave ((iv)) rally to 3340.34. The final wave ((v)) completed at 3311.62, forming wave A in a higher degree. A corrective wave B rally reached 3345.35 before gold resumed its downward move.
Within wave C, wave ((i)) finished at 3301.47, and wave ((ii)) rallied to 3334.08. Wave ((iii)) dropped to 3267.94, with wave ((iv)) ending at 3314.85. Gold should continue lower in wave ((v)) to complete wave C. The potential target lies within the 100%–161.8% Fibonacci extension from the 16 June high. This projects a support zone between 3104 and 3230, where a three-wave rally is anticipated. Traders should monitor this area for potential reversal signals, as it may offer support for a corrective bounce.
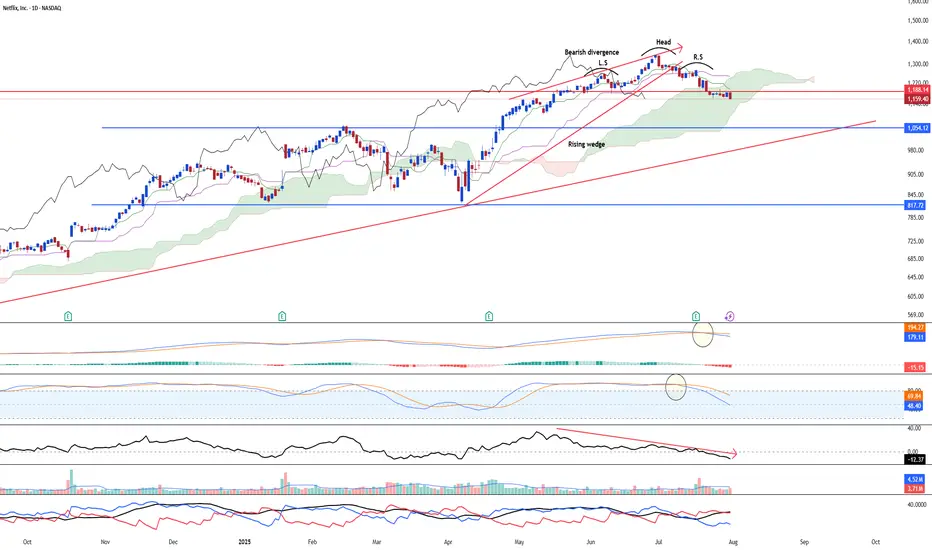
Turning the side for NetflixNetflix NASDAQ:NFLX may go through some serious correction soon after the stock rallied a lot till the high of 1337. Furthermore, the stock has confirmed the head and shoulder reversal with the latest bearish candle rejecting the neckline resistance @ 1188.14. Furthermore, the bearish divergence has been on since 19 May 2025.
Long-term MACD has performed a bearish crossover at the top and histogram is negative.
Stochastic Oscillator has confirmed the overbought signal.
23-period ROC turns negative and forms a bearish divergence. Directional movement index saw increased bearish trend strength signal.
Target is at 1054 in the near-term
BTC Short Update Hello ❤️
Bitcoin
Let's have an update on Bitcoin analysis
💁♂️ First Target 🔥
Near Second Target
According to the analysis I posted on the page, Bitcoin touched the first target and is now near the second target
It is a good place to save profits. The price gap is filled
Please don't forget to like, share, and boost so that I can analyze it for you with more enthusiasm. Thank you. 💖😍
$BTC Is Bullish: Bull Flag + Liquidity sweep + RSI DivI see higher targets for bitcoin. right now Bitcoin is forming a bullish flag, two times it has targeted short stops, and on the 4H timeframe we also have an RSI divergence.

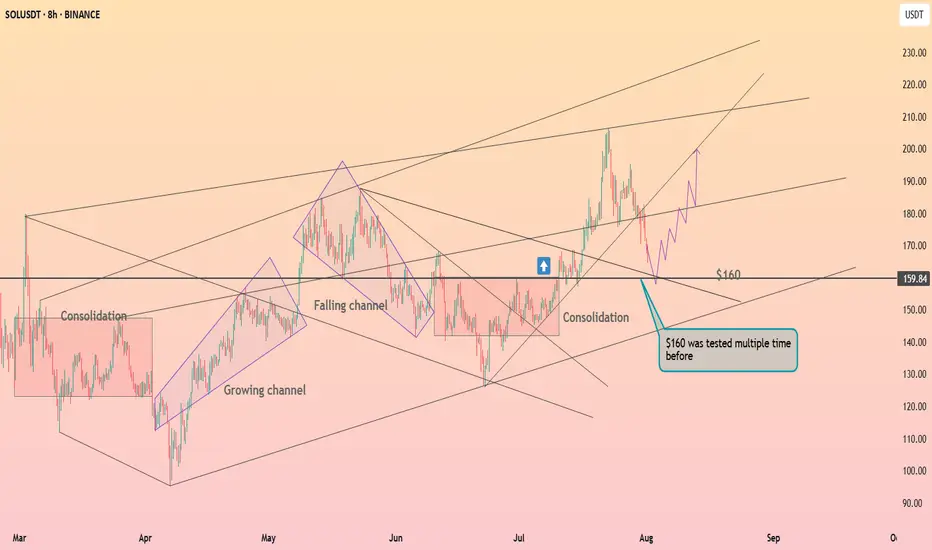
Solana above the $160 level ┆ HolderStatBINANCE:SOLUSDT is retracing toward the $160 support after failing to hold above $190. Price previously broke out from a falling channel and may find support at $160 again, where multiple reversals have occurred. A bounce here could fuel a move to $200.
GBPUSD--LONG--02-08-25--Bouncing up from monthly support around1.31425 (black horizantal line),price at least move higher to the monthly resistance around 1.33822(black horizantal line)
--best entry level is between 1.325 and 1.328

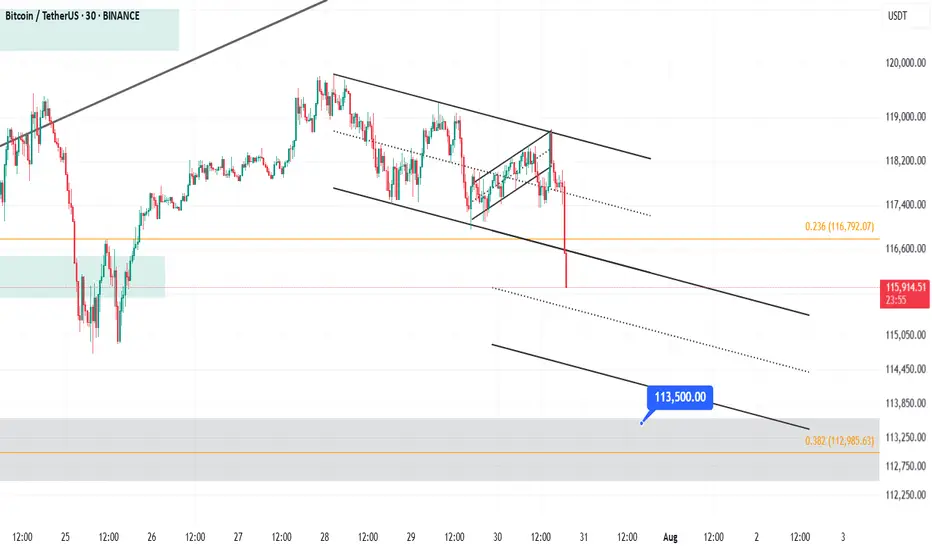
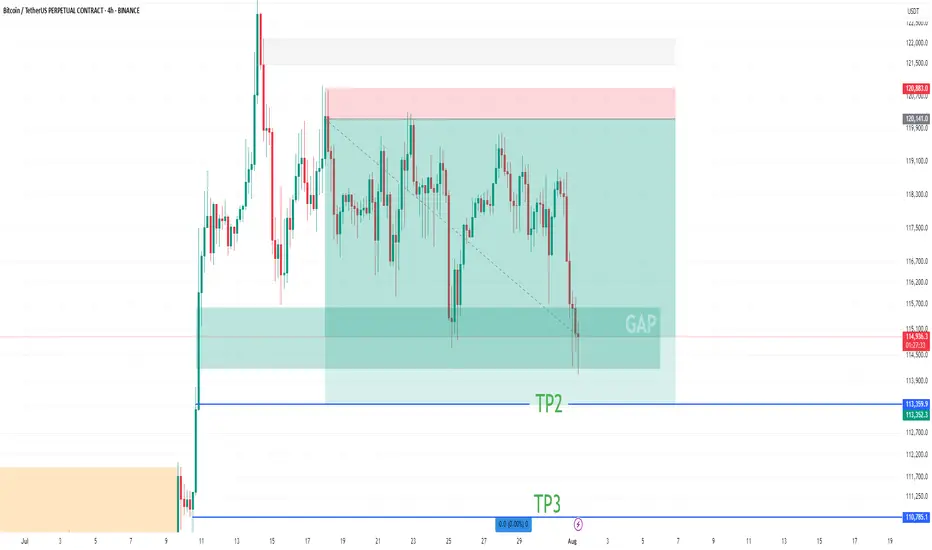
Quick Bitcoin Analysis – 30-Minute TimeframeQuick Hey friends 👋
Bitcoin was recently moving inside a weak upward channel on the 30-minute chart. But now, it has broken below the channel with a strong bearish candle. This suggests we’re entering a short-term correction.
🔹 However, don’t forget — the overall trend is still bullish.
This drop looks more like a healthy pullback, not the start of a full downtrend.
🎯 Possible Targets for This Correction:
✅ Target 1: Around $114,500
(This comes from measuring the width of the broken channel.)
✅ Target 2: Strong support near $113,500
(This level has shown solid buyer interest in the past.)
📊 The RSI is also approaching the oversold zone, which means we might see a small bounce or slowdown in the drop soon.
📌 In short:
This is likely just a dip in a bigger uptrend. Be patient, watch key support zones, and don’t rush into trades.
Always stick to proper risk management! 💼
Bitcoin Analysis – 30-Minute Timeframe