Classic Liquidity Trap on TRX -TRXUSDT-4HPrice hunted buy-side liquidity with a sharp fakeout move, trapping breakout traders.
After breaking structure (BOS) and forming internal liquidity, the short setup was confirmed.
Entry placed on the mitigation of the order block with clear risk defined above the fakeout.
Targeting sell-side liquidity for maximum R:R. Clean and calculated.
Chart Patterns

#BTC Potential Trading Opportunities📊#BTC Potential Trading Opportunities🔥
🧠We've been trading sideways for quite some time, and selling pressure has largely been exhausted, so we need to find support to enter a long trade.
➡️From a structural perspective, there's a chance for a bullish head-and-shoulders pattern to form. If this pattern holds, we could see a move above $120,000 or even higher.
Potential support is likely between $116,300 and $117,000.
Short-term resistance is around $120,000.
⚠️Note: A break below L1 would destabilize the structure and significantly reduce bullish expectations.
🤜If you like my analysis, please like 💖 and share 💬 BITGET:BTCUSDT.P

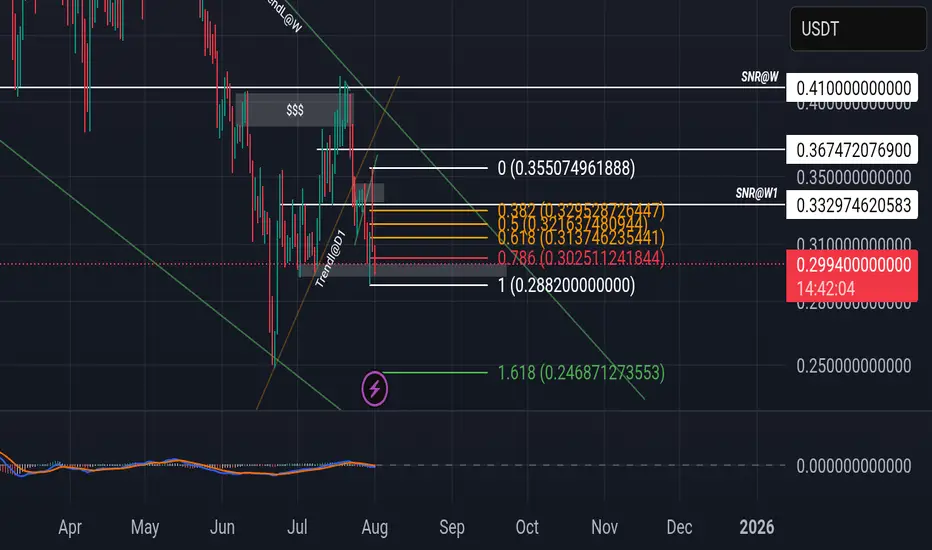
Sonic is creating wedge pattern in higher timeframeOn our current market structure, sonic is creating wedge bullish pattern.
If you check the current price using Fibonacci there's a possibility that it will goes to 0.24 or worst 0.1552 before it will break its current weekly structure.
You can accumulate within the pattern but if you're planning to make position and do long...please avoid that.
Point of interest is 0.24 to make create double bottom on it. If it's break, 0.1552.
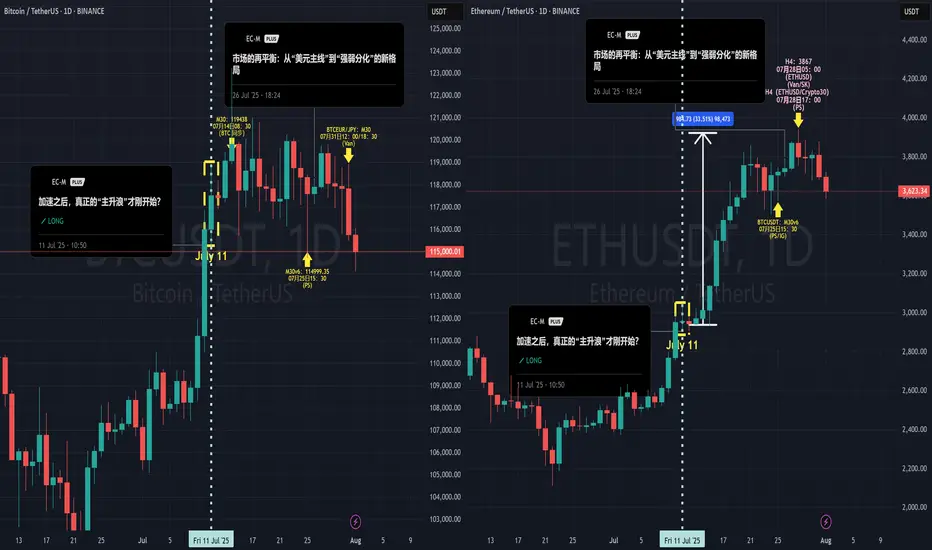
The Curtain Falls on the Script: Why I Believe It's Time to StopHello everyone, this is EC.
From late June through July, we experienced a full-fledged primary uptrend in crypto, driven by a weakening U.S. Dollar. From the script preview to the execution of the plan, every step has been clearly documented.
However, today, I want to share a different, more cautious perspective: I believe this script may be nearing its end.
I. Reviewing the Script and the "Bubble's" Manifestation
After our call on July 4th that the "main bull wave" was starting, the market perfectly delivered on our expectations. What was more interesting was the clear internal divergence we saw, which precisely confirms our thesis about the "bubble phase" from my June 20th article, "The Restlessness Before the Storm."
When the market's sentiment "balloon" is inflated to its limit, capital flows from the leader (BTC) to assets with higher elasticity (ETH).
The data shows that from July 11th until now, ETH took the baton and rallied approximately 35%, while BTC gained only around 6% in the same period. When BTC is already showing signs of fatigue while ETH is still in a solo rally, that in itself is a major signal that the bubble is nearing its end.
II. A Shift in the Winds: The Hand Inflating the Balloon is Loosening
I've chosen to end this script at this moment based on signal changes on two levels:
The "External Factor" Shift: The Potential Strengthening of the USD
As I pointed out in my July 28th analysis, "The Market's Rebalancing," the market has entered a phase of "strength-weakness divergence." This trend is now becoming more evident: the U.S. Dollar, cushioned by the extreme weakness of currencies like the Japanese Yen, has begun to show signs of a broad strengthening. Concurrently, U.S. and European stock markets are pulling back in sync, and global risk appetite is cooling.
The external environment that fueled the bubble (a weak USD) is beginning to falter.
The "Internal Factor" Signal: The Needle Point Inside the Balloon
The crypto market itself is also showing warning signs of resistance (see attached ETH daily chart). When the leading asset, ETH, begins to show signs of stagnation and distribution at its highs, it's like the balloon meeting the needle point. The exhaustion of internal momentum is a more direct warning than changes in the external environment.
III. Conclusion: Don't Be Greedy for the Last Dessert
When the core logic driving the rally (a weak USD) begins to waver, and the market simultaneously shows internal signs of exhaustion, my choice is to end this script and take profits off the table.
This doesn't mean I think crypto will crash immediately. But "no longer suitable to hold" implies that, in my view, the risk/reward ratio at the current level is no longer attractive. A grand feast is coming to an end, and being greedy for the last dessert is not a wise move. Shifting from "buying the dip" to "cautious observation" is the rational choice.
Thank you for your attention and for following along this past month.
#Crypto #BTC #ETH #TradingView #MarketAnalysis #RiskManagement
NASDAQ LONG NOWDaily break of structure provided me a view of the daily support at 22,960.
My entry is also supported by the 50-MA at the left chart. Im targeting 23,800 with 1:6 risk reward.

Toncoin Goes Bullish · 4X Leverage · Bottom Prices · OpportunityToncoin is breaking the sideways consolidation pattern. Today we have the highest price since late May, already two months ago, and rising volume. When you see how flat the action at the bottom is, you can tell how strong the bullish breakout that follows will me.
This is a friendly reminder because Toncoin will be huge in this altcoins market bullish cycle. I want you want you to be in, I want you to collect big projects, 1,000%+. That is why I am reminding you now. This trade setup can be approached both with leverage and spot, both options will do great.
After years of bearish action and months of consolidation, Toncoin is ready and the recovery is happening slowly but surely. Prices are rising slowly, no new lows. Prices are moving sideways but knowing the bottom is in the only logical conclusion is a break up. It is on the chart. It is inevitable, it is confirmed; profits and success.
Timing is really essential when trading. If you can get the right entry timing, a great price, trading becomes easy long-term. Once the bullish move shows up, you will be happy sitting in a strong position that only grows. That is because you bought the bottom. We are still looking at bottom prices, the last chance at the "opportunity buy zone."
We are doing 4X but we have positions with higher leverage from where prices were lower. You need to decide your own risk tolerance. If in doubt, zero leverage please. Only when you are 100% certain and you accept the full risk. The full risk is the liquidation of your position, all money gone. Are you ready to lose everything? If you are, better start trading spot. The chances of losing are very low. If prices drop, you get to pick a small paper loss and nothing more. Your number of altcoins stay the same. When the market starts to move, your money grows and the paper loss turns into a gain. You can't lose if you don't sell when prices are down. Buy when prices are low. Hold strong through the bullish wave. The time to buy is now. Buy and hold. You will be happy with the results.
Namaste.

Ethereum Quick Outlook – Potential Trap Before Drop?ETH is moving within a rising channel, but momentum is fading. Price failed to break above the midline and is now testing lower support.
A fakeout to the upside toward the $4,015–$4,050 supply zone is possible before a deeper drop. The projected path suggests a short-term bounce, final liquidity sweep, then potential reversal.
🟡 Key Resistance: $4,015
🔻 Breakdown trigger: Below $3,620
🎯 Bearish Targets: $3,250 → $3,100
Structure hints at a possible Ending Diagonal (Neowave), or a Trap-Wave E inside a Complex Correction.
⚠️ Watch for manipulation near highs – confirmation needed for short entry.

Close out the Week STRONGLooks like price has found its bottom and is ready to push from here. We are looking for a strong forceful break out from this zone so we can go for the higher levels. Everything looks right from here and value keeps shifting up. I know we should get a solid entry but waiting for it to line up with time.

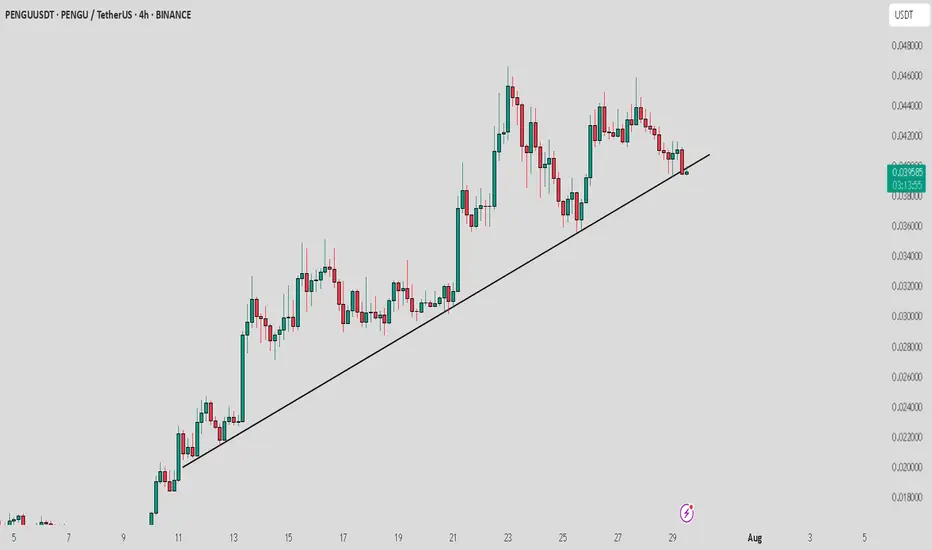
PENGU / USDT : Breaking down from Trendline supportPENGU/USDT is breaking down from the trend line support, but the retest is still in progress. Watch for rejection at key levels.
Pro Tip: Wait for confirmation of rejection before entering the trade and always apply proper risk management to safeguard your position.
GBPJPY pullback for another bullish moveDaily candle closed with strong bullish.
A healthy pullback observed during Asian session.
I'm waiting at marking area for buy entry.
Calculate your own risk & reward.
Good Luck

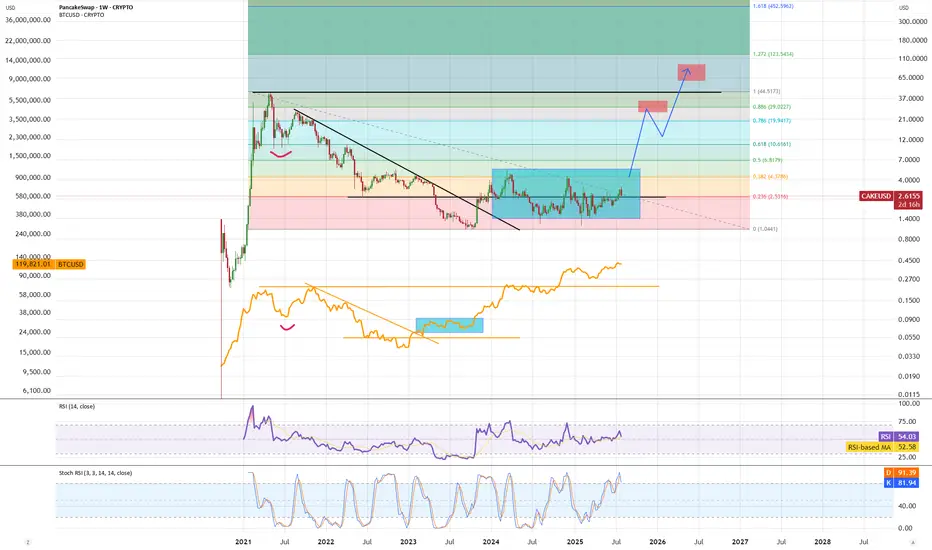
CAKE - positive signs for move upCAKE is still in accumulation range. When looking at pattern we see similarities with BTC where CAKE has completed 1st impulse from the bottom and as long as we stay above fibb 0.236 S range we are ready for next impulse moving price higher, going for test of fibb 0.886 range where a bit of consolidation and then wick to new ATH to complete bigger impulse up.
BITCOIN SENDS CLEAR BULLISH SIGNALS|LONG
BITCOIN SIGNAL
Trade Direction: long
Entry Level: 114,912.19
Target Level: 117,003.95
Stop Loss: 113,517.68
RISK PROFILE
Risk level: medium
Suggested risk: 1%
Timeframe: 2h
Disclosure: I am part of Trade Nation's Influencer program and receive a monthly fee for using their TradingView charts in my analysis.
✅LIKE AND COMMENT MY IDEAS✅

BTCUSD long my predict up to 128100
long possible entry 115150
take profit 128100
stop loss 113000
swing long

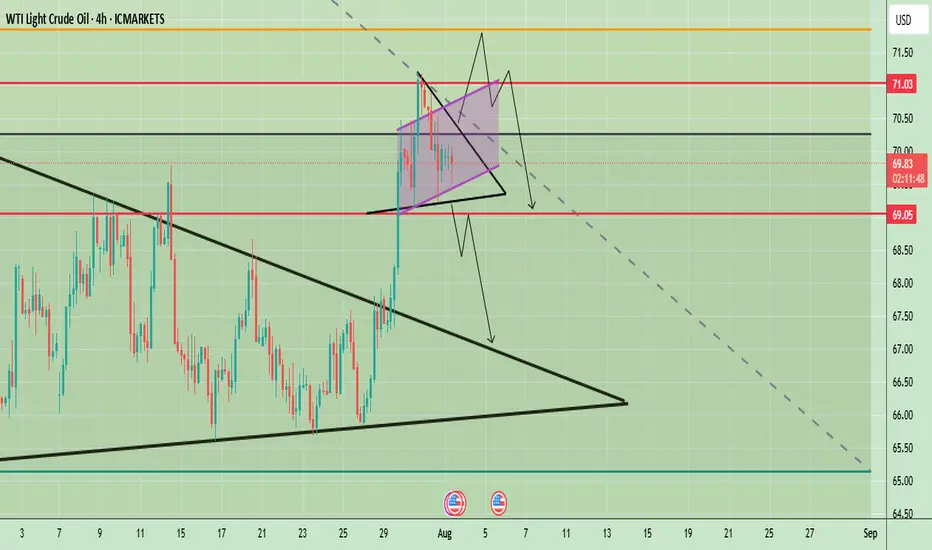
WTI Crude Oil Technical Outlook – Key Breakout or BreakdownWTI Crude Oil 4-hour chart suggests a potential inflection point after a strong bullish breakout from a larger symmetrical triangle pattern in late July. The price surged past key resistance levels and is now consolidating in a smaller symmetrical triangle formation just below the psychological $70 mark. This indicates a phase of indecision following a strong move, with market participants awaiting further confirmation.
Price is currently hovering around $69.82, with key levels marked at $71.03 (resistance) and $69.05 (support). The short-term price action within the tight triangle could determine the next move, with both bullish continuation and bearish reversal scenarios on the table.
Prices remain supported by supply concerns after Trump threatened to impose 100% secondary tariffs on buyers of Russian crude and warned China, a major oil consumer of severe penalties if it continues its purchases of Russian oil.
🔍 Potential Scenarios
- Bullish Breakout Scenario
If price breaks out of the smaller symmetrical triangle to the upside and clears the $70 resistance level with strong momentum, it may quickly test the $71.03 zone. A clean break above $71.03 would confirm the continuation of the previous uptrend, potentially opening room toward $72.50 and beyond in the medium term. The pattern would resemble a bullish pennant — a continuation pattern following the late July rally.
-Bearish Rejection and Breakdown
Conversely, a failure to sustain above $70 followed by a break below the lower boundary of the smaller triangle could lead to a sharper decline. The first critical level to watch would be $69.05; a break below this would likely invalidate the bullish setup and initiate a retest of the previously broken upper trendline of the larger triangle near $67.50. A further breakdown could lead price towards the larger support zone around $65–$66.
📈 Trend Outlook
- Short-Term: Neutral to Bullish — Consolidation in a smaller symmetrical triangle suggests a pause before continuation. However, the structure is still technically bullish unless $69.05 is broken.
- Medium-Term: Bullish Bias — The breakout from the large symmetrical triangle in late July indicates a shift in market sentiment, favoring higher prices unless the price fails to hold above $67.50.
- Long-Term: Cautiously Bullish — As long as WTI holds above the $65–$66 structural support area, the longer-term outlook remains constructive.
Note
Please risk management in trading is a Key so use your money accordingly. If you like the idea then please like and boost. Thank you and Good Luck!
USOIL WTIWest Texas Intermediate (WTI) oil is a major benchmark for crude oil pricing, known for its high quality—being both light and sweet due to its low sulfur content and low density. WTI is sourced primarily from inland Texas and is the underlying commodity for oil futures traded on the New York Mercantile Exchange (NYMEX). The main physical delivery point is Cushing, Oklahoma, a critical U.S. oil storage and trading hub.
Current Price (as of August 1, 2025)
WTI crude oil is trading around $69.15–$69.36 per barrel.
Recently, WTI prices have seen volatility due to global economic factors, including U.S. tariffs, OPEC+ production, and shifts in oil demand. Despite a small decline on the day, oil prices have posted their strongest weekly performance since June, rising over 6% for the week.
Market and Outlook
Recent price movement reflects concerns about global trade tensions, new tariffs, and their impact on economic growth and energy demand. At the same time, supply risks remain due to geopolitical factors such as potential sanctions on Russian oil and U.S.-China trade developments.
Analyst forecasts for the remainder of 2025 suggest continued volatility, with WTI potentially ranging between $56 and $73 per barrel, influenced by demand, OPEC+ decisions, and geopolitical events.
Quick Facts Table
Feature Detail
Type Light, sweet crude
Benchmark NYMEX (U.S.), major global reference
Main Delivery Point Cushing, Oklahoma
Latest Price (Aug 1, 2025) $69.15–$69.36 per barrel
Typical Drivers U.S. tariffs, OPEC+ decisions, trade policy, supply risks, global demand
WTI oil plays a central role in global energy markets, serving as a benchmark for North American and international oil pricing. Its price reflects both supply fundamentals and broader macroeconomic and geopolitical developments.
#OIL #WTI

USOIL REACHED THE 6,900.00 SUPPORT LEVEL. WHAT'S NEXT?USOIL REACHED THE 6,900.00 SUPPORT LEVEL. WHAT'S NEXT?
As we told July 31, the price got reversed towards first support level of 6,900.00. Market participants are waiting for the OPEC+ meeting this week, expecting a significant output hike. Currently, the price sits slightly above the support level. Although, the asset trades above this level, considering the current weakness of the asset, further decline is expected. The 6,800.00 support level is the next target here.

TRXUSDT Short Trade - Price CorrectionsBINANCE:TRXUSDT Short Day Trade - Low Risk, with my back testing of this strategy, it hits multiple possible take profits, manage your position accordingly.
Note: Manage your risk yourself, its risky trade, see how much your can risk yourself on this trade.
Use proper risk management
Looks like good trade.
Lets monitor.
Use proper risk management.
Disclaimer: only idea, not advice

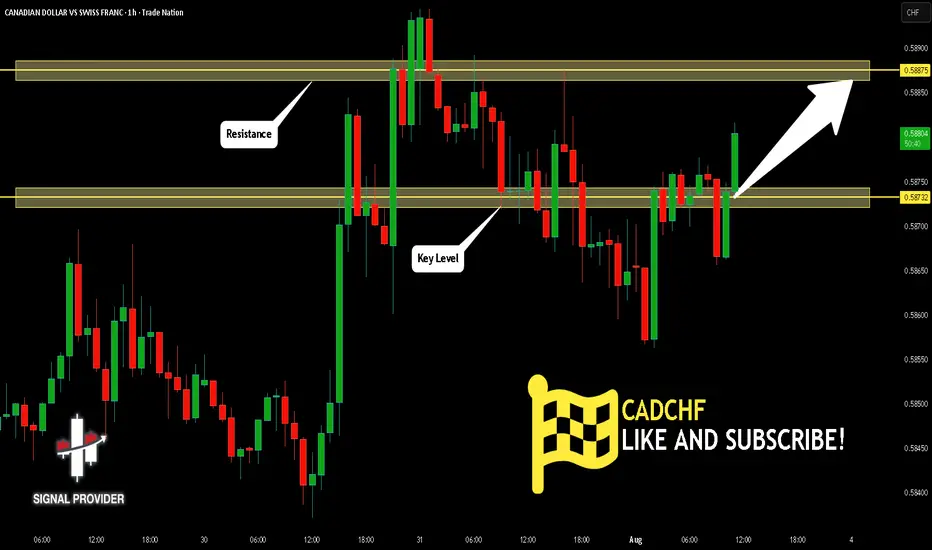
CADCHF Will Grow! Long!
Please, check our technical outlook for CADCHF.
Time Frame: 1h
Current Trend: Bullish
Sentiment: Oversold (based on 7-period RSI)
Forecast: Bullish
The market is trading around a solid horizontal structure 0.587.
The above observations make me that the market will inevitably achieve 0.588 level.
P.S
Please, note that an oversold/overbought condition can last for a long time, and therefore being oversold/overbought doesn't mean a price rally will come soon, or at all.
Disclosure: I am part of Trade Nation's Influencer program and receive a monthly fee for using their TradingView charts in my analysis.
Like and subscribe and comment my ideas if you enjoy them!
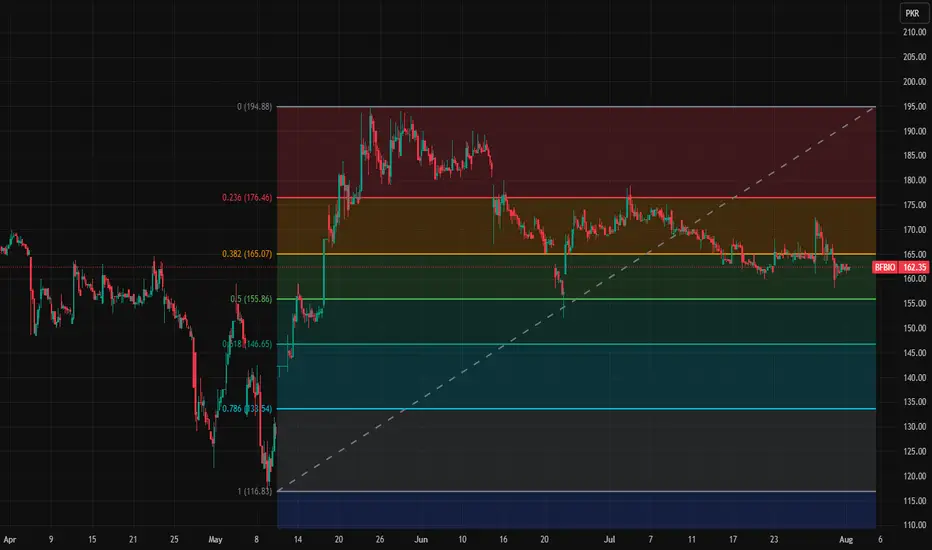
BLACKBERRY BBBREAKOUT OF DESCENDING TRENDLINE COULD SEE 22$-24$
BlackBerry today is a Canadian technology company specializing in cybersecurity software and Internet of Things (IoT) services for enterprises and governments worldwide. Formerly renowned as a mobile device manufacturer, BlackBerry Limited (formerly Research In Motion, RIM) exited the smartphone business in 2016 and now focuses on secure communications, endpoint management, and embedded systems, especially for industries like automotive, healthcare, and government.
Company Profile & Business
Headquarters: Waterloo, Ontario, Canada
Core products: Cybersecurity solutions, BlackBerry Unified Endpoint Management (UEM), QNX operating systems, secure messaging (BlackBerry Messenger Enterprise, BBMe), and automotive software platforms.
Global presence: Products and services are sold worldwide across the Americas, Europe, Middle East, Africa, and Asia-Pacific.
Recent Financials & Stock
Stock ticker: NYSE/TSX: BB
Recent price: As of July 30, 2025, BlackBerry closed at $3.74 per share, reflecting a decline from earlier in the month. Price targets for the company now range from $2.71 to $4.75, with analysts citing positive revenue growth and the company's first positive cash flow in three years after its recent quarterly results.
Business momentum: The company recently posted about 10% higher revenue compared to forecasts for the third quarter fiscal year 2025, with a shift to positive earnings and cash flow—highlighting improvements in its cybersecurity and IoT software businesses.
Notable News & Developments
End of smartphones: BlackBerry-branded mobile devices are officially discontinued. The company fully exited the hardware business by 2018 and stopped supporting BlackBerry 10 in 2022.
Nostalgia revival: In 2025, a separate company (Zinwa Technologies) is reviving classic BlackBerry devices (like the BlackBerry Classic and Passport) by retrofitting them with modern Android internals. These are not officially affiliated with BlackBerry Limited, but appeal to enthusiasts for the classic design and QWERTY keyboard, albeit with privacy caveats due to non-BlackBerry software.
Enterprise focus: BlackBerry remains a leader in secure software for businesses, including automotive OS (QNX), endpoint security, and secure messaging. Major clients include automotive OEMs, financial corporations, and government agencies.
Quick Facts Table
Aspect Details
Industry Cybersecurity, IoT software, enterprise services
Founded 1984 (as Research In Motion, Canada)
Consumer Phones Discontinued; brand revived unofficially by others
Current Stock Price $3.74 (July 30, 2025)
Latest Product Focus Automotive software, secure endpoint management
BlackBerry is no longer a phone maker, but remains a significant player in secure enterprise and automotive software, with stock prices and business outlook reflecting its transition into these fields.
Zinwa Technologies is a Chinese technology company that has gained attention in 2025 for its project to revive classic BlackBerry smartphones, specifically the BlackBerry Classic (also known as the Q20), under its own branding. Unlike BlackBerry Limited (which no longer makes hardware), Zinwa has purchased batches of old BlackBerry Q20 devices—both new-old-stock and used units from supply chains in Hong Kong—and is refurbishing them with entirely new internal components while retaining the iconic design features such as the physical QWERTY keyboard and 720x720 touchscreen.
Key Details on Zinwa Technologies’ BlackBerry Revival:
Project Name/Models: The updated phone is called the Zinwa Q25 (2025 is referenced in the model name). Zinwa is also planning to modernize other BlackBerry devices, including the KEYone (“K25”) and the Passport (“P25” or “P26”).
What’s Modernized?: The original shell, keyboard, notification LED, and display remain, but Zinwa installs a new motherboard with a MediaTek Helio G99 processor, 12GB RAM, 256GB storage (expandable), a 50MP rear camera, 8MP front camera, a new 3,000mAh battery, and global 4G LTE support. There is a USB-C port, headphone jack, microSD support, and the phone runs Android 13 (with no confirmed plans for updates to later Android versions).
How It’s Sold: Two options are offered—a fully assembled Zinwa Q25 smartphone for $400, or a $300 conversion kit for those who already own a BlackBerry Classic and want to upgrade themselves. Both are expected to ship in August 2025.
Nostalgia Meets Modern Tech: The initiative targets fans of physical keyboards and retro gadgets as well as a new wave of Gen Z users seeking “digital detox” devices. The device is positioned as a niche product for enthusiasts rather than a mass-market flagship.
No Connection to BlackBerry Limited: Zinwa Technologies has not acquired the BlackBerry brand or company; its project is independent and relies on recycling and upgrading old BlackBerry hardware.
Future Plans: Zinwa has stated it may refresh additional BlackBerry models based on demand and feedback, following the Q25 release.
In sum, Zinwa Technologies is bringing back the BlackBerry Classic as a refreshed, Android-powered device for technology enthusiasts and nostalgia seekers, reflecting a trendy intersection of retro design and modern smartphone capabilities in 2025.
#BB

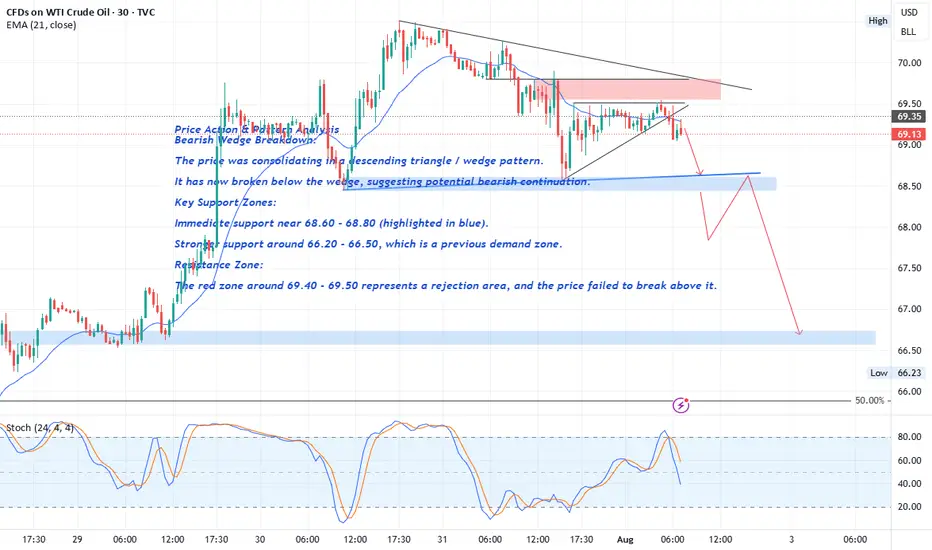
Crude Oil Price Action & Pattern Analysis
Bearish Wedge Breakdown:
The price was consolidating in a descending triangle / wedge pattern.
It has now broken below the wedge, suggesting potential bearish continuation.
Key Support Zones:
Immediate support near 68.60 - 68.80 (highlighted in blue).
FOREXCOM:USOIL
The break of the 68.60 level with a strong bearish candle would serve as confirmation of a Head and Shoulders (H&S) pattern , with solid bearish implications.
Stronger support around 66.20 - 66.50 , which is a previous demand zone.
Resistance Zone:
The red zone around 69.40 - 69.50 represents a rejection area , and the price failed to break above it.
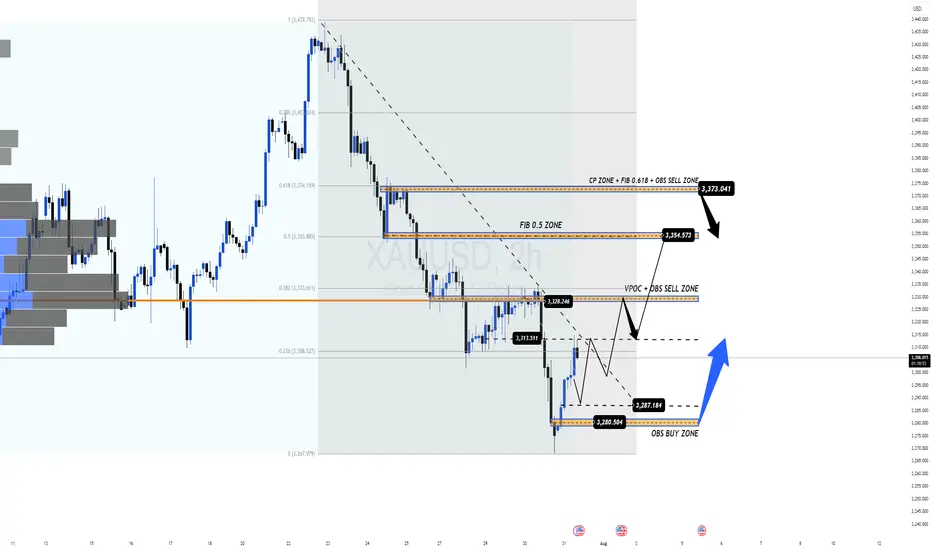
Bounce From Final Liquidity or Start of a Bullish Move? Bounce From Final Liquidity or Start of a Bullish Move?
After the FOMC event, gold completed a sweep of the final liquidity zone at 3269–3271 and rebounded strongly, in line with the broader bullish trend. The price has now recovered sharply and is gradually returning to the liquidity zones left behind after yesterday’s sharp drop.
📍 At the moment, gold is reacting around 3295, which aligns with a CP (Compression Point) Zone on the M30 chart. We're seeing a slight pullback here, and another retracement could occur before a strong upward continuation — potentially breaking out of the descending trendline that’s formed over recent days.
📊 Trading Plan & Key Levels
✅ BUY ZONE – Trend Continuation Setup
Entry: 3286–3284
Stop Loss: 3278
Take Profits:
3290 → 3294 → 3298 → 3304 → 3308 → 3312 → 3316 → 3320 → 3330 → …
💡 This is a prime area to look for re-entries into the dominant bullish move. Price action left a clean liquidity zone below after the aggressive upside reaction — ideal for riding the next wave.
❌ SELL ZONE – Only Valid Below VPOC
Entry: 3328–3330 (Volume Point of Control)
Stop Loss: 3335
Take Profits:
3324 → 3320 → 3315 → 3310 → 3305 → 3300
🔻 This is a high-probability short only if price stays below 3330. If gold closes above this VPOC region, the structure shifts to bullish and we should look for sells higher up — around 335x–337x zones.
📅 Monthly Candle Close – Watch for Indecision
As it’s the last trading day of the month, note that the past two monthly candles have printed doji-like wicks, signalling indecision and liquidity grabs. The market is still waiting for a clearer signal from the Fed on the first potential rate cut of the year.
🚫 Avoid emotional trading. This is a highly reactive environment, so careful risk management is key.
🧭 Final Thoughts
Gold continues to respect market structure and liquidity theory. The first major test lies at the 3313 resistance level — if broken, it opens the door to stronger bullish momentum toward the broader VPOC zone.
⏳ Be patient and only act when price confirms your bias.
EUR/JPY BEARISH BIAS RIGHT NOW| SHORT
Hello, Friends!
We are now examining the EUR/JPY pair and we can see that the pair is going up locally while also being in a uptrend on the 1W TF. But there is also a powerful signal from the BB upper band being nearby, indicating that the pair is overbought so we can go short from the resistance line above and a target at 168.581 level.
Disclosure: I am part of Trade Nation's Influencer program and receive a monthly fee for using their TradingView charts in my analysis.
✅LIKE AND COMMENT MY IDEAS✅
