Natural Gas Bullish Reversal...Are the Lows in?U.S. natural gas inventories increased by 48 billion cubic feet last week to 3,123 Bcf, increasing the surplus over the five-year average.
Consensus / forecast was 37Billion Cubic feet.
Despite a much higher build than expected Nat gas saw positive price action.
This appears to simply be a dead cat bounce before we go lower.
A death cross on the daily chart has occurred. This signal often results in a small bounce before going lower.
Chart Patterns

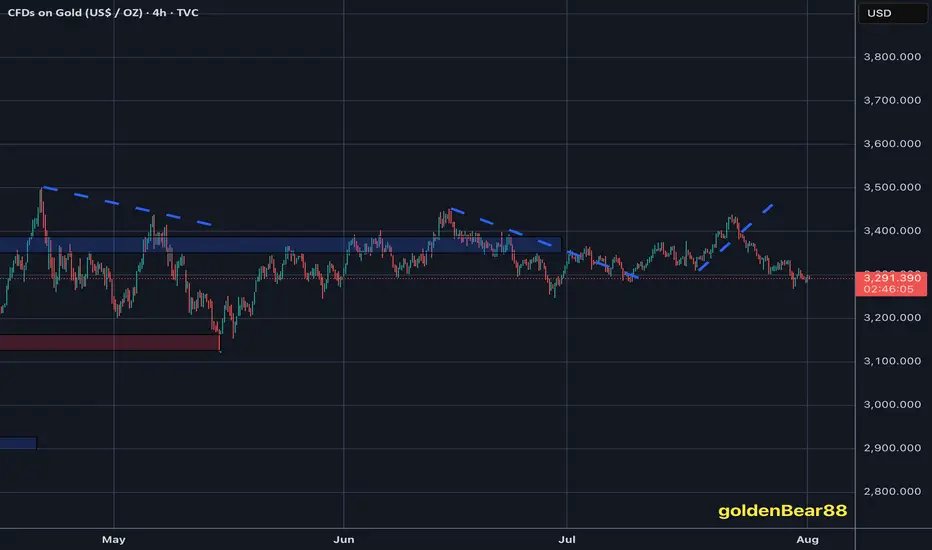
I maintain my #3,277.80 and #3,252.80 TargetsI didn't engaged any re-Sell orders throughout yesterday's session and re-Sold Gold on #3,295.80 ahead of Asian session, with plan to keep orders over-night. However due NFP, Gold might be stationary / ranging until the news as I closed both of my orders on #3,291.80 / each #9.000 Eur Profit and my #3,300.80 pending Sell limit has been triggered over-night which is now running in Profits with Stop on breakeven. I do expect #3,277.80 and #3,252.80 Targets to be met within #1 - #3 sessions and if there aren't NFP numbers, I would keep all three orders / set of Selling orders maintaining my first #3,277.80 Target. Due the news, Gold might fluctuate within Neutral Rectangle until the news.
Technical analysis: My earlier Selling configuration / Technical expectations was confirmed on Hourly 4 chart under prolonged weakness and Price-action respecting the trend-line guarding the downtrend (very Bearish formation) as Hourly 1 chart is already an aggressive Descending Channel (width opened on Williams) that should reach it’s next local Low’s (currently Trading slightly below Double Bottom) and Oversold state near my take Profit of #3,252.80 benchmark. If the bands are widened Traders may witness #3,277.80 test, also if gets invalidated and #3,270.80 gives away, #3,252.80 mark extension test is inevitable. In any case I will update my Targets or levels of Profit taking if I decide to exit earlier than #3,252.80 benchmark to be in accordance with the Daily chart’s period / I already ride Selling wave since #,3,300's and my Profit will be already good to ignore.
My position: DX is soaring, Gold is under Bearish Technical developments and #3,252.80 benchmark is my final Target of current Selling leg. Only factor which can reverse this Intra-day but not postpone is NFP. I expect downside Jobs surprise which may reverse DX from local High's however hot upside surprise will make Gold test #3,252.80 Intra-day. NFP or not I do believe Gold is Bearish. Trade accordingly.
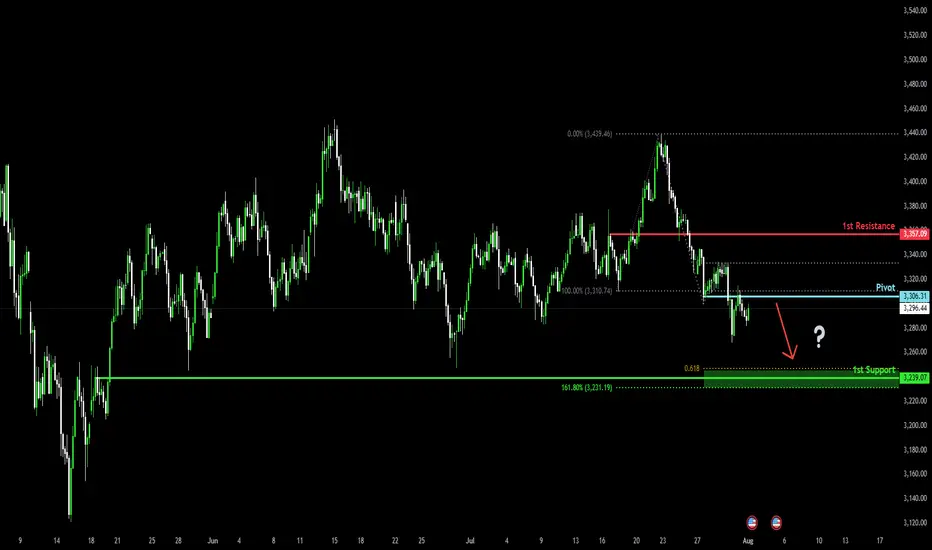
Potential bearish drop?The Gold (XAU/USD) has reacted off the pivot and could drop to the 1st support.
Pivot: 3,306.31
1st Support: 3,239.07
1st Resistance: 3,357.09
Risk Warning:
Trading Forex and CFDs carries a high level of risk to your capital and you should only trade with money you can afford to lose. Trading Forex and CFDs may not be suitable for all investors, so please ensure that you fully understand the risks involved and seek independent advice if necessary.
Disclaimer:
The above opinions given constitute general market commentary, and do not constitute the opinion or advice of IC Markets or any form of personal or investment advice.
Any opinions, news, research, analyses, prices, other information, or links to third-party sites contained on this website are provided on an "as-is" basis, are intended only to be informative, is not an advice nor a recommendation, nor research, or a record of our trading prices, or an offer of, or solicitation for a transaction in any financial instrument and thus should not be treated as such. The information provided does not involve any specific investment objectives, financial situation and needs of any specific person who may receive it. Please be aware, that past performance is not a reliable indicator of future performance and/or results. Past Performance or Forward-looking scenarios based upon the reasonable beliefs of the third-party provider are not a guarantee of future performance. Actual results may differ materially from those anticipated in forward-looking or past performance statements. IC Markets makes no representation or warranty and assumes no liability as to the accuracy or completeness of the information provided, nor any loss arising from any investment based on a recommendation, forecast or any information supplied by any third-party.
RPLUSDT Forming Strong Bullish StructureRPLUSDT is currently showing a strong bullish structure, with price action reclaiming a key support zone after a temporary retracement. The chart reveals a textbook market cycle with higher highs and higher lows, indicating a possible continuation of the uptrend. The current price level is sitting just above a key demand zone, previously tested and confirmed as strong support. This confluence area may act as a springboard for a potential move toward the 60% to 70% target gain zone, aligning with broader bullish sentiment seen across mid-cap altcoins.
Volume indicators are supportive of this move, suggesting that accumulation is underway. Increased investor interest in RPL is likely tied to its integral role in Ethereum’s liquid staking ecosystem, as Rocket Pool continues to gain adoption. With ETH staking steadily growing, projects like RPL tend to benefit from fundamental tailwinds. This kind of sector strength combined with favorable technicals gives the current setup more credibility and potential for follow-through.
The technical projection suggests that if momentum holds and buyers maintain control above the support range around $6.70–$7.00, then the next leg could push RPLUSDT beyond $12.00. That represents a 70%+ move from current levels, which aligns with the Fibonacci extension and measured move projections derived from previous breakout zones. Traders should keep a close eye on volume confirmation and potential breakout candles above minor resistance near $7.50.
This setup offers a well-defined risk-to-reward ratio for swing traders and position holders alike. With the current crypto market regaining traction, RPL is positioned as a high-potential candidate for strong upside if broader conditions remain favorable.
✅ Show your support by hitting the like button and
✅ Leaving a comment below! (What is You opinion about this Coin)
Your feedback and engagement keep me inspired to share more insightful market analysis with you!

Bullish reversal off overlap support?The Cable (GBP/USD) is falling towards the pivot and could bounce to the 1st resistance, which is a pullback resistance that is slightly below the 38.2% Fibonacci retracement.
Pivot: 1.3159
1st Support: 1.3049
1st Resistance: 1.3321
Risk Warning:
Trading Forex and CFDs carries a high level of risk to your capital and you should only trade with money you can afford to lose. Trading Forex and CFDs may not be suitable for all investors, so please ensure that you fully understand the risks involved and seek independent advice if necessary.
Disclaimer:
The above opinions given constitute general market commentary, and do not constitute the opinion or advice of IC Markets or any form of personal or investment advice.
Any opinions, news, research, analyses, prices, other information, or links to third-party sites contained on this website are provided on an "as-is" basis, are intended only to be informative, is not an advice nor a recommendation, nor research, or a record of our trading prices, or an offer of, or solicitation for a transaction in any financial instrument and thus should not be treated as such. The information provided does not involve any specific investment objectives, financial situation and needs of any specific person who may receive it. Please be aware, that past performance is not a reliable indicator of future performance and/or results. Past Performance or Forward-looking scenarios based upon the reasonable beliefs of the third-party provider are not a guarantee of future performance. Actual results may differ materially from those anticipated in forward-looking or past performance statements. IC Markets makes no representation or warranty and assumes no liability as to the accuracy or completeness of the information provided, nor any loss arising from any investment based on a recommendation, forecast or any information supplied by any third-party.

S&P Correction Window is official - VOLATILITY AHEADIt's that time of year where the pre-summer push wraps and the summer lull and potential
pause gets underway.
July 31 finished on a bit of a sour note with over 67% of stocks declining today and US indexes finishing RED despite the big gaps and bullish pops on MSFT and META post earnings.f
SPX Key Levels
-watch the 21 day moving average
-watch the 50 day moving average
-more dynamic support in the 100/144/200 moving average cluster
I'll be taking bites at the 5/10/15% correction levels with options and looking for this dip
to be bought by retail and institutions.
Will August 1 US Tariff Deadline matter? After Japan and Eurozone came in and said a deal is being done, I was thinking this would be a dud. BUT, Dr. Copper says "maybe" on the global
tariff deadline with the largest single day move in history (bearish). Being the perfect time of year for a correction (the other being Feb-Apr), and the technicals looking so clean for an
orderly pullback, VIX may float higher and make things more interesting in the next 30-60 days.
Strategies matter, I'll be trading risk defined, but there are great opportunities ahead. A pullback is sure better than literally watching all-time highs every single day.
Thanks for watching!!!

Xausd techinical analysis.Xausd techinical analysis next move posibale at h1 time frame not finchinical advice.

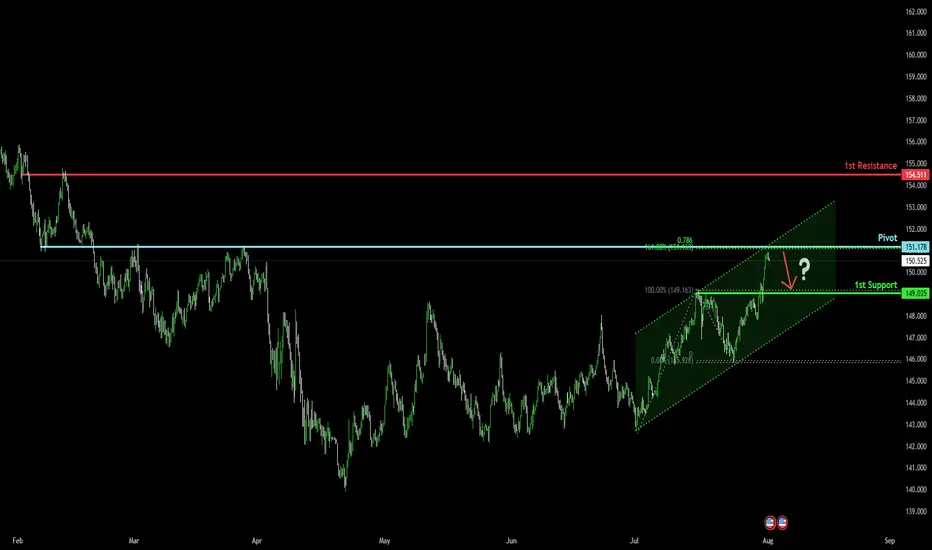
Bearish reversal off overlap resistance?USD/JPY is rising towards the pivot, which has been identified as an overlap resistance and could drop to the 1st support.
Pivot: 151.17
1st Support: 149.03
1st Resistance: 154.51
Risk Warning:
Trading Forex and CFDs carries a high level of risk to your capital and you should only trade with money you can afford to lose. Trading Forex and CFDs may not be suitable for all investors, so please ensure that you fully understand the risks involved and seek independent advice if necessary.
Disclaimer:
The above opinions given constitute general market commentary, and do not constitute the opinion or advice of IC Markets or any form of personal or investment advice.
Any opinions, news, research, analyses, prices, other information, or links to third-party sites contained on this website are provided on an "as-is" basis, are intended only to be informative, is not an advice nor a recommendation, nor research, or a record of our trading prices, or an offer of, or solicitation for a transaction in any financial instrument and thus should not be treated as such. The information provided does not involve any specific investment objectives, financial situation and needs of any specific person who may receive it. Please be aware, that past performance is not a reliable indicator of future performance and/or results. Past Performance or Forward-looking scenarios based upon the reasonable beliefs of the third-party provider are not a guarantee of future performance. Actual results may differ materially from those anticipated in forward-looking or past performance statements. IC Markets makes no representation or warranty and assumes no liability as to the accuracy or completeness of the information provided, nor any loss arising from any investment based on a recommendation, forecast or any information supplied by any third-party.
Very Bullish!!
Solana chart looks very bullish. The price is currently dropping but I think it is a very healthy correction.
Weekly chart:
1) all momentum indicators just entered the bull zone.
2) The chart is forming higher highs.
Daily:
1) EMA55 finally crossed EMA200. The last time they crossed was October 2023 (see red vertical line in the chart) and it was the beginning of the macro bull trend.
2) Momentum indicators have reached overbought territory and crossed to the downside, however, given weekly momentum indicators have just entered the bull zone, this move is likely to be corrective action.
3) When EMA55 and EMA200 cross, the price often retraces initially to EMAs (21, 55 or 200). Once it completes the pull back, I anticipate the price to move to the previous ATH and beyond.
This is the time when high leverage trading volume increases.
Be careful not get wicked out. Focus on monthly/weekly/daily charts and ignore the noise in the lower timeframes.

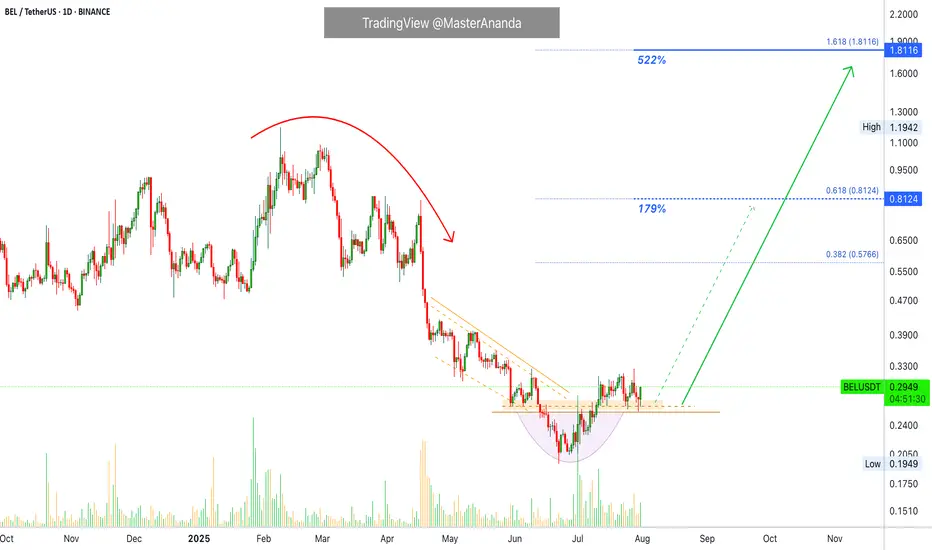
Bella Protocol 522% Easy Profits PotentialWe are going to be looking at many charts together every single day. We will go through all the altcoins basically. I am starting with some of those from the last period that didn't move. The charts look good but they filed to break their May high. These pairs are now ready to move before the rest of the market.
Here we have BELUSDT. A nice rounded bottom to end the downtrend. A small bullish recovery supported by high volume.
We have a perfect set of reversal signals and today a full green candle. This candle confirms those signals and opens up the chance of a strong advance. If the action starts now, you can be looking at the start of a major 2-3 months long move.
There will be some stops along the way but the action should be bullish nonetheless, higher highs and higher lows.
Strategy
In this setup we simply buy spot, no stop-loss. After buying we wait for as long as it is needed for prices to rise. Normally within 2-3 weeks, can be just a few days, but sometimes the wait can extend to 1-2 months. It varies. We are always prepared and ready to wait six full months, so if anything happens before this time horizon, even better but be ready to wait.
Even if you were to sell your current pair to buy a new one, the new one also requires waiting. We tend to sell wanting to find something that is moving but the moment we sell, we are faced with the same problem; even if the pair you chose is moving you have to wait for the bullish wave to develop. Even if prices rise 5% daily it would still take 20 days for a 100% price increase. 40 days for 200%. Etc. Patience is key.
So, simply, buy and hold. The market will take care of the rest.
Namaste.
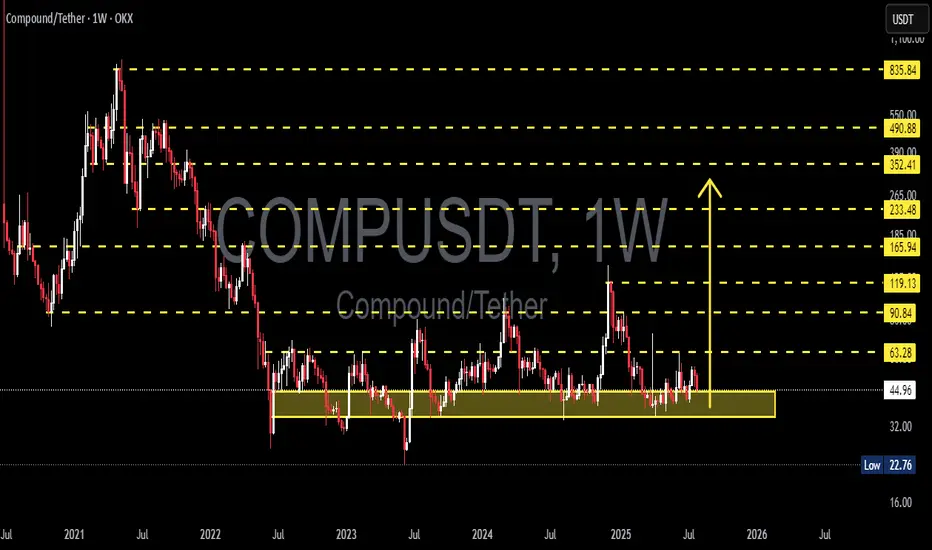
COMPUSDT in a Strong Demand Zone! Reversal Potential / Breakdown🔍 In-Depth Analysis (Timeframe: Weekly / 1W)
The COMP/USDT pair is currently hovering above a long-term demand zone that has held strong since mid-2022. Price is sitting around $44.90, just above the key support area of $32 – $45 (highlighted in yellow), which has acted as a major accumulation zone for over 2 years.
🧱 Critical Zone: Smart Money Accumulation or Exhaustion?
The $32–$45 demand zone has been tested multiple times, indicating smart money interest and hidden buying pressure.
Price action in this range forms a clear base structure or horizontal accumulation pattern, a classic setup before a large directional move.
However, the prolonged sideways consolidation hints at an imminent breakout or breakdown — momentum is building.
---
📊 Key Technical Pattern:
🟨 Rectangle Range (Accumulation Structure)
Price has been ranging between $32 and $63.28 with no clear breakout.
Strong rejections every time price dips below $35 indicate consistent buyer defense.
🔃 Mean Reversion Behavior
Repeated moves back to the mid-range reflect an indecisive market (equilibrium phase), often seen before expansion.
---
📈 Bullish Scenario (Potential Reversal):
If price breaks above major resistance at $63.28:
1. Upside Targets:
🎯 $90.84 (key resistance zone)
🎯 $119.13 (prior distribution zone)
🎯 $165.94 (macro target if sentiment turns highly bullish)
2. Confirmation needed via weekly close above $63 with strong volume.
3. A bullish breakout may form a new Higher Low and Higher High structure on both daily and weekly timeframes.
🟢 Bullish confirmation: Weekly bullish engulfing + volume breakout above $63.
---
📉 Bearish Scenario (Potential Breakdown):
If price closes below the $32 support:
1. Possible downside targets:
⚠️ $22.76 (next logical support)
🚨 $16 (last consolidation base pre-2021 rally)
2. A break below this long-term support could trigger a final capitulation flush before a potential macro reversal.
🔴 Bearish confirmation: Weekly close below $32 with increased volume and sustained selling.
---
⚖️ Strategic Takeaway:
COMP/USDT is currently at a pivotal decision zone — a crossroads between massive upside potential and deeper downside risk.
This is not just another support area, it’s a macro-level demand zone that will likely dictate trend direction in the coming months.
⏳ A major move is brewing — whether breakout or breakdown, be ready.
#COMPUSDT #CryptoOutlook #TechnicalAnalysis #AltcoinSeason #DeFi #CryptoTrading #AccumulationZone #BreakoutSetup #BearishScenario #BullishSetup #CryptoAnalysis
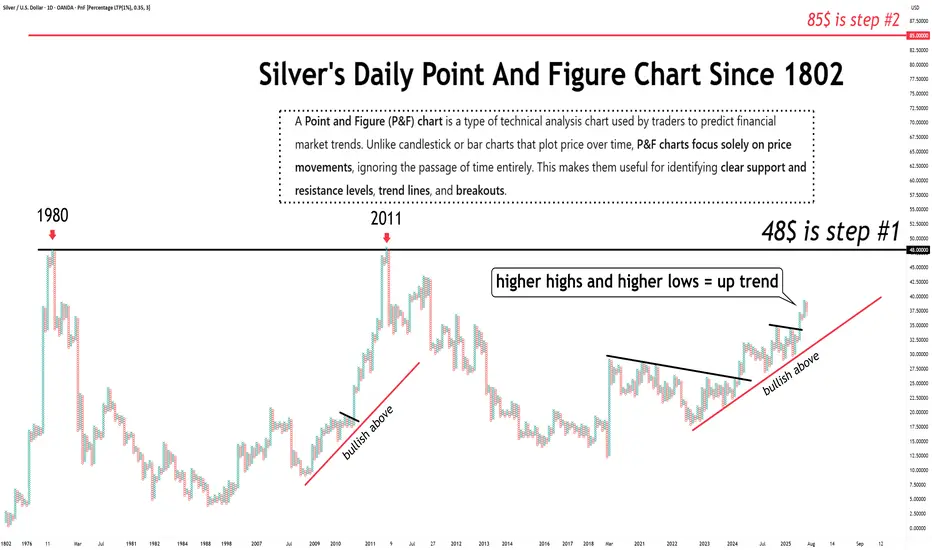
The long term prospects for silver are STILL bullish.Just so we are clear...
The long term prospects for silver are STILL bullish.
Once $48 is cleared, $85 becomes the next target.
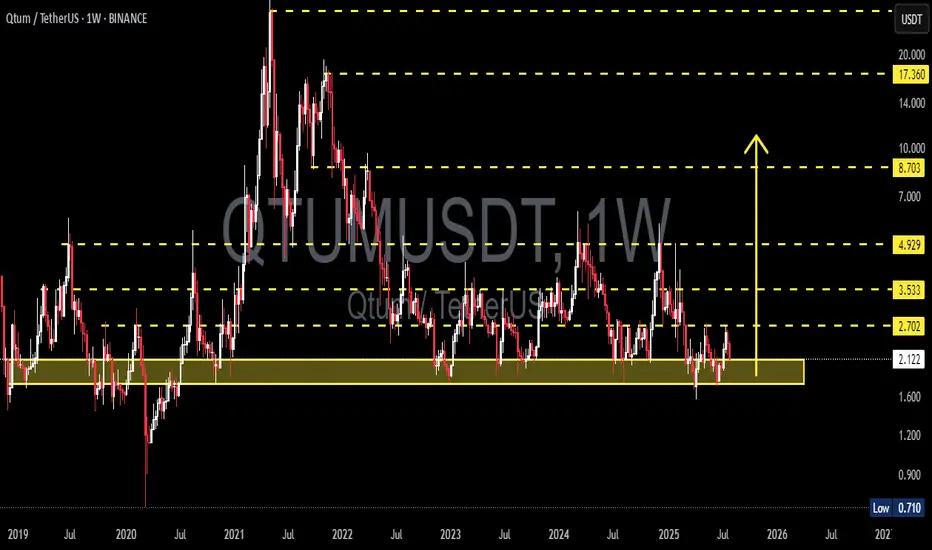
QTUM/USDT – Make or Break? Testing the Edge of Accumulation?🧠 Overview:
After going through a volatile multi-year cycle, QTUM is now back at one of the most critical historical support zones. This demand area has acted as a strong reversal point multiple times since 2020 and is once again being tested as price consolidates near the bottom of its macro range.
---
📉 Price Structure & Key Levels:
📍 Major Support Zone (1.70 – 2.10 USDT):
A proven accumulation zone based on multiple long wicks and price rejections in the past.
This is where smart money tends to accumulate during market uncertainty.
📍 Layered Resistance Levels (Bullish Targets):
2.70 USDT → Initial breakout validation
3.53 USDT → Mid-range resistance
4.93 USDT → Key structural level
8.70 USDT → Mid-term breakout target
17.36 USDT → Peak from previous macro cycle
---
🧩 Current Pattern: "Sideways Accumulation Range"
QTUM is clearly in a range-bound accumulation phase, with tight price action within a key support area. Historically, such patterns often precede large impulsive moves, especially when accompanied by volume surges and breakouts from structure.
> ⚠️ Important Note: Sideways movement at historical support, combined with increasing accumulation volume, often leads to a breakout into the markup phase.
---
📈 Bullish Scenario: Potential Upside Momentum
Trigger: A confirmed breakout and weekly candle close above 2.70 USDT.
Additional Confirmation: Strong bullish candle with increased volume.
Targets:
3.53 USDT (local resistance)
4.93 USDT (mid-range structural level)
8.70 USDT (swing target)
17.36 USDT (macro cycle high)
🎯 High reward-to-risk potential if entries are made near support with a stop-loss under 1.70 USDT.
---
📉 Bearish Scenario: Breakdown Risk
Trigger: Weekly candle closes below 1.70 USDT.
Implication: Breakdown from long-term demand zone.
Downside Targets:
1.20 USDT → Minor horizontal support
0.71 USDT → Historical all-time low
Warning Sign: High volume breakdown = likely sign of institutional selloff or panic exit.
---
📊 Strategic Summary:
> QTUM is at a pivotal crossroads.
The 1.70 – 2.10 USDT range is a decisive area.
A bullish breakout could spark a major recovery rally,
while a breakdown may lead to a deeper capitulation.
This is a “calm before the storm” situation. Traders should monitor closely as the next few weekly candles could define the trend for the rest of 2025.
#QTUMUSDT #QTUM #CryptoAnalysis #AltcoinSetup #TechnicalAnalysis #AccumulationPhase #SupportAndResistance #BreakoutPlay #CryptoBreakout
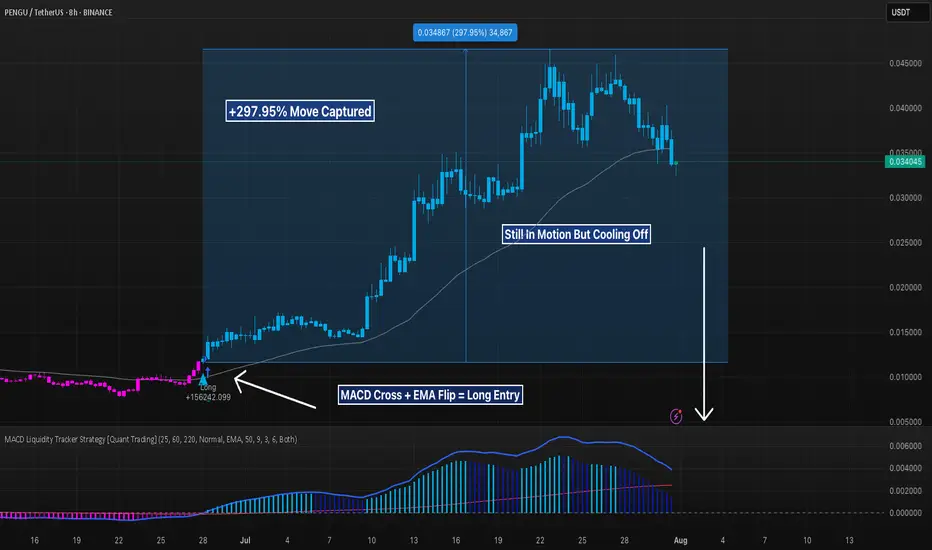
PENGU 8H – 297% MACD Strategy Long Call BreakdownPENGU’s recent move is the kind of textbook trend trade that makes systems like the MACD Liquidity Tracker shine.
The strategy stayed flat throughout the entire sideways grind in June — filtering out chop with its 60/220 EMA trend filter. It wasn’t until late June that MACD flipped bullish and price reclaimed both EMAs. That was the trigger — and from there, it was lift-off.
The system held through a clean +297.95% move from sub-$0.012 to just under $0.045. No early exits. No fakeouts. Just a single, conviction-based trade.
The exit signal hit near the top as momentum waned and MACD rolled over. Since then, price has retraced and is now hovering right above the 60 EMA — a level that's acted as dynamic support all run long.
📊 Strategy Overview:
– MACD Settings: 25 / 60 / 220
– EMA Trend Filter: 60 & 220
– Mode: Normal
– Timeframe: 8H
⚠️ If price holds above the EMA and MACD stabilizes, bulls may still have fuel. But a breakdown below ~$0.029 would shift structure back into bearish territory.
Let the chart tell the story — this was pure momentum trading in action.
#Nifty directions and levels for August 1st:Good morning, friends! 🌞
Here are the market directions and levels for August 1st:
The global market (based on the Dow Jones) has shown a moderately bearish sentiment,
while the local market continues to display a bearish tone.
Today, Gift Nifty indicates a neutral opening.
What can we expect today?
In the previous session, both Nifty and Bank Nifty experienced high volatility.
However, the closing happened around the middle of the current swing, indicating a possible range-bound market. Until this range is broken, we cannot expect a strong directional move.
If the range breaks, we can follow the breakout direction.
In my side, the structures of Nifty and Bank Nifty appear slightly different. Nifty continues to show bearish sentiment, whereas Bank Nifty is showing signs of a mild bounce back. So, they may counterbalance each other, and if that happens, we may see a neutral closing by the end of the day.
On the other hand, if the market breaks immediate support or resistance with a solid candle or after consolidation, we can expect a directional move in that breakout direction.

Still bullish in the higher time frames Solana has been struggling to break and stay above $170-200 zone this cycle.
It has been a very difficult asset to trade, however, I can see more bullish setups than bearish setups in higher timeframe charts.
Monthly:
1) July monthly candle closed above Fib 0.618 and formed higher high higher low.
2) RSI and MACD are still in the bull zone.
3) Stochastic are in the bear zone, but they are pointing to the upside.
Weekly:
1) EMA21 is still above EMA55.
2) The current weekly candle is forming bearing engulfing candle, however, there are two more days before it closes. It is still above EMA 21.
3) RSI orange line (RSI based moving average) is moving upwards and entering the bull zone.
4) MACD is about to enter the bull zone.
5) Stochastic hasn't reached overbought territory yet.
6) The set up of these three momentum indicators is very similar to the set up in Oct 23 before Solana started a massive bull trend. (see red vertical line)
Daily:
1) EMA21>EMA55>EMA200
2) As I said in the previous articles, EMA 55 and 200 don't cross easily. But when they do, the price often pulls back significantly before it starts to move in the direction of the trend.
3) Daily candle broke below EMA21, however, the price is reacting strongly to EMA55.
4) The price is still higher high higher low.
I will wait and see if the price is going to bounce off from $143 -157 region. (see blue rectangular block).

TRX 1D – SR Flips and Trendline Support Hold StrongTRX continues to respect trend structure — clean support retests, ascending trendline intact, and back-to-back SR flips fueling continuation.
With another higher low forming off the recent flip zone, bulls may be eyeing a move into the $0.35+ range. But watch closely — if price breaks below $0.30, structure could crack.
Trend still leans bullish… for now.

BULLISH BTC - Potential Inverted head and shoulders forming Potential breakout to $119 to $124,000 - Look for volume and support at $116 to $117,000. Breakout above $118,500 will confirm formation.

Get out now! Bullmarket might be over This is LMACD applied to GC with reduced lag. If this time is not different we just had our cycle top ~123k. Sell some coins and buy back around 2026 ~44K

XRP 4H + 67% From MACD Trend Entry, But Is the Pullback Real?This XRP move was a masterclass in filtered momentum trading. The MACD Liquidity Tracker Strategy (Normal Mode) skipped early chop, then fired long once MACD aligned with a reclaim of the 60/220 EMAs — signaling a clean directional shift.
The strategy held through a +67.18% rally, exiting only when MACD flipped bearish and price lost EMA support. From ~$2.12 to ~$3.54, the move was captured in full with zero re-entries or second guessing.
Now price is under pressure, printing pink bars and sitting below both EMAs. The $2.90–$3.00 zone may determine if this is a healthy pullback — or the start of a reversal.
📊 MACD: 25 / 60 / 220
Trend Filter: 60/220 EMA
Mode: Normal | Timeframe: 4H
Educational chart. Drop your take.

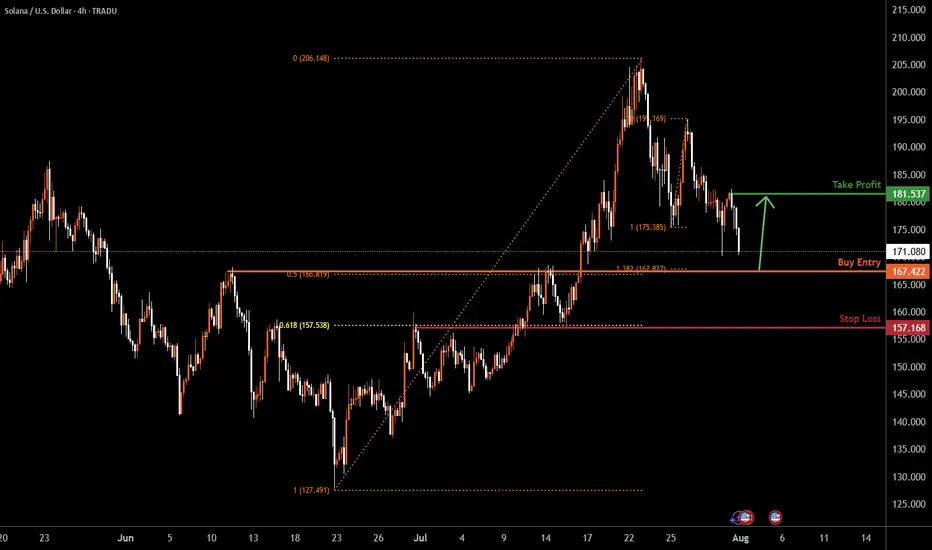
SOLUSD H4 | Bullish bounceBased on the H4 chart analysis, the price could fall to the buy entry, which acts as a pullback support that aligns with the 50% Fibonacci retracement and the 138.2% Fibonacci extension and could bounce to the upside.
Buy entry is at 167.42, which is a pullback support that aligns with the 50% Fibonacci retracement and the 138.2% Fibonacci extension.
Stop loss is at 157.16, which is an overlap support that aligns with the 61.8% Fibonacci retracement.
Take profit is at 181.53, which is a pullback resistance.
High Risk Investment Warning
Trading Forex/CFDs on margin carries a high level of risk and may not be suitable for all investors. Leverage can work against you.
Stratos Markets Limited (tradu.com ):
CFDs are complex instruments and come with a high risk of losing money rapidly due to leverage. 65% of retail investor accounts lose money when trading CFDs with this provider. You should consider whether you understand how CFDs work and whether you can afford to take the high risk of losing your money.
Stratos Europe Ltd (tradu.com ):
CFDs are complex instruments and come with a high risk of losing money rapidly due to leverage. 66% of retail investor accounts lose money when trading CFDs with this provider. You should consider whether you understand how CFDs work and whether you can afford to take the high risk of losing your money.
Stratos Global LLC (tradu.com ):
Losses can exceed deposits.
Please be advised that the information presented on TradingView is provided to Tradu (‘Company’, ‘we’) by a third-party provider (‘TFA Global Pte Ltd’). Please be reminded that you are solely responsible for the trading decisions on your account. There is a very high degree of risk involved in trading. Any information and/or content is intended entirely for research, educational and informational purposes only and does not constitute investment or consultation advice or investment strategy. The information is not tailored to the investment needs of any specific person and therefore does not involve a consideration of any of the investment objectives, financial situation or needs of any viewer that may receive it. Kindly also note that past performance is not a reliable indicator of future results. Actual results may differ materially from those anticipated in forward-looking or past performance statements. We assume no liability as to the accuracy or completeness of any of the information and/or content provided herein and the Company cannot be held responsible for any omission, mistake nor for any loss or damage including without limitation to any loss of profit which may arise from reliance on any information supplied by TFA Global Pte Ltd.
The speaker(s) is neither an employee, agent nor representative of Tradu and is therefore acting independently. The opinions given are their own, constitute general market commentary, and do not constitute the opinion or advice of Tradu or any form of personal or investment advice. Tradu neither endorses nor guarantees offerings of third-party speakers, nor is Tradu responsible for the content, veracity or opinions of third-party speakers, presenters or participants.
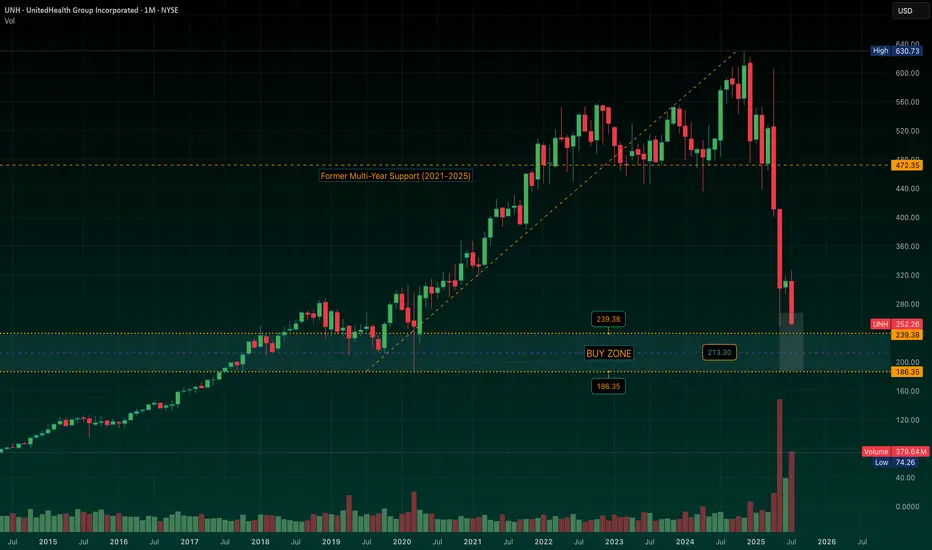
UNH: Mapping Out a Defined-Risk LEAPS Strategy in the "Buy Zone"UNH is approaching a broad structural support region I’ve been tracking -- a wide zone from $239 down to $186, where (for me) the stock begins to offer compelling risk/reward and long-term value. Momentum, IMO, is still decisively lower, but we’re nearing levels where I start preparing.
The midpoint of the “Buy Zone” near $213 reflects a potential average cost area I’d be very comfortable building from, depending on how price behaves as it enters the zone.
I’ll look to initiate exposure through long-dated call options (LEAPS) -- as I’ve started doing in NYSE:CNC -- once the setup begins to stabilize. From there, I’ll begin layering in short puts at ownership levels that align with the broader structure. If assigned, I’ll own where I intended. If not, I’m collecting premium to help finance the LEAPS.
I’m not in the business of calling exact bottoms… this is about building a position that respects time, structure, and flexibility -- anticipating a slow grind higher over the next 12–18 months. Stay tuned.
OGDC Breakout?On a daily timeframe, OGDC has given breakout of a triangle pattern. This will open up doors for it to move towards its all-time high i.e. ~290 region.
This is my personal opinion, not a buy / sell call.
All other indicators e.g. RSI, Stoch and MACD are bullish as well.
