Can a Bear Market Start With Ethereum At $3,000?Ethereum produced sideways action for 49 days, 7 weeks. Immediately after seeing this I realized the next logical step was a bullish breakout, and the market moved up. But this isn't all. Ethereum is still trading at $3,000, more than $1,800 away from its all-time high.
Now, thinking about the doubt that always creeps up when the market becomes bullish confirmed, I want to clear things up if at least for you. While others can continue to doubt and will continue to do so, many others will even SHORT and lose everything, you will be happy knowing that the market will experience additional growth. You will also be making profits as the market grows. You will be happy because you know for a fact, based on data, that we are set to experience sustained long-term growth.
A bear market can only develop after a bull market. A bull market ends in a major high or new all-time high. Current conditions for ETHUSDT are far from being "peaky." There is no new all-time high. Actually, prices are still relatively low.
First Ethereum needs to challenge its previous all-time high, create a new one and then we can talk about a bear market or correction. We know for a fact that Ethereum is bullish based on recent price action and the chart. We know for a fact that Ethereum will grow because Bitcoin is already high up. Ethereum is the #2 Crypto and what Bitcoin does it tends to follow.
Bitcoin is super strong but this is not to be confused as weakness. Weakness comes when the market has been growing for too long, growth becomes heavy and a drop happens next. Strength happens when the market has been sideways for months, breaks up and produces a major advance (now). This type of pattern predicts additional growth.
Bitcoin is the king and what Bitcoin does the rest follows. You can expect additional growth.
The reason why the bullish cycle is not yet over is because prices are still too low. Many altcoins are trading near all-time lows. Think about it. A bear market develops from all-time highs and bull markets develop from all-time lows. We are only at the start of a major bullish cycle, phase and wave.
The proof is in the chart. A major low was hit 7-April 2025, the lowest since March 2023. This marks the end of the correction and the start of the 2025 bullish phase. I don't know if Ethereum will grow for years or only for a few months. I know with 100% certainty that the Cryptocurrency market will continue to grow. You can bet your house on it.
Thanks a lot for your continued support.
Namaste.
Chart Patterns

USDJPY 30Min Engaged ( Buy Entry Detected )➕ Objective: Precision Volume Execution
Time Frame: 30-Minute Warfare
Entry Protocol: Only after volume-verified breakout
🩸 Bullish From now Price : 147.900
➗ Hanzo Protocol: Volume-Tiered Entry Authority
➕ Zone Activated: Dynamic market pressure detected.
The level isn’t just price — it’s a memory of where they moved size.
Volume is rising beneath the surface — not noise, but preparation.
🔥 Tactical Note:
We wait for the energy signature — when volume betrays intention.
The trap gets set. The weak follow. We execute.
USDJPY 30Min Engaged ( Buy Entry Detected )

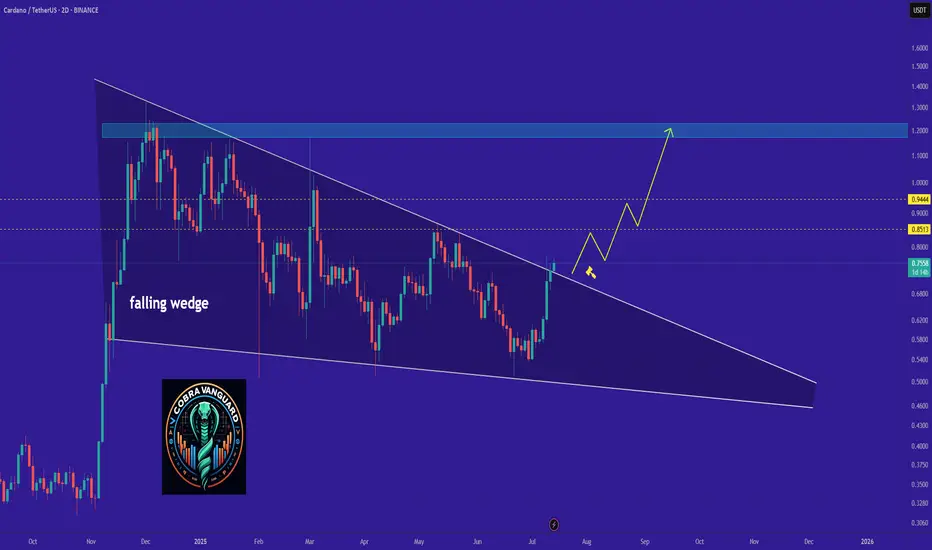
ADA - Time to buy again!The price has broken the wedge pattern, which means it can easily reach its previous high or even go higher.
Best regards CobraVanguard.💚
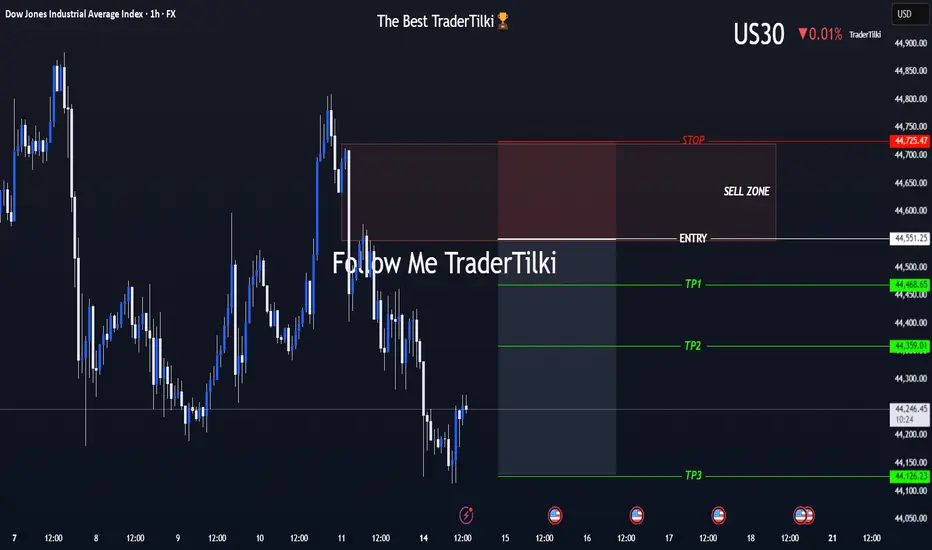
US30 (Dow Jones) Is On My Radar — The Moment’s Getting Close!Hey Guys,
I've marked my sell zone on the Dow Jones (US30) chart.
Once price reaches my entry range, I’ll be jumping into this high-probability trade setup.
🚪 Entry Levels: 44,551 – 44,632 – 44,677
🛑 Stop Loss: 44,725
🎯 Targets:
• TP1: 44,468
• TP2: 44,359
• TP3: 44,126
📐 Risk-to-Reward Ratio: Approximately 2.41 from the 44,551 entry
Your likes and support are what keep me motivated to share these analyses consistently.
Huge thanks to everyone who shows love and appreciation! 🙏
GBPUSD → Correction amid a global bullish trend...FX:GBPUSD is testing the 1.345 - 1.35 area as part of a correction. The price is closing the imbalance zone and testing support, which may trigger a reaction. Further developments will largely depend on the dollar, which is testing resistance.
The daily market structure is quite strong. The correction against the backdrop of a strong trend is within acceptable limits, and bulls should fight to keep the price away from risk zones. GBPUSD, as part of the correction, closes the imbalance zone of 1.34 - 1.35 (0.7 - 0.79f) and forms a false breakdown of the intermediate support level of 1.3476. If buyers hold their ground in the 1.347-1.35 zone, the currency pair will be able to return to the global trend.
Support levels: 1.3476, 1.345, 1.3382
Resistance levels: 1.3511, 1.359, 1.375
Price consolidation above 1.349 - 1.350 will confirm the market's intentions. In this case, we can expect growth to 1.36 - 1.374.
Best regards, R. Linda!

BTC Bull Flag Target Hit Is $150K Now on the Table?Bitcoin continues to deliver with precision. If you’ve been following the structure, this breakout is no surprise. We had a textbook bullish flag setup earlier in the cycle clean pole, sideways consolidation, and a sharp breakout. That initial flag target has now been achieved.
But here’s where it gets interesting: price didn’t just hit the flag projection it shows a good potential for a test towards the projected supply zone just beneath $128K. A short-term rejection here is completely normal and even healthy. The current pullback appears corrective, and the $115K–$111K region (our immediate buy-back zone) remains a critical area to watch for a potential base.
The structure so far has respected its levels cleanly. The pole projection landed almost perfectly, which builds confidence in how this setup is unfolding. A retest of the demand block offers a decent long opportunity, especially with trendline confluence and horizontal support lining up in that zone.
If BTC continues to respect the broader trend and finds strength off this pullback, the path toward $128k, $141K and even $150K remains valid. Those targets are measured extensions based on the original flag pole, and given how price is behaving, they’re not unrealistic.
Momentum is strong, but rallies like this often pause before the next move. I’ll be watching how price behaves if it dips into the demand zone. Clean volume and rejection candles there could offer solid re-entry setups for the next leg higher.
Are you riding this wave, trimming profits, or waiting for the dip reload? Drop your thoughts below. Let’s see how everyone’s navigating this phase.
📌 Follow for more clean, structured setups no hype, just charts.

Bitcoin may make correction movement to support levelHello traders, I want share with you my opinion about Bitcoin. Price recently printed a new ATH at 118800 points and then began to show signs of correction. Before this breakout, the price was stuck in a long downward channel, where it bounced inside the buyer zone (103000–103800) several times and reversed upward. After the final breakout, BTC entered a range phase between the support level (103800) and the support area (110300–111300), building energy before the massive move. Once the price escaped this range, a strong impulse up followed, pushing BTC above all major levels and reaching a new high. However, after hitting the ATH, the price started to stall and consolidate. Currently, we can see signs of weakness at the top — the structure is forming lower highs and looks unstable, which may indicate a potential retracement. Now the price is trading above the support area, but I expect a corrective move back toward the current support level at 110300. This level aligns with the top of the previous range and now acts as strong demand. That’s why I’ve set my TP at 110300 level — right at the beginning of potential buyer interest. Please share this idea with your friends and click Boost 🚀
Disclaimer: As part of ThinkMarkets’ Influencer Program, I am sponsored to share and publish their charts in my analysis.

EURUSD is close to the end of its correctionEURUSD is consolidating in a wedge. The trend is bullish, with the correction reaching the 0.7 Fibonacci zone and making a false breakout, which generally changes the market imbalance.
All attention is on the wedge resistance (red line) and the 1.17000 level. A breakout of the resistance and consolidation of the price above this level will confirm the end of the correction and send the price higher.

Can Ripple hit $3.40 with 15% upside soon?Hello✌
let’s dive into a full analysis of the upcoming price potential for Ripple📈.
BINANCE:XRPUSDT is poised to challenge the $3.40 level soon, supported by a notable increase in market volume 📊. This price zone also coincides with a key support area aligned with sharp Fibonacci levels, offering a strong base for potential upward movement 🔥.
✨ Need a little love!
We pour love into every post your support keeps us inspired! 💛 Don’t be shy, we’d love to hear from you on comments. Big thanks , Mad Whale 🐋

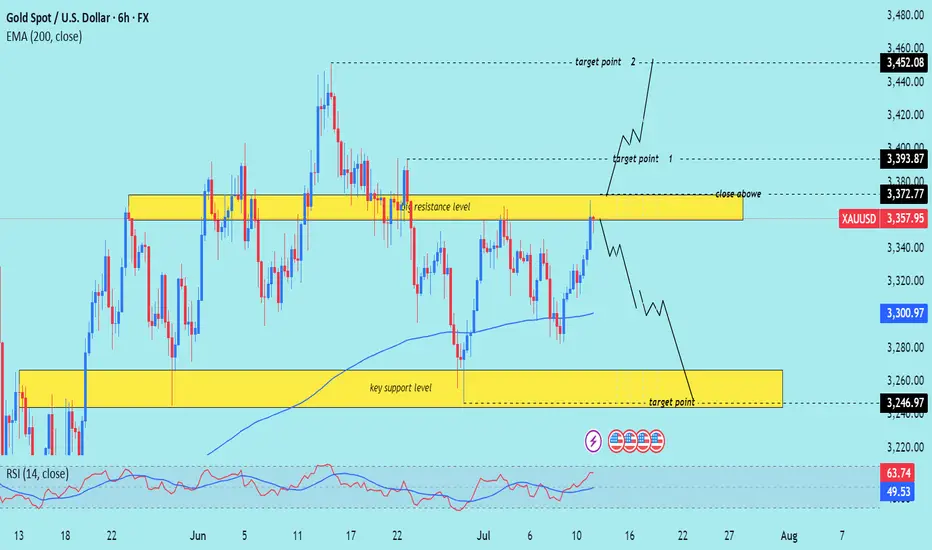
XAU/USD technical analysis setup Read The captionSMC trading point update
Technical analysis of (XAU/USD) on the 6-hour timeframe, focusing on a key resistance zone that could trigger either a bullish breakout or a bearish reversal.
---
Analysis Summary
Current Price: $3,357.95
Trend Context: Price is testing a strong resistance zone with a possible breakout or rejection in play.
---
Scenario 1 – Bullish Breakout
1. Resistance Zone: $3,357–$3,372
Multiple previous rejections.
A confirmed close above $3,372.77 signals bullish strength.
2. Upside Targets:
Target 1: $3,393.87
Target 2: $3,452.08
3. Indicators:
RSI at 63.74, approaching overbought but still with room to rally.
EMA 200 is trending upward, supporting bullish bias.
---
Scenario 2 – Bearish Rejection
1. If price fails to close above $3,372.77, a rejection from resistance is likely.
2. Downside Targets:
Reversal projected toward the key support zone at $3,246.97
EMA 200 at $3,300.97 may provide temporary support before breakdown.
---
Trade Ideas
Direction Entry Level Stop-Loss Target 1 Target 2
Bullish Close above $3,372 Below $3,346 $3,393.87 $3,452.08
Bearish Rejection from $3,357–$3,372 Above $3,380 $3,300 → $3,246.97
Mr SMC Trading point
---
Summary
This is a critical decision point for Gold. A breakout above resistance can propel price to $3,450, while rejection could drive price back to $3,246. The reaction at the current zone will dictate the next major swing.
Please support boost 🚀 this analysis)
BITCOIN High after High going for the Cycle Top!Bitcoin (BTCUSD) made a new All Time High (ATH) today, just north of $123000 and shows absolutely no signs of stopping there!
The brilliantly structured 2.5-year Channel Up (blue) that has been dominating the entirety of the current Bull Cycle since the November 2022 market bottom, has been on its latest Bullish Leg since the April 07 2025 rebound on the 1W MA50 (blue trend-line).
The 1W MA50 has been the Cycle's natural Support level since the March 13 2023 bullish break-out, never broken after, just like it has been for the 2019 - 2021 Bull Cycle (excluding of course the Black Swan event of the March 2020 COVID crash).
In fact the similarities of the whole 2022 - 2025 Cycle are strong with the 2018 - 2021 Cycle. Similar Bear Cycles of -80% on average, followed by strong Lower Highs break-outs and subsequent consolidations within the 0.786 - 0.618 Fibonacci range, takes us to today with the April 2025 1W MA50 bounce resembling the July 2021 one.
Eventually, that Bullish Leg led to the Cycle's Top a little above the 1.618 Fibonacci extension. The market seems to be only one step away of completing that past pattern and if it does, BTC may hit $170000 before the Cycle peaks.
Do you think that is a likely scenario after today's new fresh ATH? Feel free to let us know in the comments section below!
-------------------------------------------------------------------------------
** Please LIKE 👍, FOLLOW ✅, SHARE 🙌 and COMMENT ✍ if you enjoy this idea! Also share your ideas and charts in the comments section below! This is best way to keep it relevant, support us, keep the content here free and allow the idea to reach as many people as possible. **
-------------------------------------------------------------------------------
💸💸💸💸💸💸
👇 👇 👇 👇 👇 👇

BITCOIN's Situation (1h) !!!The triangle pattern will break in the direction it is breached, and the price will move in that direction. In my opinion, the price could be corrective and may correct down to $115K.

Gold Building Momentum for Potential Upside MoveGold is holding strength above the ascending trendline while testing a critical resistance zone on the 3-hour chart, indicating a potential bullish continuation pattern. The recent 35% tariff on Canada and 15% to 20% on other countries announced by Trump is helping gold to rise as traders seek safety amid rising trade tensions and potential inflationary pressures. Price action shows buyers defending dips near the support zone while respecting the Ichimoku cloud structure, signalling readiness for a breakout if resistance is cleared. Market uncertainty is driving demand for gold, aligning with the bullish structure as the trendline remains intact. Volatility is expected to increase with the tariff developments, and a clean breakout above resistance can open the way for further upside, while maintaining disciplined risk management remains essential in this environment. Continue to monitor price action near the resistance zone for confirmation of continuation toward higher levels in the coming sessions.
Entry: Buy 3320/3326
Target: 3400
Stop Loss: 3304
If you found this analysis helpful, don’t forget to drop a like and comment. Your support keeps quality ideas flowing—let’s grow and win together! 💪📈

Gold 30Min Engaged ( Dual Entry's Detected )Time Frame: 30-Minute Warfare
Entry Protocol: Only after volume-verified breakout
🩸Bullish Reversal 3357 Zone
🩸Bearish Reversal 3357 Zone
➗ Hanzo Protocol: Volume-Tiered Entry Authority
➕ Zone Activated: Dynamic market pressure detected.
The level isn’t just price — it’s a memory of where they moved size.
Volume is rising beneath the surface — not noise, but preparation.
🔥 Tactical Note:
We wait for the energy signature — when volume betrays intention.
The trap gets set. The weak follow. We execute.
15.07.25 Morning ForecastPairs on Watch -
FX:EURUSD
CAPITALCOM:DE40
FX:EURGBP
FX:GBPJPY
A short overview of the instruments I am looking at for today, multi-timeframe analysis down to what I will be looking at for an entry. Enjoy!

BTC Breakout is Real Flag Playing Out with Wave 3 MomentumBitcoin is looking really clean here. After weeks of sideways grind inside what looked like a consolidation trap, the structure has finally matured into something meaningful, a classic bullish flag breakout layered inside a broader Elliott Wave count.
What really stands out is how the flag structure (B → C) formed a smooth pullback after the strong A → B impulse. That was the pole. Now we’ve broken out of the flag, and momentum is picking up again, likely heading into wave (3) of the new leg pointing towards D.
This isn’t just about a flag the entire move is developing inside a wide ascending channel, and price is following it almost perfectly. The bullish momentum coming off the breakout zone is clean, no choppiness just strong candles and impulsive drive.
We might get a short-term breather (sub-wave 4 of current wave 3), but structure suggests more upside is likely as long as price holds above that $113K–$115K zone.
What I'm Watching Right now:
Support zone: $113K – $115K
Short-term target: $123-$127K
Final projection (if channel holds): $140K–$145K
Measured move from the flag and wave count both point up there, so I’ll be watching for minor pullbacks as entry opportunities.
Personal Take
I like when patterns align naturally not forced. This one’s got that nice blend of momentum, structure, and price behavior. I’m not rushing entries here, but will scale into dips if price holds support and volume confirms.
Have you spotted this setup on your end too? Drop your view in the comments always keen to see how others are reading this.
Follow for clean, no hype market breakdowns.

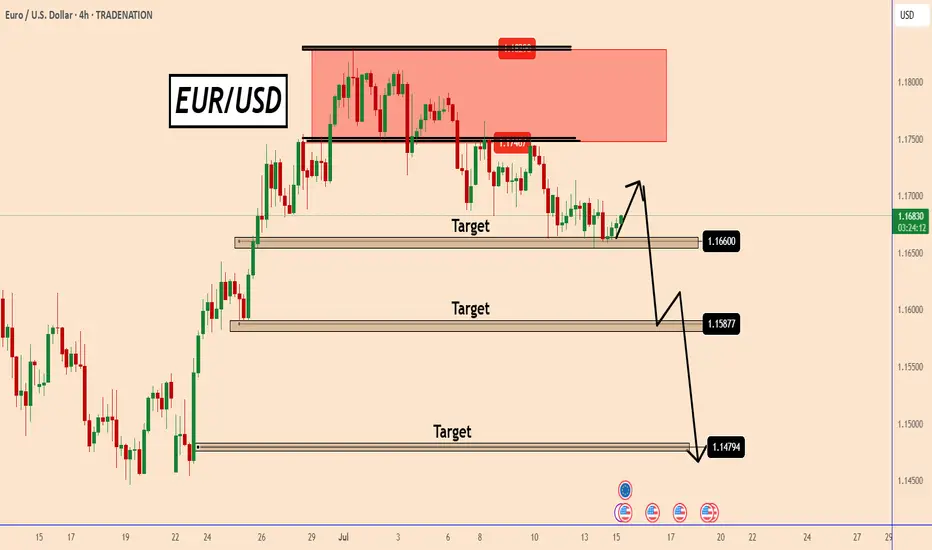
EURUSD: Bigger Bearish Move is PossibleEURUSD: Bigger Bearish Move is Possible
EURUSD is positioned to fall further from the bearish pattern it is showing. The market is hesitant to fall further after we get the CPI data today. The US is expected to report a growth of 2.7% vs. 2.4% last month.
The impact of the data is unclear in my opinion because the market is not paying much attention to the data, but it should definitely increase the market volume which is decreasing in these summer days.
You may find more details in the chart!
Thank you and Good Luck!
PS: Please support with a like or comment if you find this analysis useful for your trading day
Disclosure: I am part of Trade Nation's Influencer program and receive a monthly fee for using their TradingView charts in my analysis.
SOLANA's Situation, A Comprehensive Analysis (1h) !!!The price on the 1-hour timeframe is within an ascending triangle, which can be promising. If the price breaks this pattern with bullish candles, it could easily rise by the distance of AB=CD .
Best regards CobraVanguard.💚

Bitcoin Prediction that will blow your mind (warning for bulls) I am showing you that BTC made new ATH only in the USD pair and not in other pairs like EUR, and why, and what you can anticipate and what to watch out for from #Bitcoin next.

ADA - Beginning of something crazy- ADA is looking forward to the successfully breakout of the trendline resistance.
- A clean breakout from this resistance must to fuel the bullish trend.
- I'm expecting a target of 3$ from this trend.
Entry Price: 0.72
Stop Loss: 0.4838
TP1: 0.8602
TP2: 1.0342
TP3: 1.3379
TP4: 2.0144
TP5: 2.4818
TP6: 3.0329
Stay tuned for more updates
Cheers
GreenCrypto

Pol (POL): 3 Good Trading Setups We Caught | July 2025POL coin is in a pretty volatile spot where we might get a really good trade from here once we see the confirmations we talked about in the video. 3 good trading opportunities, where the mid-term trade looks the best out of them all!
P.S. idk why but called Pol coin polyatomic multuple times so do not pay attentions to that :)
More in-depth info is in the video—enjoy!
Swallow Academy

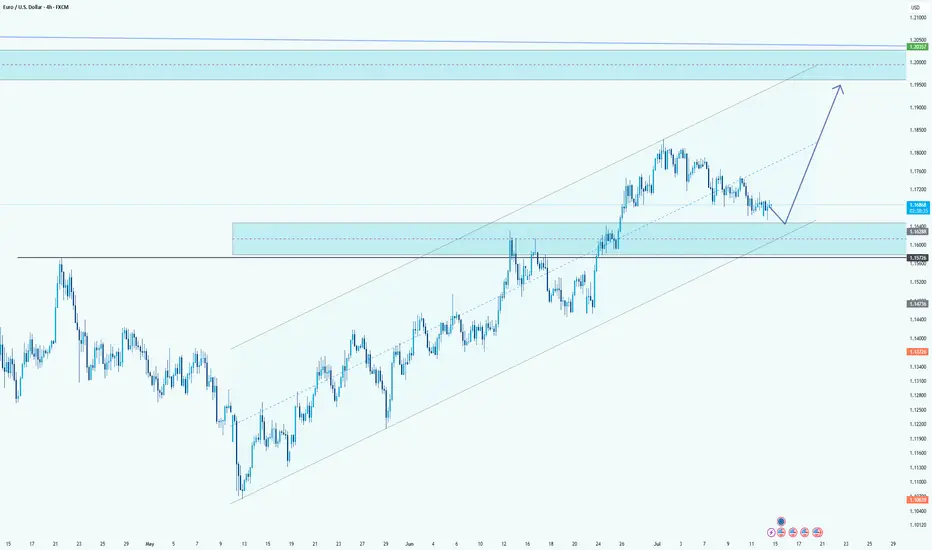
EUR/USD Retracement Into Demand ZoneHello guys!
EUR/USD is currently undergoing a healthy retracement after an extended bullish trend within the ascending channel. The price is now approaching a key demand zone, which aligns perfectly with the mid-line of the channel structure.
This zone previously acted as a strong resistance area and is now expected to serve as support, confirming a classic flip in market structure. The reaction around the 1.16288 - 1.15774 area will be crucial.
If buyers step in here, the bullish momentum is likely to resume with the next major target being the upper resistance zone near 1.20000 , as projected by the upward arrow. The overall structure remains bullish as long as the price holds above the channel support and doesn't close below the last demand zone.
GBPAUD - Trading The Range - AGAIN!Hello TradingView Family / Fellow Traders. This is Richard, also known as theSignalyst.
📈GBPAUD has been hovering within a big range.
Last week, as per our previous analysis, GBPAUD rejected the upper bound of the range and traded lower.
This week, GA is retesting the lower bound of the range acting as a support.
As long as the support holds, we will be looking for longs on lower timeframes, targeting the upper bound of the range.
📚 Always follow your trading plan regarding entry, risk management, and trade management.
Good luck!
All Strategies Are Good; If Managed Properly!
~Rich
Disclosure: I am part of Trade Nation's Influencer program and receive a monthly fee for using their TradingView charts in my analysis.
