Silver short term potential correction within a bull marketSilver short term potential correction within a bull market. Either way...
Don't leverage. Buy ETF or physical, and hold.
Chart Patterns

ATAI Bulls break to weekly higher highsNASDAQ:ATAI Bulls break to weekly higher highs, making 3.06 Monday's low now THE most important support level going forward.
Support: 4.04, 3.66, 3.61
Resistance: 4.29, 4.52

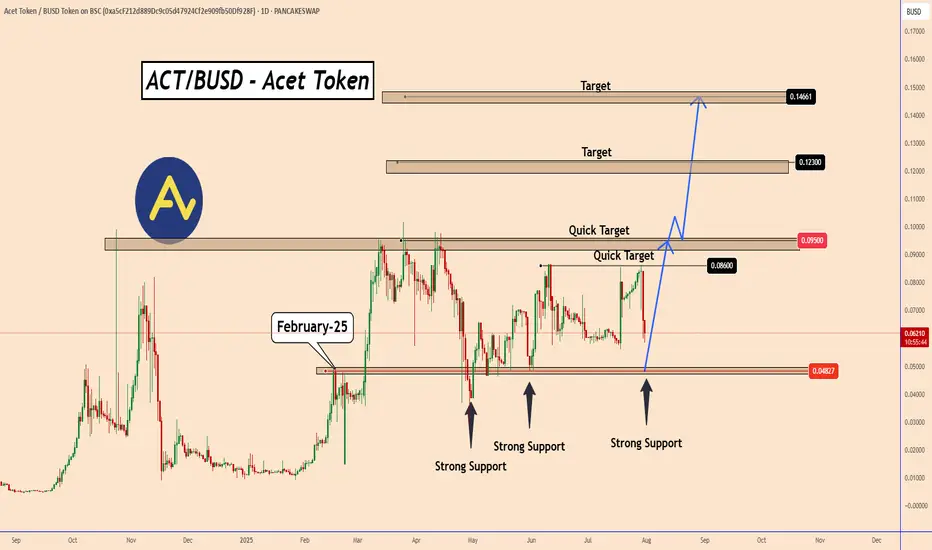
ACT Token: Ready to Break out from Months of AccumulationACT Token: Ready to Break out from Months of Accumulation
Price Outlook – ACT Token Since February 2025, ACT Token has been consolidating within a wide trading range between 0.0480 and 0.0950—a nearly 97% price spread from support to resistance. This prolonged accumulation offers a decent opportunity.
Currently, price action is hovering near the support zone again, hinting at a potential bullish breakout.
Historically, ACT’s impulsive moves have unfolded in aggressive waves, and with months of accumulation behind us, the likelihood of a breakout above 0.09500 has increased.
Key Upside Targets:
Minor resistance levels: 0.08600 and 0.09500
Breakout extension: 0.1230 and 0.14660 if momentum accelerates
We’ll follow the price development step by step, as the structure suggests a greater upside potential is in play.
You may find more details in the chart!
Thank you and Good Luck!
PS: Please support with a like or comment if you find this analysis useful for your trading day
Platinum Wave Analysis – 31 July 2025- Platinum broke support zone
- Likely to fall to support level 1200.00
Platinum recently broke the support zone located between the key support level 1340.00 (low of the previous minor correction iv) and the support trendline of the daily up channel from May.
The breakout of this support zone accelerated the c-wave of the active ABC correction 4.
Given the bearish sentiment across the precious metals markets, Platinum can be expected to fall to the next support level 1200.00 (target for the completion of the active wave c).
fart long entry soon as per analysisits not afinancial advice #dyor
evry thiong is mentioned on chart as u can see clearly
and this is strongly bullish until turn this below order block to breaker blok with heavy volume

ETH BUY SETUP ,Bought From $3830ETH BUY SETUP
Currently $3830
Bought From $3830
(Trading plan If ETH go down ,
to $3700 will add more longs)
Expecting target $3890 OR ABOVE
Stoploss at $3470
In the event of an early exit,
this analysis will be updated.

Johnson & Johnson Wave Analysis – 31 July 2025 Johnson & Johnson reversed from the resistance zone
- Likely to fall to support level 160.00
Johnson & Johnson recently reversed down from the strong resistance zone located between the long-term resistance level 168.15 (upper border of the weekly sideways price range from 2023) and the upper weekly Bollinger Band.
The downward reversal from this resistance zone stopped the earlier intermediate impulse wave (3).
Given the strength of the resistance level 168.15 and the overbought weekly Stochastic, Johnson & Johnson can be expected to fall to the next support level 160.00.

DXY USDOLLAR CRASH Incoming!Long-term fundamentals are bearish
Long-term sentiment = bearish
Long-term technicals = bearish
Trump wants a weaker dollar + FED injecting endless amounts of cash into the markets
driving stocks/ gold up, and the dollar down, losing purchasing power.
My plan is to look for shorts on the 1hr-4hr timeframe with lower timeframe confirmation.
Once price starts turning over, day-traders can join in.
Agree or disagree?

Next Leg down startingThe S&P 500 has been trading inside this rising channel for the last 3 and a half years. As you can see it has bounced off the bottom of the rising channel 4 different times and it is now back at the top of the channel. Price action gapped above the channel overnight but immediately sold off pre-market back inside the channel and completely reversed the move despite strong earnings from MSFT and META. This is very bearish and signals a move back down to the bottom of the channel once again and given that its already bounced off the bottom of the channel 4 different times, a 5th hit would have a high probability of breaking below the channel, which I would give a greater than 70% probability of playing out. If this happens, we will see much lower prices in this coming bear market.

Money Flow - 2### Money Flow Spread from DJI to Cryptocurrency: A Fibonacci Perspective
The financial markets operate in an interconnected ecosystem where capital flows between asset classes based on macroeconomic trends, investor sentiment, and risk appetite. One such dynamic involves the movement of funds from traditional markets like the **Dow Jones Industrial Average (DJI)**—a barometer of blue-chip stocks—to emerging asset classes such as **cryptocurrencies**. This phenomenon can often be analyzed using **Fibonacci retracements and extensions**, which serve as powerful tools for identifying key support, resistance, and potential price targets during shifts in market momentum.
#### 1. **Market Sentiment and Capital Rotation**
- The DJI represents large-cap equities that are heavily influenced by institutional investors, central bank policies, and global economic conditions. When these factors trigger volatility or uncertainty in traditional markets, investors may seek alternative investments with higher growth potential or hedging properties.
- Cryptocurrencies, known for their decentralized nature and high volatility, attract speculative capital during periods when confidence in traditional assets wanes. For instance:
- During bearish trends in the DJI, characterized by falling prices and increased selling pressure, some investors might reallocate portions of their portfolios into cryptocurrencies like Bitcoin (BTC) or Ethereum (ETH).
- Conversely, bullish trends in the DJI could signal improved risk appetite, prompting a portion of crypto gains to rotate back into equities.
#### 2. **Fibonacci Retracements: Identifying Key Levels**
- Fibonacci retracement levels are derived from the Fibonacci sequence and are widely used in technical analysis to predict areas of support and resistance. These levels (e.g., 23.6%, 38.2%, 50%, 61.8%) help identify potential turning points in price action.
- In the context of money flow from the DJI to cryptocurrencies:
- A significant decline in the DJI could lead to a pullback to Fibonacci retracement levels (e.g., 38.2% or 61.8%). At these junctures, traders may reassess their positions and consider diversifying into cryptocurrencies.
- Similarly, after a sharp rally in cryptocurrencies, prices might retrace to Fibonacci levels before continuing upward. Investors exiting equities due to underperformance might view these retracements as entry points for digital assets.
#### 3. **Fibonacci Extensions: Projecting Price Targets**
- While retracements focus on corrective moves within a trend, Fibonacci extensions project potential price targets beyond the initial move. Common extension levels include 127.2%, 161.8%, and 261.8%.
- In scenarios where money flows out of the DJI and into cryptocurrencies:
- If the DJI experiences a prolonged downtrend, its losses could coincide with outsized gains in cryptocurrencies. Fibonacci extensions can help forecast how far crypto prices might rise amid this influx of capital.
- For example, if Bitcoin breaks above a key resistance level following a surge in inflows from equities, traders might use Fibonacci extensions to estimate future price milestones (e.g., $100,000 or $200,000).
#### 4. **Psychological Drivers Behind the Transition**
- Fibonacci levels resonate with traders because they align with natural human tendencies toward symmetry and proportion. This psychological aspect amplifies their relevance when analyzing cross-market dynamics.
- As money exits the DJI and enters cryptocurrencies, Fibonacci-based trading strategies provide a framework for understanding how participants perceive value across different asset classes. For instance:
- Institutional investors exiting equities might anchor their decisions around Fibonacci-derived thresholds, ensuring disciplined entry and exit points in volatile crypto markets.
- Retail traders, who dominate much of the cryptocurrency space, also rely on Fibonacci tools to time their trades, creating self-reinforcing patterns that influence overall market behavior.
#### 5. **Case Study Example**
- Imagine a scenario where the DJI drops sharply due to rising interest rates or geopolitical tensions. The index falls from 35,000 to 30,000—a decline of approximately 14%. Traders observe Fibonacci retracement levels at 38.2% ($31,900) and 61.8% ($33,100), expecting temporary bounces at these levels.
- Simultaneously, Bitcoin rallies from $20,000 to $30,000 as investors seek refuge in digital gold. Using Fibonacci extensions, analysts project further upside to $38,200 (127.2%) or even $48,500 (161.8%), attracting additional capital from equity markets.
#### 6. **Conclusion**
- The interplay between the DJI and cryptocurrencies highlights the fluidity of modern financial markets. By leveraging Fibonacci retracements and extensions, traders can better anticipate shifts in money flow and position themselves strategically.
- Whether driven by macroeconomic headwinds, technological innovation, or evolving investor preferences, the migration of capital from traditional indices like the DJI to digital assets underscores the growing convergence of old and new finance. Fibonacci analysis serves as a bridge, offering insights into both the timing and magnitude of these transitions.

BONK : Best of luck to you...Hello friends🙌
👀Considering the decline we had, you can see that the price was supported by buyers and broke the specified resistance. Now, in the price correction, there is a good opportunity to buy with risk and capital management and in steps and be patient until the specified targets are reached.
🔥Follow us for more signals🔥
*Trade safely with us*

High Tight FlagDefinitive released an update to their trading product and a roadmap as well, which seemed to be well received by the market. Now developing a high tight flag on lower time frames. RSI reset.
Backed by Coinbase Ventures, among others

Gold Next Move (Read description). Hello, Traders.
As you saw we have achieved our target at last ideas.
This week gold is running in down trend, today it has touched the price 3268 and then gold pumped.
As you see guys, gold has breakout the last support area and its support became resistance.
Gold has changed the character according to H1 and there is break of structure (BOS).
The trend is bearish, so gold needs to fall, it can fall till 3351.
Comment positive feedbacks, Thanks.

BTC : The future of Bitcoin...Hello friends🙌
👀According to the price history, the price has always been bullish and is in a long-term bullish channel.
📈Now that the price is struggling in the middle of the channel and is gathering strength for a big move, which is expected to break the middle of the channel in the form of a resistance or middle channel, the price will move to the ceiling of the channel.
⚠Don't forget risk and capital management.
🔥Follow us for more signals🔥
*Trade safely with us*

LIVE TRADEHello friends🙌
Given the good trend we had, now that we have had a price correction, we can enter the trade with risk and capital management and move towards the specified goals.
🔥Follow us for more signals🔥
*Trade safely with us*
CADJPY Will Keep Growing!
HI,Traders !
#CADJPY keep growing and
The pair made a bullish breakout
Of the key horizontal level
Of 108.198 and the pair is
Already retesting the new
Support and we will be
Expecting a further
Bullish move uP !
Comment and subscribe to help us grow !

$ADA Macro ThesisGD To all
I have cleaned up and thrown a few other correlated patterns on the Chart for my Macro thesis.
You will have to watch the metrics and on chain data as well as sentiment to verify as we move fwd.
This is Pattern recognition on a Log Chart:
BINANCE:ADAUSD
I have been using this thesis since 2019 and have been able to successfully ident general buy/sell points ( weighing against real world events and on chain data )
I hope it helps you and feel free to ask questions.
Told ya I like crayons

MEW : A meme coin that hasn't grown yetHello friends🙌
Given the decline we had, you can see that buyers entered the specified support area and entered the price into the ascending channel. That is why we can buy with risk and capital management and stay with it until the specified targets.
🔥Follow us for more signals🔥
*Trade safely with us*

BTC:LIVE TRADEHello friends🙌
📉Given the decline we had, we now had a good price rebound in the specified support area, which shows the power of buyers. Now, with capital and risk management, we can buy at the specified points in a stepwise manner and move to the specified targets.
🔥Follow us for more signals🔥
*Trade safely with us*

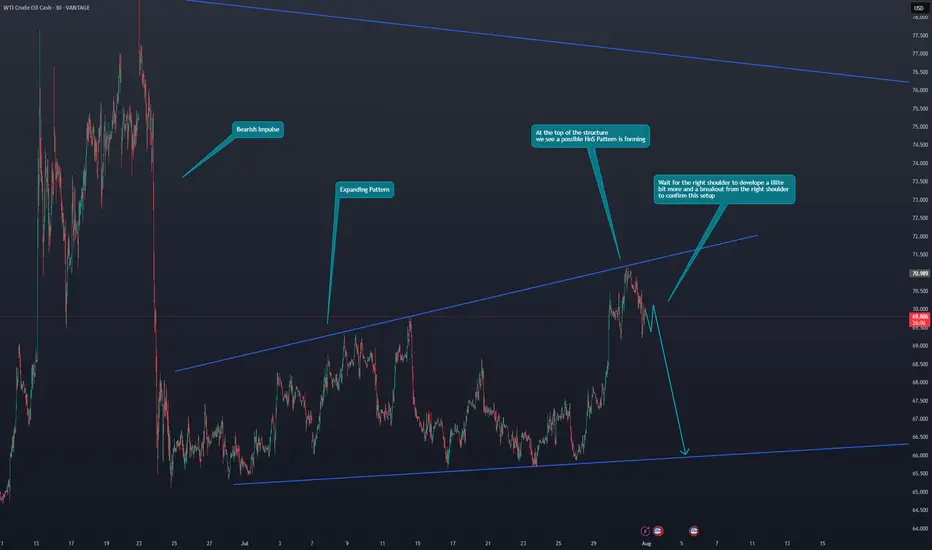
US OIL Potential ShortHi Traders.
Wait for the right shoulder to develope a lillte
bit more and a breakout from the right shoulder
to confirm this setup

Price Doing Exactly What We Predicted… so farGBPUSD tapped the exact bottom of our marked channel and bounced — just as forecasted.
📌 Price respected structure to the pip
📌 Stoch RSI curling up right as expected
📌 Channel still in play, eyes on midline next
⏱️ Timeframe: 1H
#gbpusd #forex #chartprediction #backtest #channeltrading #technicalanalysis #tradingview

btc short tradeon 1hr timeframe btc take the inducement and on 15m done MSS and now rice going to retest the 15m advanced oder block
entry 19131
stoploss 120990
target 1; 114685
target 2 ; 113650
