Opening A Small Position In FARTCOIN HereGood Morning Trading Family,
I may be a little early here, but at $1.00, I can't resist. I am picking up a small position in FARTCOIN here. I have three targets above. Each will eventually be hit IMO, but for now, I will only be shooting for TARGET #1. I may sell half at that point and let the rest ride.
Now, here are the technical reasons for making my entry here without waiting for my indicator to signal.
First of all, there are three trendlines, all significant, all converging at this one particular point, making this a powerful area of confluence!
Secondly, we broke to the topside of that descending trendline but never really came back to kiss mamma goodbye. Today we are doing that! This is a patent technical move that indicates healthy price fluctuation and is exactly what I have been waiting for.
Third, the VRVP indicates a ton of volume in this area (mostly buyer), which will be tough to break below without significant FUD, which, of course, is always a possibility.
Finally, all of my lower indicators show this thing is starting to get oversold: RSI, MACD, Chalkin MF, HA.
If we do dip lower, I will simply increase my position unless I hit my SL first. My SL is around .78 with my projected first target at 1.66 for a nice 1:3 rrr.
Good luck, all!
✌️Stew
Chart Patterns

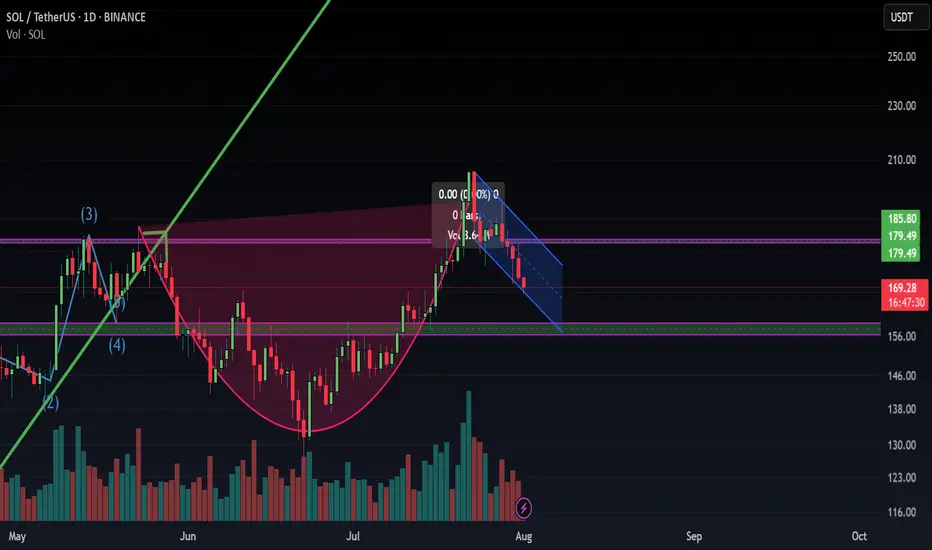
$SOL Loses Key Support | Eyes on $140 & $95 Zones📉 CRYPTOCAP:SOL Loses Key Support | Eyes on $140 & $95 Zones
🕵️♂️ On the daily timeframe, #Solana has officially lost its key support near $140, which previously acted as a strong bounce zone. A failure to reclaim this level could open the gates for a deeper drop toward the $95–$100 support range.
📊 Indicators signal downside:
RSI is trending downward
MACD shows a bearish crossover
Stochastic RSI confirms continued selling pressure
⚠️ Macro pressure adds fuel to the fire: August 1st tariff tensions, with expected news from Trump on charging Paris, are weighing down global risk assets. Historically, August tends to be a bearish month for crypto markets.
🎯 Key Levels to Watch:
Immediate Resistance: $140
Major Support: $95–$100
🧠 Trade wisely and manage risk accordingly.

MSFT - Should you Buy All Time Highs?Hello everyone, I’m TheCafeTrader.
Next up in our breakdown of the MAG 7 is Microsoft (MSFT) — this post focuses on a long-term swing trade setup.
For short-term analysis, head to my profile and check out the latest posts.
⸻
💡 The Setup:
MSFT continues to ride a strong wave thanks to AI growth, especially with Copilot and its projected impact on revenue.
Several analysts have price targets ranging from $550 to $600, which still leaves 10–20% upside from current levels.
As of this writing, MSFT closed at $511.70, about 9% above its previous all-time high — and it got there in just five weeks.
Momentum is strong, and there’s no clear sign of slowing down.
⸻
📈 Is Now a Good Time to Buy?
Let’s look at two possible strategies:
⸻
Dollar-Cost Averaging (DCA) vs. Lump-Sum Investing
If you’re unfamiliar with DCA: it’s a strategy where you buy in gradually over time.
Say you have $5,000 set aside for MSFT — you might invest $1,000 now and continue adding monthly.
This is a smart approach in choppy or uncertain markets, but MSFT is not showing weakness right now.
Historically, when strong stocks are in clear bull trends, lump-sum investing outperforms DCA.
So if you’re confident in MSFT’s long-term potential — and want exposure to the current momentum — a full position now could make sense.
If you’re looking for a better price or want to scale in patiently, keep an eye on these key zones.
⸻
🧭 Areas of Interest on the Chart:
1. Yellow Box (Target Zone):
→ $550–$600 is the broader analyst price target range.
2. First Demand Line (~$500):
Recent signs of active buyer interest. If bulls remain in control, this could act as a springboard.
3. Reinforced Buyer Zone (~$472–$474):
This area has been tested and defended before. It’s a strong pullback entry if momentum stalls.
4. Second Demand Line (~$449):
A previous base of institutional accumulation. Price may revisit here in a broader market dip.
5. Deep Buyer Zone (~$344–$365):
A rare but powerful level where big money entered aggressively. It’s unlikely we revisit this zone — but if we do, it could be a great buy.
⸻
🧠 Strategy Summary:
• Aggressive buyers may consider entering around $500, where recent demand appeared.
• More patient traders might wait for MSFT to pull back into the $449–$474 range, where institutional interest has been high.
• The $344–$365 zone is a long shot — but would be a massive value area if touched.
⸻
That’s it for the long-term outlook on MSFT.
For more short-term trades and entries, check out my other posts — especially as we continue tracking the MAG 7.
@thecafetrader

BNB - the strangest coin on the market? Almost no one trades it, and volumes have been falling for the second year in a row. But at the same time, it is the only token on the market that is in an upward flag. It is showing an even stronger trend than Bitcoin.
Yes, we are talking about BNB. Here's why you should pay attention to this token:
➡️ Money Flow shows divergence with the price, positions continue to close, and liquidity is gradually disappearing. However, over the past year and a half, the token's liquidity has hardly ever been in the negative zone.
Meanwhile, Bitcoin spent months in this zone, reaching values of -0.20. BNB barely touched the negative zone and immediately rebounded. This speaks to people's crazy faith in the token. There are simply no sellers.
➡️ Volume - purchase volumes have also diverged and continue to decline. BNB reached its current ATH on negligible volumes, which again highlights the complete lack of sellers. Even now, at the new ATH.
➡️ Liquidity Depth - as we know, the price moves from liquidity to liquidity. And now it is dozens of times greater at the bottom than at the top. This potentially hints at a local correction.
Also, during the growth, a GAP formed at the level of $576 - $502. And as we know, 99% of GAPs close sooner or later. But there is only one GAP and it is small, since BNB is a fairly low-volatility token and is traded quite effectively on its way up.
➡️ It is also the only one of the market leaders currently in an ascending flag, which means that the token has not yet seen a correction.
📌 Conclusion:
The chart looks obviously great, but there is local overheating, which will definitely be removed sooner or later. So BNB looks promising for shorting if it does not hold at $796.
However, Binance is certainly doing an excellent job of promoting its token with all these Launchpads and so on. So it is worth looking at a major correction to build up a spot position in BNB.
Subscribe and stay tune with more impactful ideas on trend tokens!

BTC/USDT Analysis: Testing Strong Support
Hello everyone! This is the daily analysis from CryptoRobotics' trader-analyst.
Yesterday, we tested the local support zones previously marked and moved into a decline. At 21:00 (GMT+3), the U.S. Federal Reserve released its monetary policy statement, which included hawkish comments regarding inflation risks. The interest rate remained unchanged. The market reacted negatively to this news, and Bitcoin accelerated its drop.
At one point, a key buyer zone at $116,200–$115,000 (volume anomalies) was tested. Then, between 21:30 and 22:00 (GMT+3), a report from the White House on digital assets was released, shifting focus toward a more positive regulatory outlook. Bitcoin bounced from the mentioned zone and has since fully recovered the drop.
Currently, there are no immediate resistance levels, so in the near term, we’re likely to see a test of the ~$120,000 level. There, it's important to watch for any signs of selling pressure.
Buy Zones:
• $116,200–$115,000 (volume anomalies)
• $110,000–$107,000 (accumulated volume)
This publication does not constitute financial advice.

Analysis BTC/USD Daily ChartAnalysis BTC/USD Daily Chart
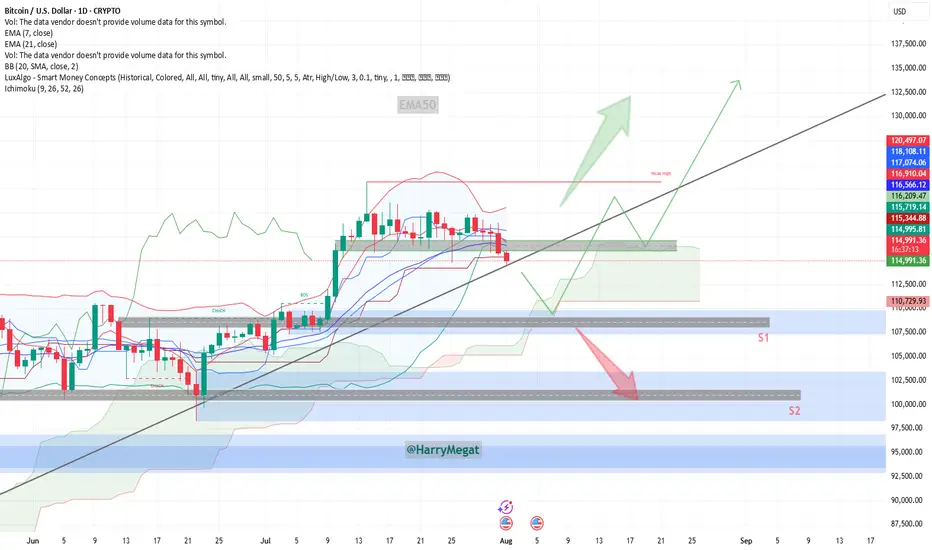
**Chart Overview (Daily Timeframe)**
**Current Price**: \~\$114,937
**EMA 7**: \$116,896 (short-term)
**EMA 21**: \$116,561 (medium-term)
**Trendline**: Price is testing the long-term ascending trendline
**Key Zones:**
* **Support 1 (S1)**: \~\$110,000
* **Support 2 (S2)**: \~\$102,000
* **Immediate Resistance Zone**: \~\$116,000–\$120,000
**Bullish Scenario**
**Conditions**:
* Price **holds above the ascending trendline**
* A strong **bounce from current level (\~\$115K)** or a reclaim above **\$116K**
**Buy Setup**:
* **Entry**: \$115,000–\$116,000 (if bounce confirmed)
* **Stop-loss**: Below \$114,000 or the ascending trendline
* **Targets**:
* TP1: \$120,000
* TP2: \$125,000
* TP3: \$132,000+
**Confirmation**:
* Bullish candle formation near the trendline
* Reclaim of EMAs (especially EMA 7)
**Bearish Scenario**
**Conditions**:
* Price **breaks below the ascending trendline** and **closes below \$114K**
* Rejection from \$116K zone with a strong red candle
**Sell Setup**:
* **Entry**: Below \$114,000 (on confirmed breakdown)
* **Stop-loss**: Above \$116,000
* **Targets**:
* TP1: \$110,000 (S1)
* TP2: \$105,000
* TP3: \$102,000 (S2)
**Invalidation**:
* Quick recovery above \$114.5K and trendline reclaim = possible fakeout
**Bias**
**Neutral to Bullish**, as price is **at trendline support**.
Watch closely for **price reaction at current levels** for the next directional trade.
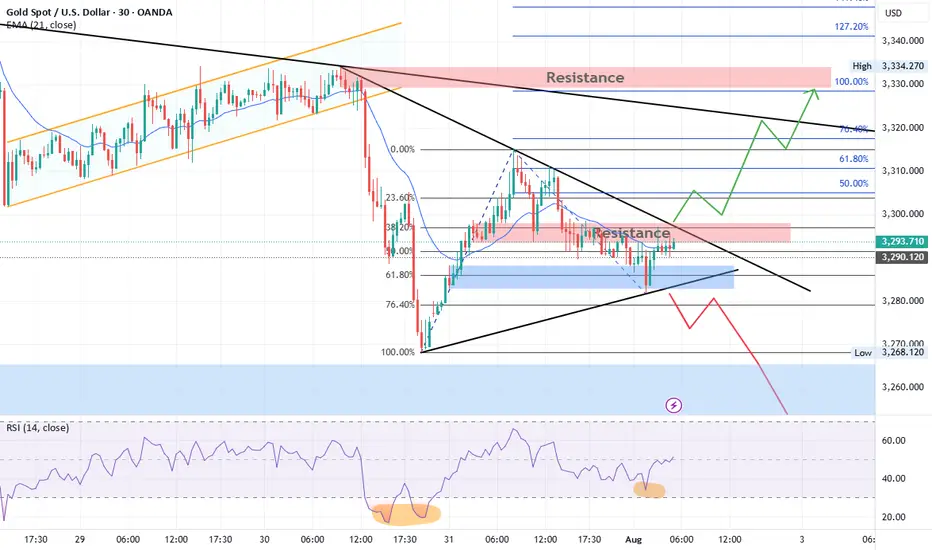
I maintain my #3,277.80 and #3,252.80 TargetsI didn't engaged any re-Sell orders throughout yesterday's session and re-Sold Gold on #3,295.80 ahead of Asian session, with plan to keep orders over-night. However due NFP, Gold might be stationary / ranging until the news as I closed both of my orders on #3,291.80 / each #9.000 Eur Profit and my #3,300.80 pending Sell limit has been triggered over-night which is now running in Profits with Stop on breakeven. I do expect #3,277.80 and #3,252.80 Targets to be met within #1 - #3 sessions and if there aren't NFP numbers, I would keep all three orders / set of Selling orders maintaining my first #3,277.80 Target. Due the news, Gold might fluctuate within Neutral Rectangle until the news.
Technical analysis: My earlier Selling configuration / Technical expectations was confirmed on Hourly 4 chart under prolonged weakness and Price-action respecting the trend-line guarding the downtrend (very Bearish formation) as Hourly 1 chart is already an aggressive Descending Channel (width opened on Williams) that should reach it’s next local Low’s (currently Trading slightly below Double Bottom) and Oversold state near my take Profit of #3,252.80 benchmark. If the bands are widened Traders may witness #3,277.80 test, also if gets invalidated and #3,270.80 gives away, #3,252.80 mark extension test is inevitable. In any case I will update my Targets or levels of Profit taking if I decide to exit earlier than #3,252.80 benchmark to be in accordance with the Daily chart’s period / I already ride Selling wave since #,3,300's and my Profit will be already good to ignore.
My position: DX is soaring, Gold is under Bearish Technical developments and #3,252.80 benchmark is my final Target of current Selling leg. Only factor which can reverse this Intra-day but not postpone is NFP. I expect downside Jobs surprise which may reverse DX from local High's however hot upside surprise will make Gold test #3,252.80 Intra-day. NFP or not I do believe Gold is Bearish. Trade accordingly.

this is familier patternis this a cup of tea pattern? i see a cup and handle this is a sign of bullish in next week
XAUUSD:Swing Sell Is Highly Likely! Get ReadyWe expect a smooth drop in gold prices, with prices potentially dropping around the 3250 area. Use Accurate Risk Management.
Please like and comment!
Team Setupsfx_
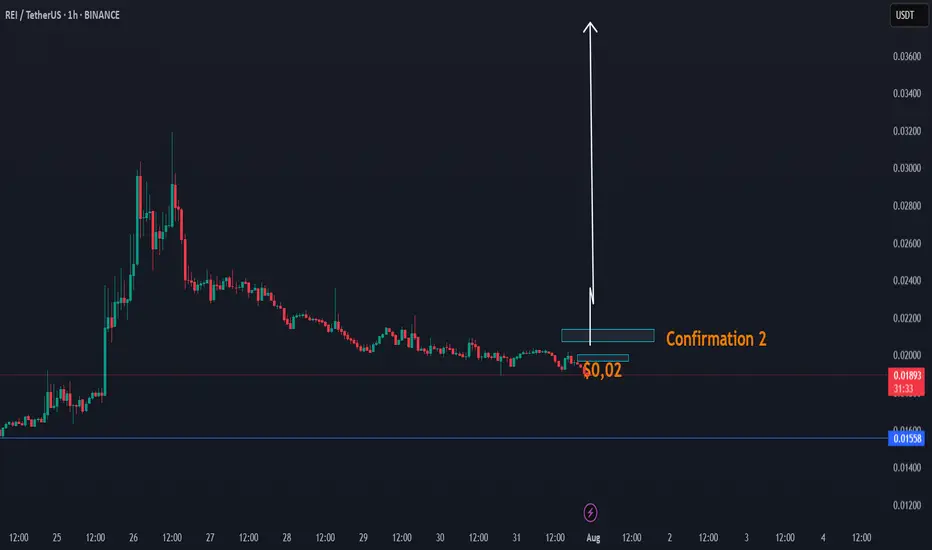
DAY UPDATE REI/USDT THE INCREASE CANDLE OF UP $0,03 - $0,05REI is an interesting coin since the update of Q4
We have seen that this coin was able to increase to $0,031 and until here $0,018 zone, a return to where we are now. There is a high chance that this coin can recover next 24H if this coin is able to confirm the confirmation $0,02 - $0,021
This coin, as before, was targeted at $ 0.02 and had low volume. We expect that if it comes back to $ 0.02, it will be confirmation of the volume, which can take the trend with a candle to up $0,03
REI CONFIRMATIONS ZONE
Higher time frame
When you look normally at this coin, then this coin is in a trend line of breakdown. This can change with the next confirmations. The question is, are we going to see again $0,02 the next 24h? If yes high chance of a break.
We also have a cycle update 2025, check it here, expecting $0,90
GBPJPY Will Fall!
HI,Traders !
#GBPJPY has retested a
Horizontal resistance level
Of 198.903 so we are
Locally bearish biased
And from the resistance we
We will be expecting a
Local bearish correction !
Comment and subscribe to help us grow !

short IdeaLooking at the hourly chart, and I am noticing a head and shoulders build up.
day trade idea: 635 entry 637 stop 630 profit target
swing trade idea: short above 630 long below

Gold Crashes $100 After Hitting Monthly High | What’s Next?In this video, I break down everything that moved the price of gold last week, from the early-week rally toward $3,430 to the sharp midweek drop toward $3,325. We go beyond the surface, diving into what caused the reversal, and how I'm approaching next week’s market using a simple ascending channel on the 4-hour chart.
With major events like the FOMC rate decision, U.S. GDP, PCE inflation, NFP and the August 1 tariff deadline all on the radar, this analysis will help you stay grounded and prepare for volatility.
👉 If you find this content valuable, don’t forget to Boost, Comment, and Subscribe for weekly market breakdowns.
Disclaimer:
Based on experience and what I see on the charts, this is my take. It’s not financial advice—always do your research and consult a licensed advisor before trading.
#goldanalysis, #goldforecast, #xauusd, #goldpriceprediction, #technicalanalysis, #fundamentalanalysis, #tradingstrategy, #forextrader, #priceaction, #fomc, #usgdp, #pceinflation, #goldtrading, #forexeducation, #dollarvsgold, #tariffnews, #chartanalysis, #forexmentorship, #rebuildingthetraderwithin


XAUUSDXAUUSD breakout falling channle and resistance zone.
Buy above 3295
Stop Loss: 3291
1st TP: 3308
2nd TP: 3313
3rd TP: 3322
4th TP: 3333

EUR/USD Technical OutlookEUR/USD is currently trading within a Descending Triangle formation. At present, the pair shows a higher probability of an upside breakout from this structure. A confirmed break above the immediate resistance zone at 1.1428 – 1.1430 could accelerate bullish momentum, opening the way toward the next key resistance level at 1.1485.
On the other hand, if the pair fails to sustain above the triangle and breaks to the downside, price may extend losses toward the 1.1375 – 1.1360 support area. From this zone, a potential corrective rebound could occur before the broader bearish trend resumes.
Overall, short-term direction hinges on the breakout of the descending triangle, with 1.1428 – 1.1430 as the critical level to watch for bulls, and 1.1375 – 1.1360 for bears. FOREXCOM:EURUSD

Gold Technical Outlook
Gold is currently consolidating inside a triangle pattern. After a recent bullish rally, price retraced between the 61.8% – 76.4% Fibonacci levels, finding support and bouncing upward. At present, gold is facing resistance at both the falling trendline and the 3298–3300 zone.
Bullish Scenario:
A breakout above the resistance trendline and the 3298–3300 zone could trigger a strong bullish move toward 3311, 3322, and 3333. A sustained break above 3333 would confirm a short-term bullish trend, opening the way for higher targets at 3360 and 3400.
Bearish Scenario:
If price faces rejection from the 3300 resistance and the falling trendline, gold is expected to move lower, retesting 3270. A decisive break below 3270 may extend the decline toward 3250. If 3250 is broken, gold could enter strong bearish momentum, potentially shifting the long-term trend to the downside with targets at 3000 and 2850.
OANDA:XAUUSD Gold Technical Outlook
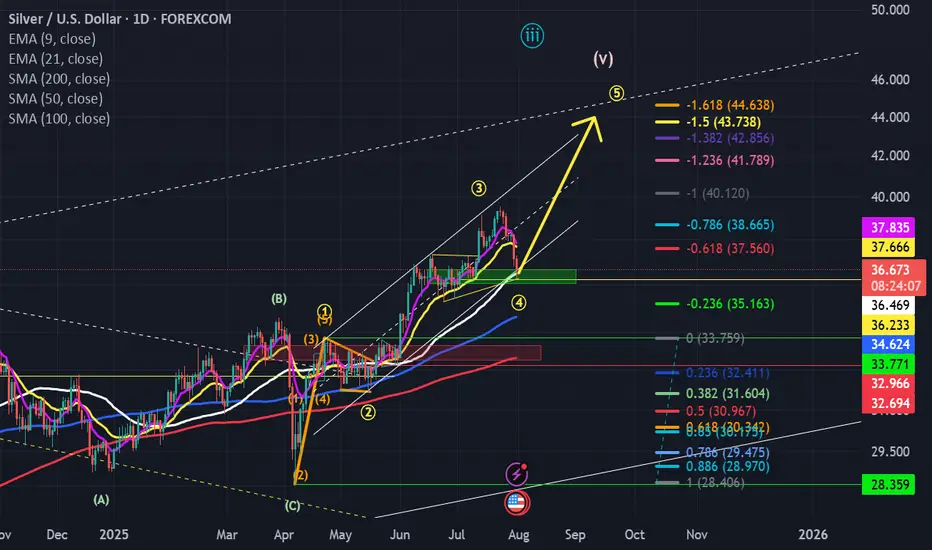
One more move up and then we should sell for now....This pb has allowed the shorts to cash in...we are at signficant support (middle of prior funnel) and the bottom of the channel...in my opinion, we resume the move up...but I think $42-$44 zone is the likely pivot pt for a significan move back down...back to mid to low $30's...This current pb is will shake off the weak hands! However, let this be a lesson...avoid leverage or you may pay dearly....
gold 4ooo projectionHello, me thinks gold is ready for a midterm correction, which in turn can propel it to 4ooo. This is just an idea, not financial advice. Cheers

BTCUSD – Bullish Recovery Setup Forming Near Trendline Support🧠 Market Structure & Technical Breakdown
The BTCUSD 4H chart showcases a well-formed descending triangle or falling wedge structure with clearly respected major and minor descending trendlines. Currently, price action is testing a dynamic support zone, highlighted in green, which has been a strong reaction area in the past.
This area aligns with a bullish accumulation zone, from which buyers have previously stepped in to initiate impulsive moves. Given the confluence of diagonal support and horizontal price reactions, we may be on the verge of a bullish breakout opportunity.
📍 Key Zones & Trendlines
✅ Green Support Channel (Demand Zone): Acting as a key pivot for multiple recent rejections, this area (~114,000–113,000) is now being revisited again, offering potential buy interest.
📉 Minor Trendline: A short-term descending resistance around 120,000—likely the first barrier in case of a bounce.
📉 Major Trendline: A more extended dynamic resistance line connecting swing highs, currently intersecting near the 124,000 region.
🔄 Potential Price Scenarios
Primary Bullish Setup (MMC Plan):
Price bounces off the green demand zone.
Breaks above the minor trendline (~120K).
Pullback retest to confirm breakout.
Continuation toward the major breakout level (~124K and beyond).
Invalidation / Bearish Case:
A clean breakdown below 113,000 with strong bearish momentum would negate this setup, likely targeting the psychological support near 110,000.
🧠 MMC Mindset: Trade with Patience & Confluence
This is a classic accumulation-to-breakout scenario. Smart traders wait for confirmation—especially as BTC often exhibits false breakdowns before a major move. Monitor candle behavior, volume, and reaction to the minor trendline.
Let the market show signs of strength (like bullish engulfing, pin bars, or a breakout-retest) before committing to the upside. Avoid FOMO; the key is discipline and precision entry at structural break points.
✅ Trade Plan Summary:
Watch zone: 113,000–114,500 for bullish price action
Breakout level: Minor trendline (~120,000)
Target zone: 123,500–124,000 (Major resistance)
Stop-loss idea: Below 112,800 (Invalidation of structure)

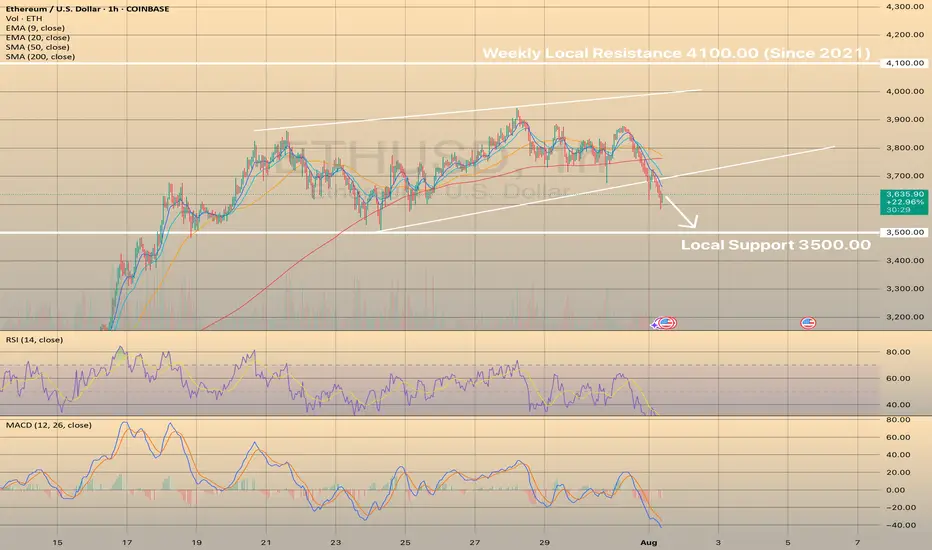
ETHUSD BROKE THE LOWER BORDER OF THE WEDGE. PRICE IS MOVING TOWAETHUSD BROKE THE LOWER BORDER OF THE WEDGE. PRICE IS MOVING TOWARDS THE LOCAL SUPPORT.
Yesterday, Ethereum saw its largest monthly increase since July 2022, thanks to strong inflows into exchange-traded funds and increased activity in the Ethereum treasury. US exchanges are working to obtain regulatory approval for a standardized framework for listing crypto funds. Coinbase and JPMorgan have joined forces to provide Chase customers with access to crypto products.
Despite these positive developments, the short-term outlook does not indicate a bullish setup. It appears that all the information has already been factored into the price. The pair moves towards the local support of 3,500.00. However, in the long term, these developments are favorable for investment.
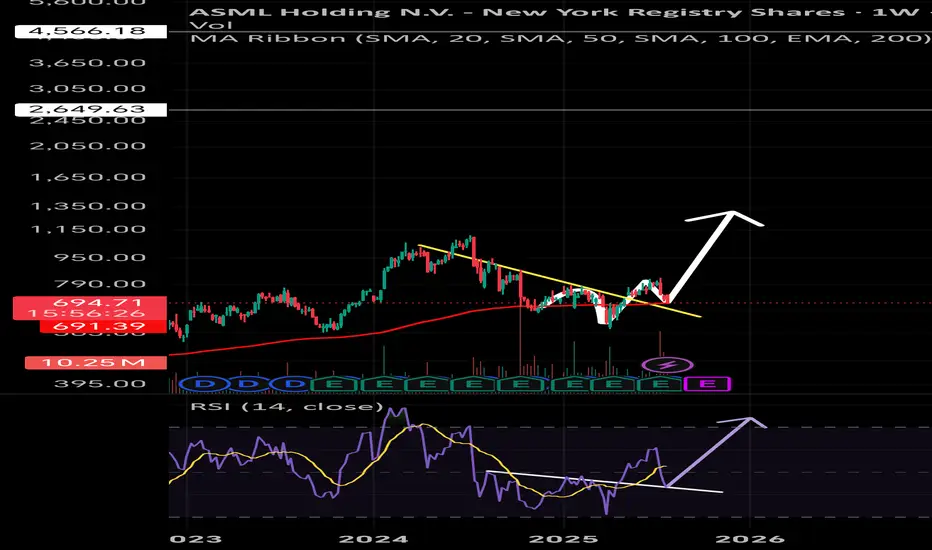
ASML : All inASML currently retesting the 200 weekly EMA support trendline.
Expecting ,Bullish trend reversal structure,
Ladt night already positioned heavily in this stock,
Pray this will play out as planned
😬🙏🙏😬
Ethereum's futile attempt to go up.Ethereum’s pointless push and unnecessary insistence on going up — if it really wants to hit a new ATH, it needs to drop first, both to take a breather and to let buyers with lower buy orders get into the game.
