Is the US dollar taking a breather against the Japanese yen?After the recent rebound of the US dollar following two quarters of decline, the USD/JPY pair has been on an upward trajectory, forming a series of higher highs on both the 4-hour and daily charts.
However, the recent drop below the 146.515 level and the formation of a new low suggests a potential shift in trend on the 4-hour timeframe from bullish to bearish. This could signal a possible pullback in the short to medium term, with the first short-term target located at the 146.084 level.
The bearish scenario would be invalidated if the price rises above 147.179 and a 4-hour candle closes above that level.
Chart Patterns

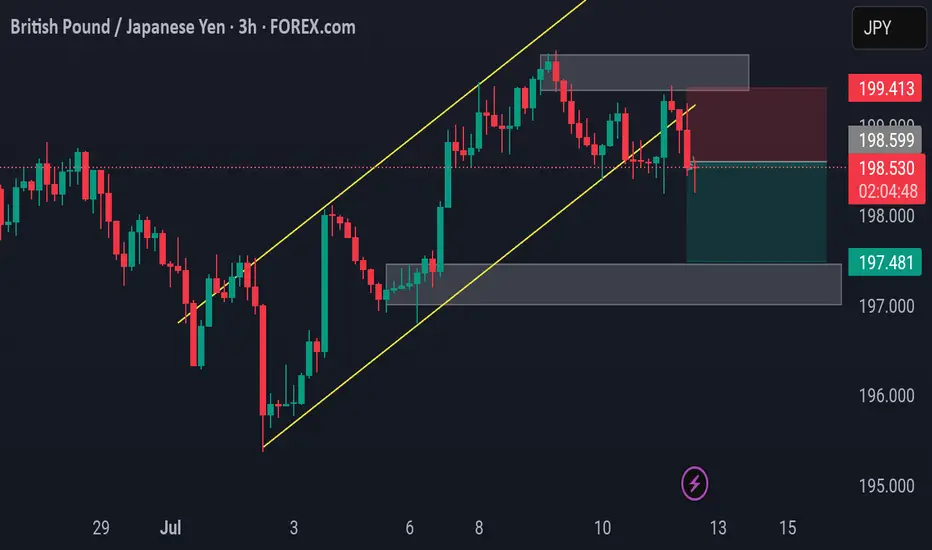
GBP/JPY – Channel Break and Bearish Rejection
🔹 3H Chart by PULSETRADESFX
After a strong bullish trend within a rising channel, GBP/JPY has now broken structure to the downside. Price rejected the resistance zone around 198.599 – 199.413, followed by a sharp bearish candle close beneath the ascending trendline support.
This signals a shift in market sentiment, with sellers taking control and aiming for the next demand level at 197.481.
📌 Trade Breakdown:
Entry: 198.536
Stop Loss: 199.413 (Above supply)
Target: 197.481 (Major demand zone)
A classic break-retest-drop setup is in play here. Unless price reclaims 199.00+ with volume, this short bias remains valid.
---
✅ Key Confluences:
Rising channel break
Supply zone rejection
Bearish momentum confirmation
Risk-to-reward > 1:2 setup
📅 July 11, 2025
📊 Forex.com Feed via TradingView
#GBPJPY #ForexAnalysis #PriceAction #BearishSetup #SupplyZone #TechnicalAnalysis #TradingView #PULSETRADESFX
NXPC/USDT +200%NXPC/USDT recently experienced a healthy 75% correction, which appears to be part of a larger accumulation phase rather than a breakdown. Over the past two weeks, the price action has established strong support, signaling that the bears may be exhausted and a potential trend reversal is underway.
Currently, NXPC is trading above the $1 psychological level, confirming buyer strength. For optimal entries, we will wait for a healthy retracement into the $0.92–$1.00 demand zone, which aligns with the newly formed support and offers a favorable risk-reward setup for a potential continuation to the upside.

#WLD/USDT#WLD
The price is moving within a descending channel on the 1-hour frame and is expected to break and continue upward.
We have a trend to stabilize above the 100 moving average once again.
We have a downtrend on the RSI indicator that supports the upward move with a breakout.
We have a support area at the lower limit of the channel at 0.900, acting as strong support from which the price can rebound.
Entry price: 0.913
First target: 0.944
Second target: 0.971
Third target: 1.004

HYPE/USDT -3 digit HYPE is currently ranked among the top 11 cryptocurrencies, backed by a fundamentally strong project with a highly credible team behind it. Market sentiment and investor interest are rising rapidly, and the long-term potential is undeniable.
Price has successfully reclaimed the $42 level, which previously acted as a major resistance zone. This breakout signals the beginning of a potential macro uptrend.
Given the current structure and momentum, we are targeting a three-digit price zone as a medium to long-term setup — a move that aligns with both technical structure and fundamental strength.

GHST/USDT +100%GHST/USDT is looking strong on the daily time frame after successfully reclaiming the key $0.39 zone a major structural level. This reclaim signals a clear shift in momentum, with strong buyer interest stepping in to support the move.
The price structure is showing early signs of a bullish reversal with clean higher lows and increasing volume. If the market provides a pullback into the green demand box (between $0.42–$0.38), it would be a prime opportunity to start a DCA .

Natural Gas Bearish crab pattern may form may fall from here too due to wave structure and trend line resistance diametric pattern F wave also appear to forming.
View may change as per market structure.
Not SEBI registered RA or IA , personal view.

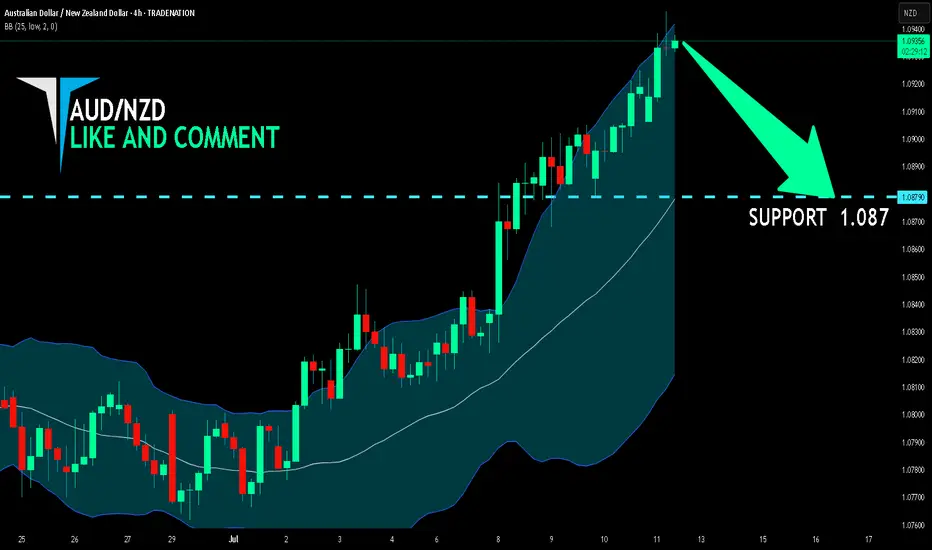
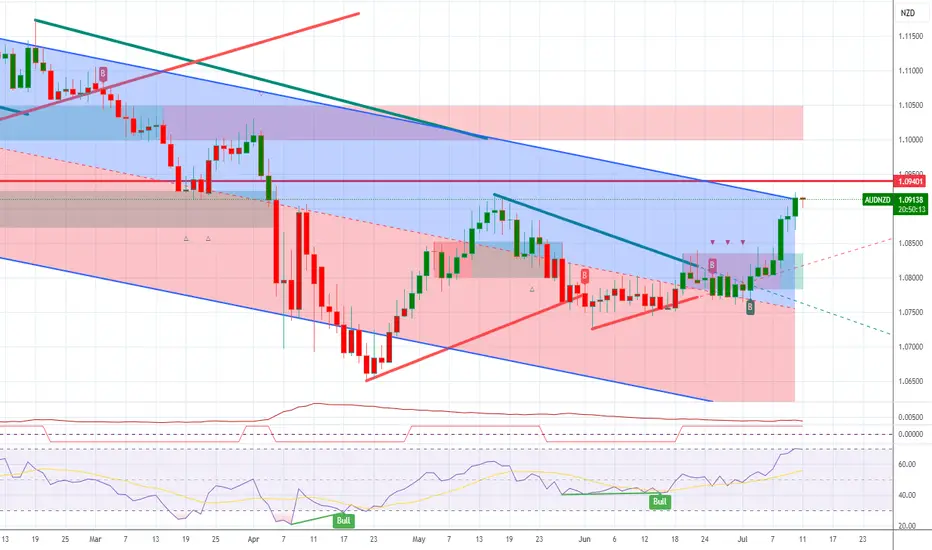
AUD/NZD SHORT FROM RESISTANCE
Hello, Friends!
AUD/NZD pair is in the downtrend because previous week’s candle is red, while the price is clearly rising on the 4H timeframe. And after the retest of the resistance line above I believe we will see a move down towards the target below at 1.087 because the pair is overbought due to its proximity to the upper BB band and a bearish correction is likely.
Disclosure: I am part of Trade Nation's Influencer program and receive a monthly fee for using their TradingView charts in my analysis.
✅LIKE AND COMMENT MY IDEAS✅
USDCAD (U.S. Dollar/Canadian Dollar) long (buy) setupUSDCAD (U.S. Dollar/Canadian Dollar) long (buy) setup. Here's the breakdown:
**Setup Overview**
* **Entry Level:** Around 1.3700
* **Take Profit (TP):** 1.3812 (upper green zone)
* **Stop Loss (SL):** 1.3638 (lower red zone)
**Technical Observations**
* Price is bouncing from a rising trendline (diagonal black line), suggesting bullish support.
* Price is trading above the 50 EMA, 21 EMA, and 7 EMA — indicating bullish momentum.
* A strong bullish candle with high volume occurred before consolidation, showing buyer interest.
* Tight consolidation near the entry level suggests potential for a breakout continuation upward.
**Bias**
* **Bullish** bias as long as price remains above the trendline and EMAs.
* The trade offers a favorable risk-to-reward ratio, targeting a \~110 pip gain vs. \~60 pip risk.
*Summary**
The chart shows a bullish trade setup on USDCAD based on trendline support, EMA alignment, and volume confirmation. A breakout above 1.3700 aims for 1.3812, while invalidation lies below 1.3638.

Bitcoin : Missed $100K? Don’t Miss What’s Coming Next!!MARKETSCOM:BITCOIN BINANCE:BTCUSDT continues to show exceptional strength and strong bullish momentum. When we look back at the charts from 2023 and 2024, a clear and reliable pattern stands out. Each time Bitcoin touched the 50 EMA on the weekly chart, it triggered a significant rally that led to new all-time highs. That same setup appears to be forming once again.
MARKETSCOM:BITCOIN tested the 50-week EMA around the $75,000 level and has since bounced with conviction. The price has reclaimed the $100,000 mark and is now challenging previous all-time high resistance. Historically, a successful bounce from this key moving average has not only signaled recovery but also sparked explosive upside moves.
Following this repeating pattern, the current cycle target is positioned at $150,000. A clean breakout above the current resistance zone could act as the trigger that launches Bitcoin into uncharted territory. The technical structure remains bullish, momentum is clearly accelerating, and the overall trend continues to favor the upside.
This moment represents a textbook Buy and HODL opportunity. Technical indicators are aligning, market sentiment is turning increasingly optimistic, and all signs suggest that Bitcoin could be preparing for another historic rally. Stay ready for what could be the next big move.
Follow Our Tradingview Account for More Technical Analysis Updates, | Like, Share and Comment Your thoughts

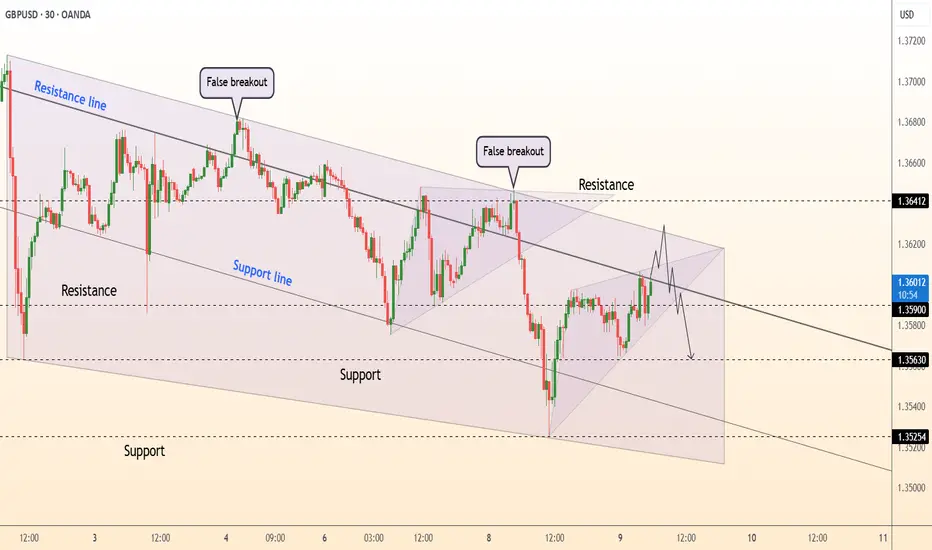
DeGRAM | GBPUSD will continue to correct📊 Technical Analysis
● Two false breakouts at the channel roof (1.3640 ±) underline supply; price is now carving successive lower-highs beneath the blue resistance line inside a 7-day falling channel.
● Fresh bearish rejection of 1.3605 leaves a descending triangle whose base aligns with 1.3563 support; a 30 min close below it exposes the lower rail / June pivot at 1.3525.
💡 Fundamental Analysis
● BoE Chief Economist Pill repeated that “further evidence of disinflation” is needed but rates are “sufficiently restrictive”, reviving August-cut bets, while firm US wage-inflation keeps Fed easing priced farther out—widening the short-rate gap in the dollar’s favour.
✨ Summary
Sell 1.3590-1.3610; break < 1.3563 targets 1.3525. Bear view void on an H1 close above 1.3640.
-------------------
Share your opinion in the comments and support the idea with a like. Thanks for your support!
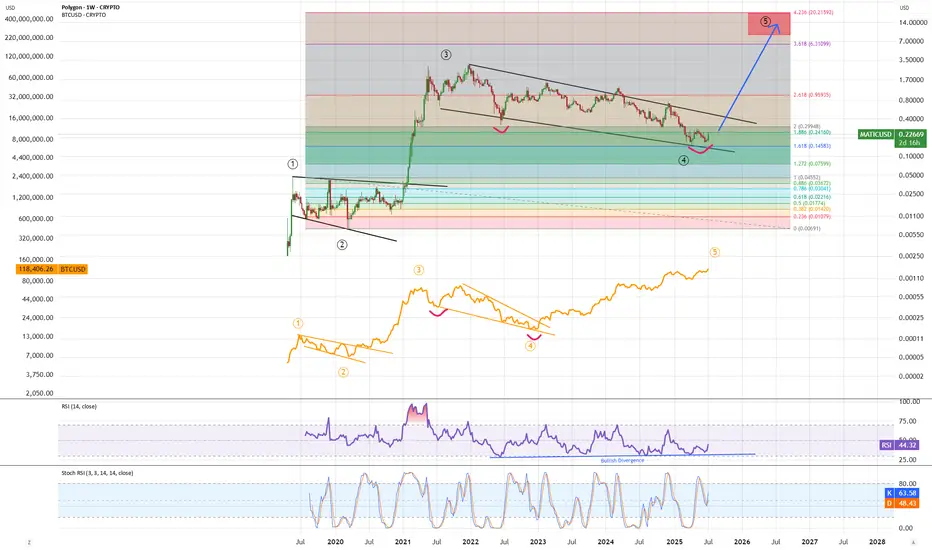
MATIC - time for impulse to new ATH!MATIC is doing same moves as BTC did just with a lag. We are oversold with bullish divergence in a falling wedge formation. Just like BTC did I expect Matic to breakout of falling wedge formation and push to new ATH for blowoff top - after that likely correction back to current level so make sure to secure profits on time.
XRP/USDT MEXCAll 5 indicators with a short box and Fibonacci trend. My short is at 2.54. I'm hoping for sub $2 prices

AUDUSD – The Spring Is Loading!AUDUSD has just pulled off an impressive rebound from the 0.6460 support zone, bouncing cleanly off the ascending trendline — like a compressed spring ready to launch. The repeated appearance of Fair Value Gaps after recent upward moves reveals a critical clue: smart money is stepping back in, and this time, they want control.
The price is now testing the familiar resistance at 0.6616 — a zone that has previously rejected several bullish attempts. But this time feels different. The US dollar is clearly losing steam after softer CPI data, pushing bond yields lower and giving AUD a tactical edge.
If the 0.6520 support holds strong, the next breakout won’t just be about overcoming resistance — it could be the spark for a new bullish wave. And when that wave hits... it won’t go unnoticed.

GBPJPY – Correction Pressure Is Building UpGBPJPY is still trading within a well-defined ascending channel on the H4 chart. However, recent signals suggest a potential short-term correction. The price has repeatedly rejected the upper boundary of the channel and is now forming a distribution pattern with lower highs. The FVG zone near 200.400 may act as a short-term take-profit area before price pulls back toward the support zone around 198.400, which also aligns with the lower trendline.
Additionally, the upcoming UK GDP data this week could strongly impact GBP. If the data comes in weaker than expected, downside pressure may intensify and reinforce the developing correction scenario. Traders should monitor price action around 198.400 for confirmation of the pullback.

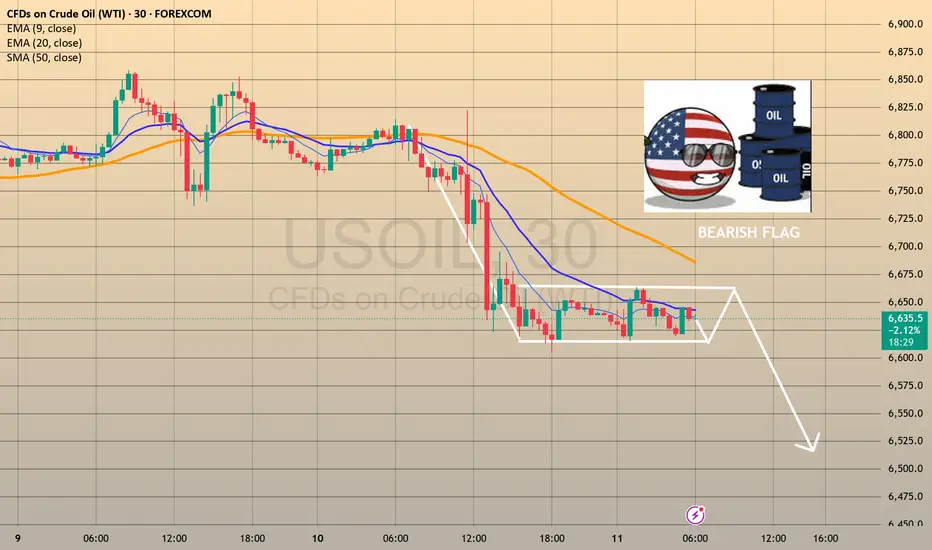
TRADING IDEA - US CRUDE OIL - BEARISH FLAG, CONCERNS ON GLOBAL EFOREXCOM:USOIL
The US Crude Oil prices went down yesterday, mostly because of the tariffs and concerns on demand.
Here is what the Bloomberg is writing: " OPEC+ is discussing a pause in its oil production increases from October is fueling concerns about a slowdown in global energy demand. In addition, the intensification of US tariffs risks slowing global economic growth and energy demand after President Trump ramped up tariffs on numerous countries this week, including a 50% tariff on Brazil."
So, despite the pause in oil production increase, which is supposed to be bullish factor the oil prices, we may see the slowdown in global economy and supposedly a recession because of Trump's tariffs. This is a long-term bearish factor for the oil. I think that we will see another bearish impulse here, according to what we observe on the chart.
There is a nice bearish flag and i am planning to short it with a target nearby 6,540.00 support level.
🔽 a pending sell stop order at 6615.3 with
❌a stop loss at 6680.9 and
🤑a take profit at 6544.0
Trade cautiously! Preserve your deposits!
EUR USD SHORT RESULT Price faked out of the resistance Trendline of the major 4HTF ascending range and showed signs of weakness in momentum and to the downside.
From where I took the short position, it moved down nice but the NFP news volatility took out my trailing stop. But overall moved in our direction 🔥
_THE_KLASSIC_TRADER_.

Bullish bounce>WTI Oil (XTI/USD) is falling towards the pivot which acts as a pullback support and could bounce to the 1st resistance.
Pivot: 65.65
1st Support: 63.74
1st Resistance: 68.24
Risk Warning:
Trading Forex and CFDs carries a high level of risk to your capital and you should only trade with money you can afford to lose. Trading Forex and CFDs may not be suitable for all investors, so please ensure that you fully understand the risks involved and seek independent advice if necessary.
Disclaimer:
The above opinions given constitute general market commentary, and do not constitute the opinion or advice of IC Markets or any form of personal or investment advice.
Any opinions, news, research, analyses, prices, other information, or links to third-party sites contained on this website are provided on an "as-is" basis, are intended only to be informative, is not an advice nor a recommendation, nor research, or a record of our trading prices, or an offer of, or solicitation for a transaction in any financial instrument and thus should not be treated as such. The information provided does not involve any specific investment objectives, financial situation and needs of any specific person who may receive it. Please be aware, that past performance is not a reliable indicator of future performance and/or results. Past Performance or Forward-looking scenarios based upon the reasonable beliefs of the third-party provider are not a guarantee of future performance. Actual results may differ materially from those anticipated in forward-looking or past performance statements. IC Markets makes no representation or warranty and assumes no liability as to the accuracy or completeness of the information provided, nor any loss arising from any investment based on a recommendation, forecast or any information supplied by any third-party.

EURUSD PullbackYesterday, EURUSD continued its pullback, reaching 1,1660.
The next support levels to watch are 1,1636 and 1,1591.
Keep an eye on price action around those support levels for potential buying opportunities.
At the current levels, there’s no reason to enter a trade yet!

Inside to higher Although the S&P 500 daily chart broke to the downside the Asia session is indicating buyers are supporting this market. It implies an inside day within Thursday’s range to a higher close going into the weekend.

AUDNZD LongAUDNZD is now net long, and this is it's first break in months.
I am reviewing all AUD pairs.
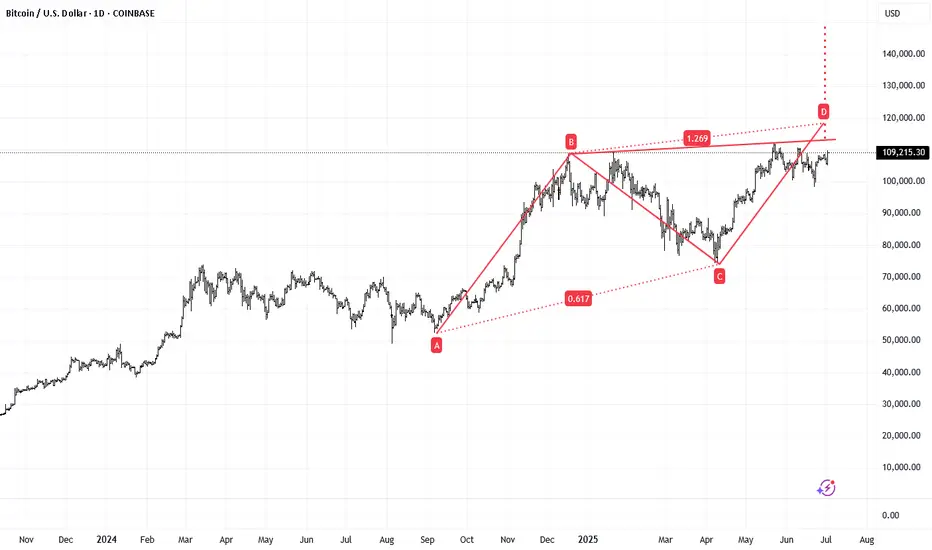
BTCUSD Bullish Medium-termBTCUSD is about to start the bull run.
Break of 113000 will target 118,000 before 150,000 in the coming 4 months.