GOLD - Monthly breakout retest may confirm multi-year bull cycleHello everyone, what are your thoughts on the long-term outlook for XAUUSD?
Looking at the monthly chart (1M), we can clearly see that XAUUSD has broken out of the long-standing ascending channel that has held since 2015 — a major signal suggesting the start of a new bullish cycle. Price is now retesting the previously broken trendline, hinting at the possibility of a fresh upward leg to resume the longer-term bullish trend we've seen recently.
Personally, I'm targeting $3,600 in the medium term, and potentially $4,000 by 2026–2028 if institutional capital continues to rotate back into safe-haven assets like gold.
What about you — do you think BTC/USD will rise or fall in the coming years?
And what’s your target for it?
Chart Patterns

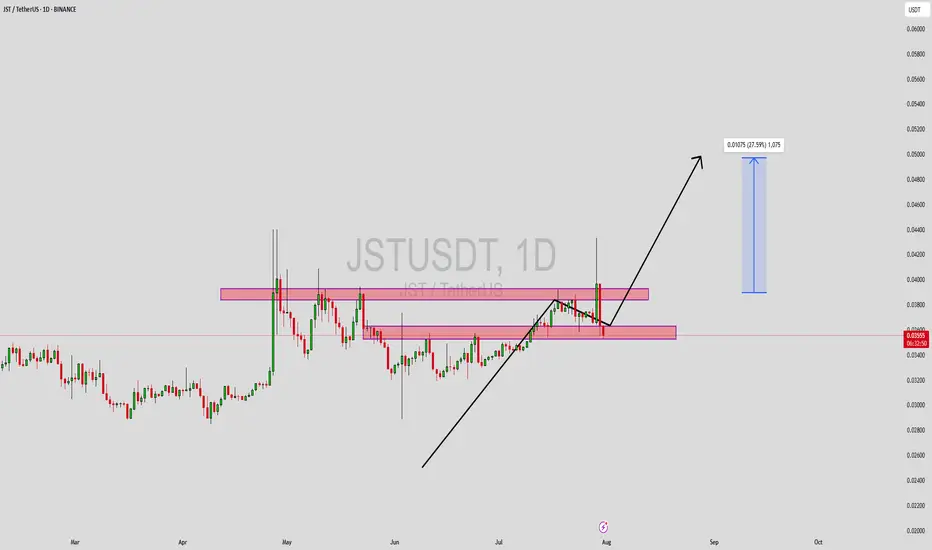
JSTUSDT Forming Bullish MomentumJSTUSDT has recently gained attention among traders as it moves closer to a key breakout level. The chart shows a series of higher lows, indicating underlying bullish momentum despite short-term rejections near resistance zones. The price action reflects a coiling structure with tightening price ranges, hinting at an imminent breakout. Volume has remained consistent, which is often an early sign of accumulation and growing investor interest.
As JSTUSDT continues to test its resistance zone, a successful breakout could lead to a sharp upside move. The projected gain of 20% to 25%+ aligns with the measured move from recent consolidation zones. This movement is supported by market interest in JST, which is a core part of the TRON ecosystem, providing decentralized finance capabilities like stablecoin lending and borrowing. The project’s integration and use within the TRON network continue to attract both retail and institutional investors.
Technically, the price is respecting key support and resistance levels, with clear zones marked out on the chart. The support zone has held strong on multiple tests, making it a potential launchpad for the next leg up. With volume backing the setup, and favorable sentiment across broader market conditions, JST is well-positioned for a breakout rally.
Short-term traders and mid-term investors should keep JSTUSDT on their watchlist, especially as momentum builds near the upper resistance area. If the breakout confirms with a daily close above resistance backed by volume, it may trigger rapid price movement.
✅ Show your support by hitting the like button and
✅ Leaving a comment below! (What is You opinion about this Coin)
Your feedback and engagement keep me inspired to share more insightful market analysis with you!
NO FEAR on BITCOIN!I was waiting for a break on this level from some days, and here we go! We catched a nice long setup previous days, and now Bitcoin broke down the key level i highlited last week. This is an important support area that will now act as resistance, so i expect a continuation to the downside till the second support area at $112.000. To invalidate this setup we should expect a clean break above $116.800.
Let me know in the comment what do you expect!

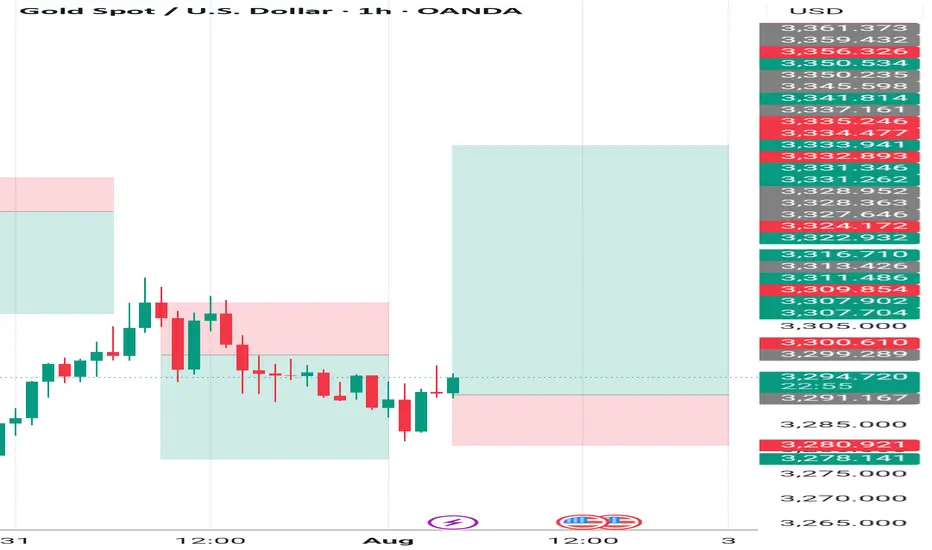
Gold on the edge: Will 3,270 break as Fed pressure builds?Hello traders, what’s your view on XAUUSD?
Yesterday, gold remained under pressure as a series of fresh U.S. economic data reinforced expectations that the Federal Reserve will keep interest rates higher for longer. As a result, U.S. Treasury yields surged, the dollar strengthened, and gold came under renewed selling pressure. Currently, XAUUSD is trading around 3,288 USD, down 0.04% on the day.
From a technical standpoint, gold is clearly trading within a well-defined downward-sloping channel, confirming the dominance of bearish momentum. Moreover, both the EMA34 and EMA89 are acting as dynamic resistance levels, repeatedly rejecting any short-term recovery attempts—highlighting the strength of the current downtrend.
If a pullback occurs before the next leg lower, the confluence of resistance and the EMA zone will be crucial to watch. It could offer ideal conditions for potential short setups in line with the trend.
Looking ahead, the next key support lies at 3,270 USD. A break below this level could open the door for a deeper move toward the 32XX area.
What do you think? Will gold continue to drop further?
Good luck and trade safe!

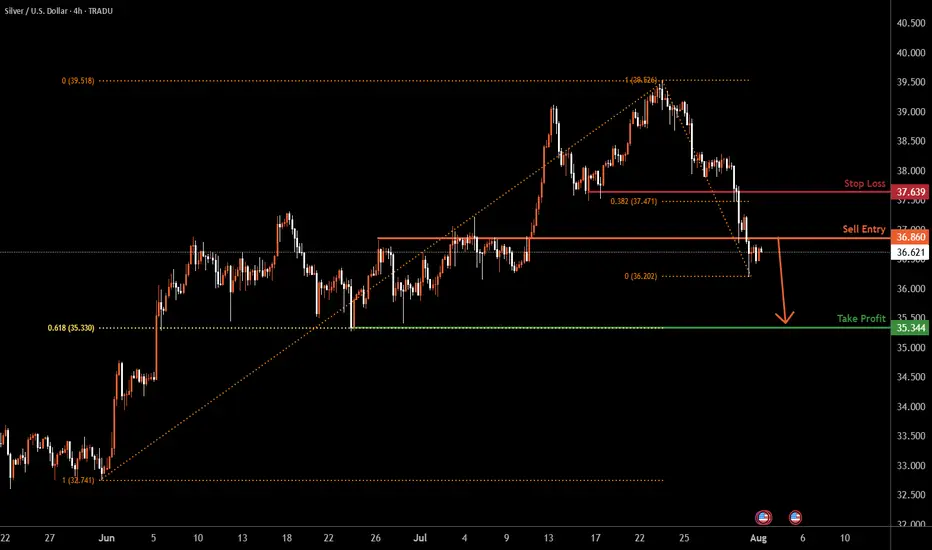
Silver H4 | Potential bearish dropBased on the H4 chart analysis, we could see the price reverse from the sell entry at 3.86, and could drop from this level to the downside.
Stop loss is at 37.63, which is a pullback resistance that is slightly above the 38.2% Fibonacci retracement.
Take profit is at 35.34, which is a swing low support that lines up with th e 61.8% Fibonacci retraecment.
High Risk Investment Warning
Trading Forex/CFDs on margin carries a high level of risk and may not be suitable for all investors. Leverage can work against you.
Stratos Markets Limited (tradu.com ):
CFDs are complex instruments and come with a high risk of losing money rapidly due to leverage. 65% of retail investor accounts lose money when trading CFDs with this provider. You should consider whether you understand how CFDs work and whether you can afford to take the high risk of losing your money.
Stratos Europe Ltd (tradu.com ):
CFDs are complex instruments and come with a high risk of losing money rapidly due to leverage. 66% of retail investor accounts lose money when trading CFDs with this provider. You should consider whether you understand how CFDs work and whether you can afford to take the high risk of losing your money.
Stratos Global LLC (tradu.com ):
Losses can exceed deposits.
Please be advised that the information presented on TradingView is provided to Tradu (‘Company’, ‘we’) by a third-party provider (‘TFA Global Pte Ltd’). Please be reminded that you are solely responsible for the trading decisions on your account. There is a very high degree of risk involved in trading. Any information and/or content is intended entirely for research, educational and informational purposes only and does not constitute investment or consultation advice or investment strategy. The information is not tailored to the investment needs of any specific person and therefore does not involve a consideration of any of the investment objectives, financial situation or needs of any viewer that may receive it. Kindly also note that past performance is not a reliable indicator of future results. Actual results may differ materially from those anticipated in forward-looking or past performance statements. We assume no liability as to the accuracy or completeness of any of the information and/or content provided herein and the Company cannot be held responsible for any omission, mistake nor for any loss or damage including without limitation to any loss of profit which may arise from reliance on any information supplied by TFA Global Pte Ltd.
The speaker(s) is neither an employee, agent nor representative of Tradu and is therefore acting independently. The opinions given are their own, constitute general market commentary, and do not constitute the opinion or advice of Tradu or any form of personal or investment advice. Tradu neither endorses nor guarantees offerings of third-party speakers, nor is Tradu responsible for the content, veracity or opinions of third-party speakers, presenters or participants.
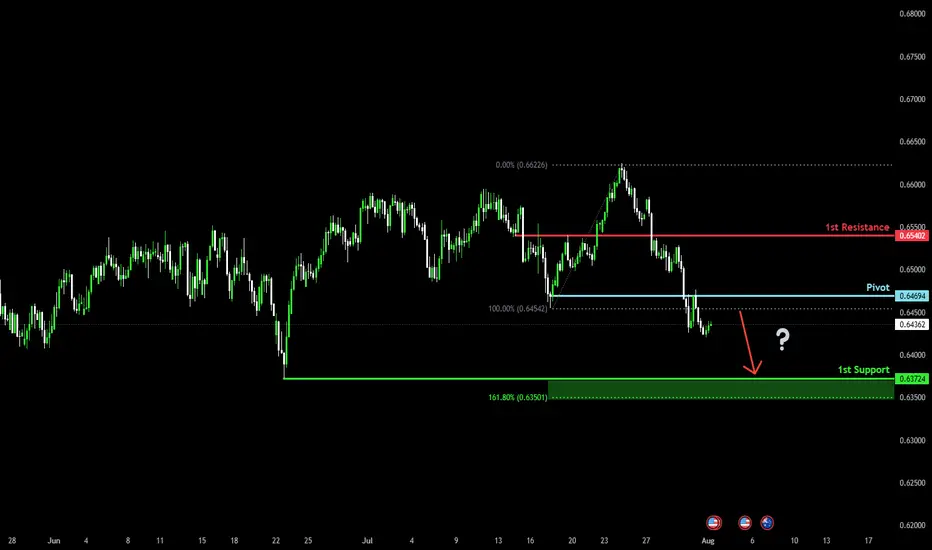
Could we see a further drop for the Aussie?The price has rejected off the pivot, which has been identified as a pullback resistance and could drop to the 1st support, which acts as a swing low support.
Pivot: 0.6469
1st Support: 0.6372
1st Resistance: 0.6540
Risk Warning:
Trading Forex and CFDs carries a high level of risk to your capital and you should only trade with money you can afford to lose. Trading Forex and CFDs may not be suitable for all investors, so please ensure that you fully understand the risks involved and seek independent advice if necessary.
Disclaimer:
The above opinions given constitute general market commentary, and do not constitute the opinion or advice of IC Markets or any form of personal or investment advice.
Any opinions, news, research, analyses, prices, other information, or links to third-party sites contained on this website are provided on an "as-is" basis, are intended only to be informative, is not an advice nor a recommendation, nor research, or a record of our trading prices, or an offer of, or solicitation for a transaction in any financial instrument and thus should not be treated as such. The information provided does not involve any specific investment objectives, financial situation and needs of any specific person who may receive it. Please be aware, that past performance is not a reliable indicator of future performance and/or results. Past Performance or Forward-looking scenarios based upon the reasonable beliefs of the third-party provider are not a guarantee of future performance. Actual results may differ materially from those anticipated in forward-looking or past performance statements. IC Markets makes no representation or warranty and assumes no liability as to the accuracy or completeness of the information provided, nor any loss arising from any investment based on a recommendation, forecast or any information supplied by any third-party.
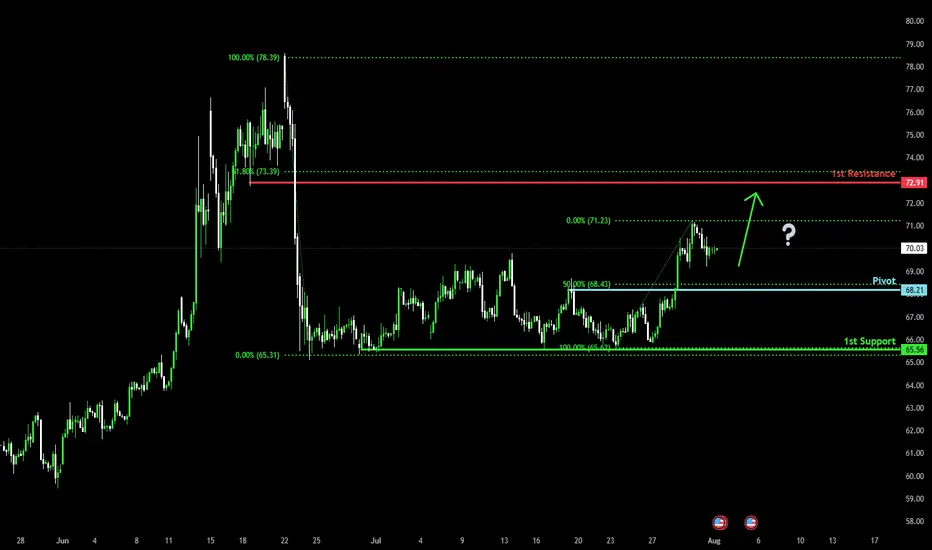
Falling towards 50% Fibonacci support?WTI Oil (XTI/USD) is falling towards the pivot, which has been identified as a pullback support and could bounce to the 1st resistance.
Pivot: 68.21
1st Support: 65.56
1st Resistance: 72.91
Risk Warning:
Trading Forex and CFDs carries a high level of risk to your capital and you should only trade with money you can afford to lose. Trading Forex and CFDs may not be suitable for all investors, so please ensure that you fully understand the risks involved and seek independent advice if necessary.
Disclaimer:
The above opinions given constitute general market commentary, and do not constitute the opinion or advice of IC Markets or any form of personal or investment advice.
Any opinions, news, research, analyses, prices, other information, or links to third-party sites contained on this website are provided on an "as-is" basis, are intended only to be informative, is not an advice nor a recommendation, nor research, or a record of our trading prices, or an offer of, or solicitation for a transaction in any financial instrument and thus should not be treated as such. The information provided does not involve any specific investment objectives, financial situation and needs of any specific person who may receive it. Please be aware, that past performance is not a reliable indicator of future performance and/or results. Past Performance or Forward-looking scenarios based upon the reasonable beliefs of the third-party provider are not a guarantee of future performance. Actual results may differ materially from those anticipated in forward-looking or past performance statements. IC Markets makes no representation or warranty and assumes no liability as to the accuracy or completeness of the information provided, nor any loss arising from any investment based on a recommendation, forecast or any information supplied by any third-party.
ADA Monthly Buying Opportunity As per my analysis ADA is showing buying opportunity in monthly chart. I hope it will return max 50% of investment in coming months. Trend is bullish, Monthly volume is above the average volume, golden level support. Do your own research before taking any risk.

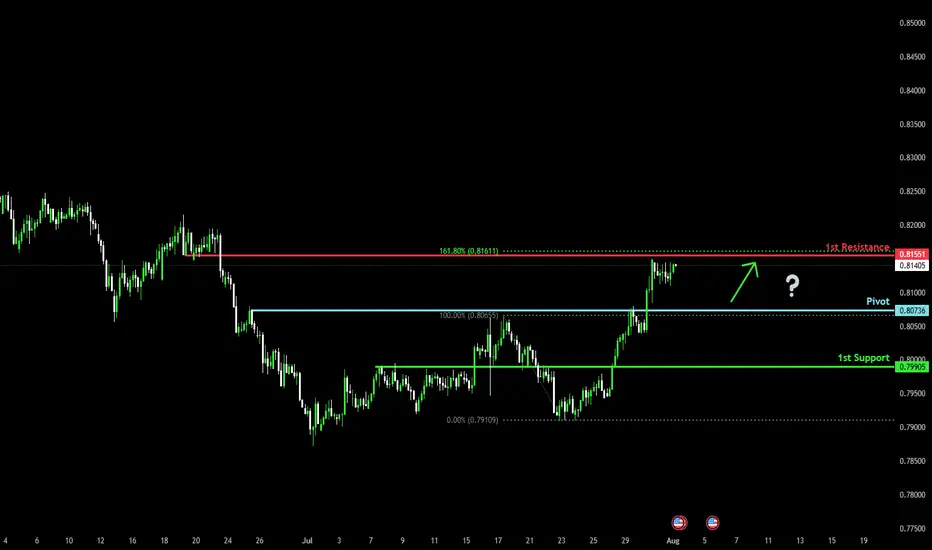
Bullish bounce off pullback support?The Swissie (USD/CHF) is falling towards the pivot, which acts as a pullback support and could bounce to the 1st resistance, which lines up with the 161.8% Fibonacci extension.
Pivot: 0.8073
1st Support: 0.7990
1st Resistance: 0.8155
Risk Warning:
Trading Forex and CFDs carries a high level of risk to your capital and you should only trade with money you can afford to lose. Trading Forex and CFDs may not be suitable for all investors, so please ensure that you fully understand the risks involved and seek independent advice if necessary.
Disclaimer:
The above opinions given constitute general market commentary, and do not constitute the opinion or advice of IC Markets or any form of personal or investment advice.
Any opinions, news, research, analyses, prices, other information, or links to third-party sites contained on this website are provided on an "as-is" basis, are intended only to be informative, is not an advice nor a recommendation, nor research, or a record of our trading prices, or an offer of, or solicitation for a transaction in any financial instrument and thus should not be treated as such. The information provided does not involve any specific investment objectives, financial situation and needs of any specific person who may receive it. Please be aware, that past performance is not a reliable indicator of future performance and/or results. Past Performance or Forward-looking scenarios based upon the reasonable beliefs of the third-party provider are not a guarantee of future performance. Actual results may differ materially from those anticipated in forward-looking or past performance statements. IC Markets makes no representation or warranty and assumes no liability as to the accuracy or completeness of the information provided, nor any loss arising from any investment based on a recommendation, forecast or any information supplied by any third-party.
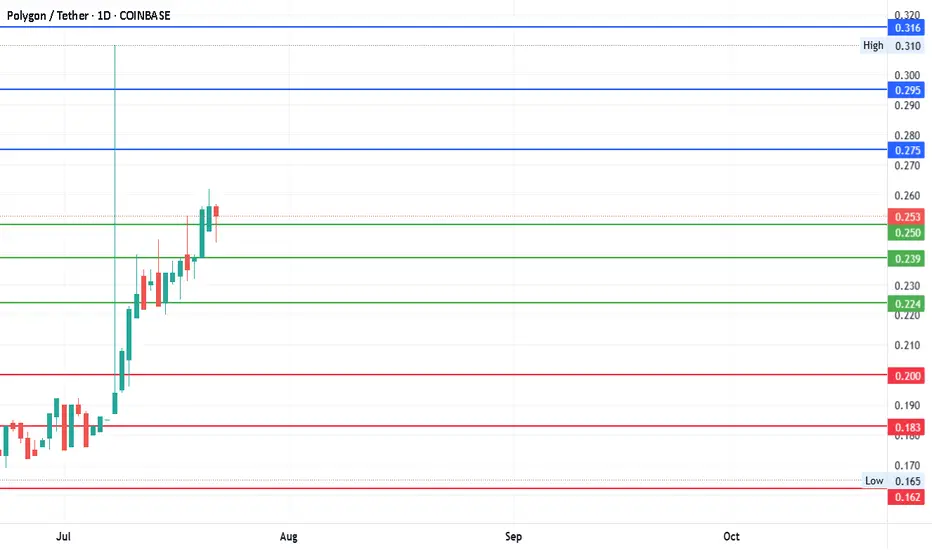
#MATICUSDT - Pivot is $0.239Date: 22-07-2025
#MATICUSDT Current Price: $0.253
Pivot Point: $0.239 Support: $0.224 Resistance: $0.254
Upside Targets:
Target 1: $0.275
Target 2: $0.295
Target 3: $0.316
Target 4: $0.337
Downside Targets:
Target 1: $0.203
Target 2: $0.183
Target 3: $0.162
Target 4: $0.141
#TradingView #Crypto #Bitcoin #BTC #CryptoTA #TradingView #PivotPoints #SupportResistance
#SILVER - $3 Swing? 42 or 34.87?Date: 28-07-2205
#silver
Current Price: 38.15
Pivot Point: 38.440 Support: 37.740 Resistance: 39.145
Upside Targets:
Target 1: 39.812
Target 2: 40.480
Target 3: 41.245
Target 4: 42.010
Downside Targets:
Target 1: 37.070
Target 2: 36.400
Target 3: 35.635
Target 4: 34.870
#TradingView #Stocks #Equities #StockMarket #Investing #Trading #silver
#TechnicalAnalysis #StockCharts #Finance
#Gold #Bitcoin #Silver #TradingView #PivotPoints #SupportResistance

Down continuationDown continuation, 24000 level is strong but we will see. Would like to see a brake and retest on Fib level.

BULLISH REVERSALAfter struggling between the 2 key levels, XAUUSD showed a change of character indicating a reversal. Target is 500 pips.
KIOCL LTD S/RSupport and Resistance Levels:
Support Levels: These are price points (green line/shade) where a downward trend may be halted due to a concentration of buying interest. Imagine them as a safety net where buyers step in, preventing further decline.
Resistance Levels: Conversely, resistance levels (red line/shade) are where upward trends might stall due to increased selling interest. They act like a ceiling where sellers come in to push prices down.
Breakouts:
Bullish Breakout: When the price moves above resistance, it often indicates strong buying interest and the potential for a continued uptrend. Traders may view this as a signal to buy or hold.
Bearish Breakout: When the price falls below support, it can signal strong selling interest and the potential for a continued downtrend. Traders might see this as a cue to sell or avoid buying.
MA Ribbon (EMA 20, EMA 50, EMA 100, EMA 200) :
Above EMA: If the stock price is above the EMA, it suggests a potential uptrend or bullish momentum.
Below EMA: If the stock price is below the EMA, it indicates a potential downtrend or bearish momentum.
Trendline: A trendline is a straight line drawn on a chart to represent the general direction of a data point set.
Uptrend Line: Drawn by connecting the lows in an upward trend. Indicates that the price is moving higher over time. Acts as a support level, where prices tend to bounce upward.
Downtrend Line: Drawn by connecting the highs in a downward trend. Indicates that the price is moving lower over time. It acts as a resistance level, where prices tend to drop.
Disclaimer:
I am not SEBI registered. The information provided here is for learning purposes only and should not be interpreted as financial advice. Consider the broader market context and consult with a qualified financial advisor before making investment decisions.

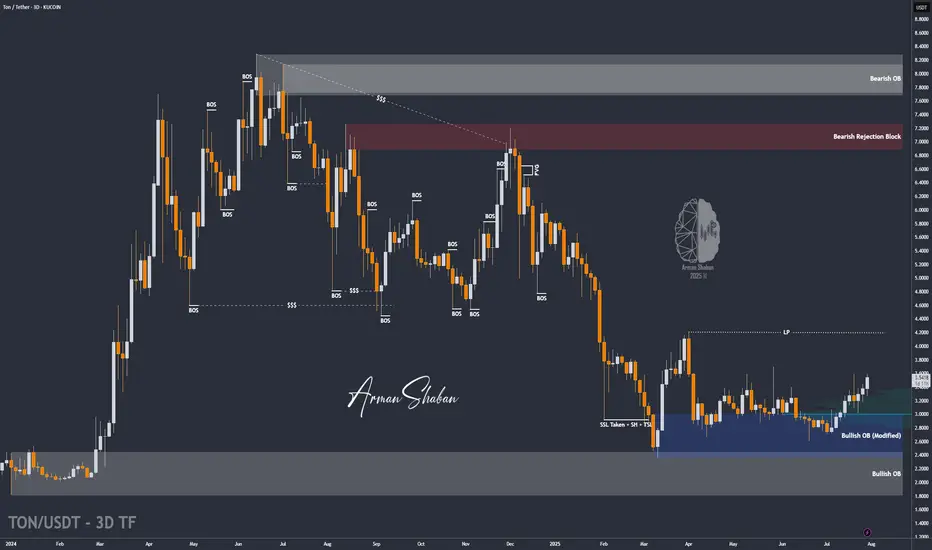
TON/USDT | Surges 18% – Eyes on $3.63, Then $4.20 and $4.68!By analyzing the Toncoin chart on the 3-day timeframe, we can see that after a pullback to the $3 area, strong demand kicked in, and within just one week, the price surged over 18%, reaching above $3.5. Toncoin is currently trading around $3.53, and I expect it to hit the $3.63 target soon. The next bullish targets after that are $4.20 and $4.68.
Please support me with your likes and comments to motivate me to share more analysis with you and share your opinion about the possible trend of this chart with me !
Best Regards , Arman Shaban
YGGUSDT Retesting Historical Support Zone! Bounce or Breakdown?YGG/USDT is currently at a critical crossroad. After a long-term downtrend from the peak at $11.50, the price has once again returned to the historical demand zone between $0.1147 and $0.1535 — an area that previously served as a strong base for reversals in the past.
Will this level act as a launchpad for a strong rebound, or are we about to witness a fresh breakdown?
---
🔍 Comprehensive Technical Analysis:
📌 Mid-Term Market Structure:
Price remains in a macro downtrend, but is now entering a potential accumulation phase.
This support zone has been tested multiple times throughout 2023–2025, confirming it as a key psychological level.
The current structure resembles a bottoming range, setting the stage for a possible trend reversal.
📊 Key Support & Resistance Levels:
🟩 Major Demand Zone: $0.1147 – $0.1535 (highlighted green box on the chart)
📈 Bullish Upside Targets:
$0.2530 (initial resistance & breakout trigger)
$0.3369 (early trend strength confirmation)
$0.5562 – $0.8446 (realistic mid-term targets)
Up to $1.11 and $1.37 (longer-term resistance)
---
🐂 Bullish Scenario (Reversal Potential):
If price holds this support and forms a clear reversal pattern:
A strong rebound toward $0.2530 – $0.3369 is highly likely.
A breakout above $0.3369 would confirm a double bottom or falling wedge breakout.
Additional catalyst: positive sentiment in the broader crypto market could accelerate the move.
🔔 Confirmation needed: a strong bullish candle + rising volume = reversal validation.
---
🐻 Bearish Scenario (Breakdown Risk):
If support at $0.1147 fails:
Price could slide lower toward $0.10 or even create a new all-time low.
This would extend the current bearish structure and invalidate short-term recovery hopes.
---
🧠 Pattern Insight:
The current setup resembles a sideways accumulation range.
Possible bullish formations:
Double Bottom
Rounding Bottom
Falling Wedge Breakout (typically bullish)
---
🎯 Strategy & Trader Perspective:
Aggressive Traders: May consider entering near support with tight stop-loss below $0.1147 and targets around $0.2530 – $0.3369.
Conservative Traders: Wait for a confirmed breakout above $0.2530.
Long-Term Investors: This area could present a gradual accumulation opportunity if you believe in YGG’s long-term fundamentals.
---
📝 Conclusion:
This isn't just a technical support level — it's a battle zone between bullish hope and bearish pressure. The next few candles will be crucial to determine whether the bulls will regain control or the bears will break through.
#YGG #YGGUSDT #CryptoSupport #CryptoRebound #AltcoinAnalysis #BullishReversal #CryptoBearish #CryptoTrading #TechnicalAnalysis

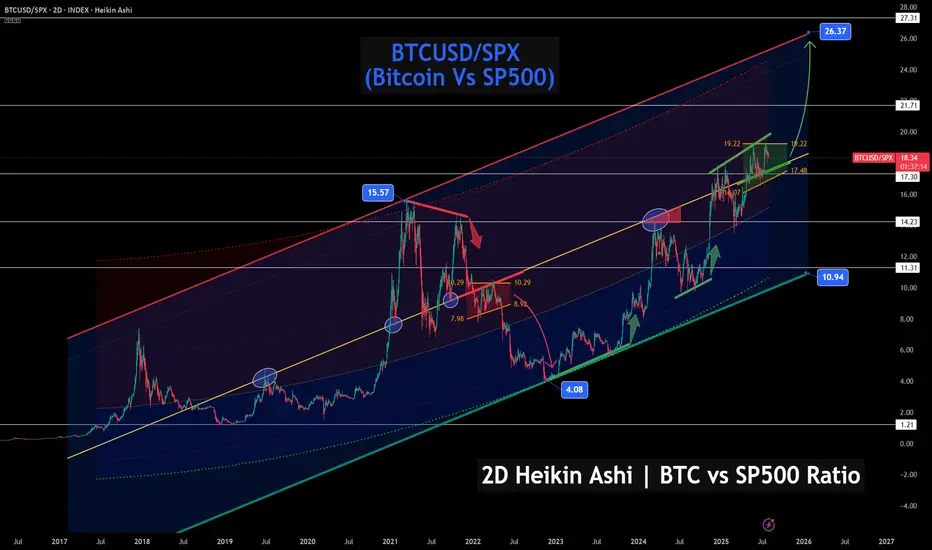
Bitcoin vs S&P 500 – Ratio Signals Strength, Chart favors BTC!🚀📊 Bitcoin vs S&P 500 – Ratio Signals Strength, Even If Stocks Correct 🔍📈
After posting earlier today about VOO (S&P 500 ETF) and the index itself hitting major resistance, I wanted to shift our focus to what could shine even if stocks pull back: Bitcoin.
This chart shows the BTCUSD/SPX ratio – in simple terms, how Bitcoin is performing relative to the S&P 500 . And what do we see? Clear, technical strength.
🔍 Key Observations:
BTC/SPX is currently breaking out from a bullish flag structure just above the 17.30–17.48 region
If the breakout holds, the projected technical target is near 26.37, the top of this multi-year channel
Historically, previous breakouts from similar zones have delivered explosive upside, even when equities struggled
🧠 So what does this mean?
Even if the stock market pulls back—as suggested in our earlier VOO/US500 chart—Bitcoin could still outperform, simply by dropping less, consolidating, or rising while stocks fall. That’s the power of analyzing ratios, not just absolute price.
We’ve already discussed how macro metrics like the Buffett Indicator (Stocks-to-GDP) are showing equity overvaluation. If capital starts rotating out of equities, Bitcoin is positioned as a beneficiary—especially if it maintains this relative strength.
💬 Final thoughts:
Don’t just look at BTC in isolation— look at it relative to what it's competing against
Ratios offer perspective: this one says Bitcoin’s trend vs stocks is up and strong
With solid support at 14.23 and room to run toward 26.37, this could be a chart to watch for months ahead
Are you watching this breakout? Let me know what your game plan is.
FOOD FOR THOUGHT: With Gold prices easing, stock markets at all time highs, is this the PERFECT time for big money to hedge with Bitcoin? Likely yes !
One Love,
The FX PROFESSOR 💙
Disclosure: I am happy to be part of the Trade Nation's Influencer program and receive a monthly fee for using their TradingView charts in my analysis. Awesome broker, where the trader really comes first! 🌟🤝📈
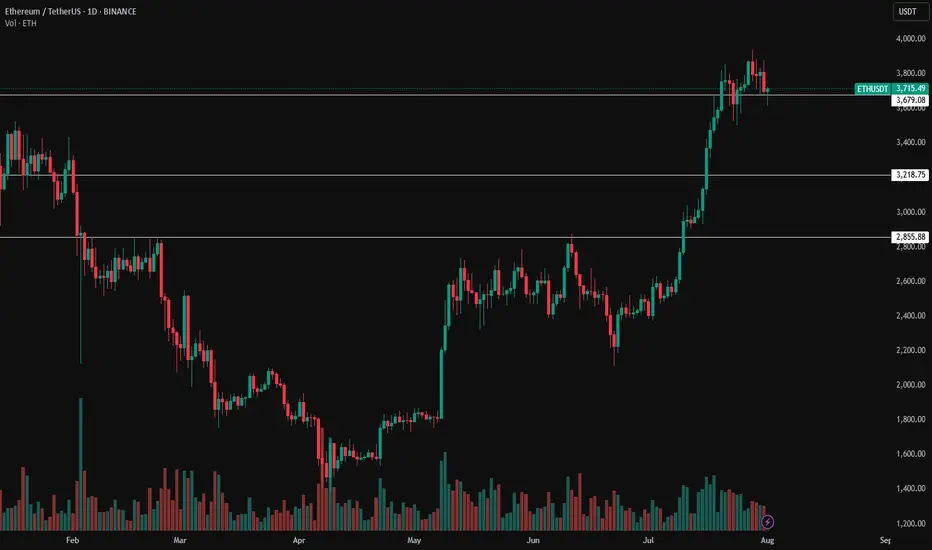
ETH Still Holding Key LevelDespite the recent pullback following the FOMC meeting, Ethereum is still trading above a key daily level that previously acted as resistance ($3,865). As long as we don't see a daily close below this zone, the market structure remains intact, and my bias stays bullish.
Support holding here could set the stage for another leg up and potentially reignite altseason, going below will cause me to shy away from the idea of an altseason in the short future.
For now, I’m watching daily close closely and staying patient
Alibaba - A remarkable reversal!🛒Alibaba ( NYSE:BABA ) reversed exactly here:
🔎Analysis summary:
Recently Alibaba has perfectly been respecting market structure. With the current bullish break and retest playing out, there is a very high chance that Alibaba will rally at least another +20%. But all of this chart behaviour just looks like we will witness a major bottom formation soon.
📝Levels to watch:
$110, $135
🙏🏻#LONGTERMVISION
Philip - Swing Trader

New Setup : $BABAInside this wedge there is a nice pullback to the ema 50.
Bullish ATR Break popped out with a new crossover.
Ready To Catch It !

Sell AUDCHFButterfly pattern on display on the AUDCHF chart. This confirms a double top. On the M15 entry level timeframe, a bearish flag can be seen indicating strong bearish movement to come.

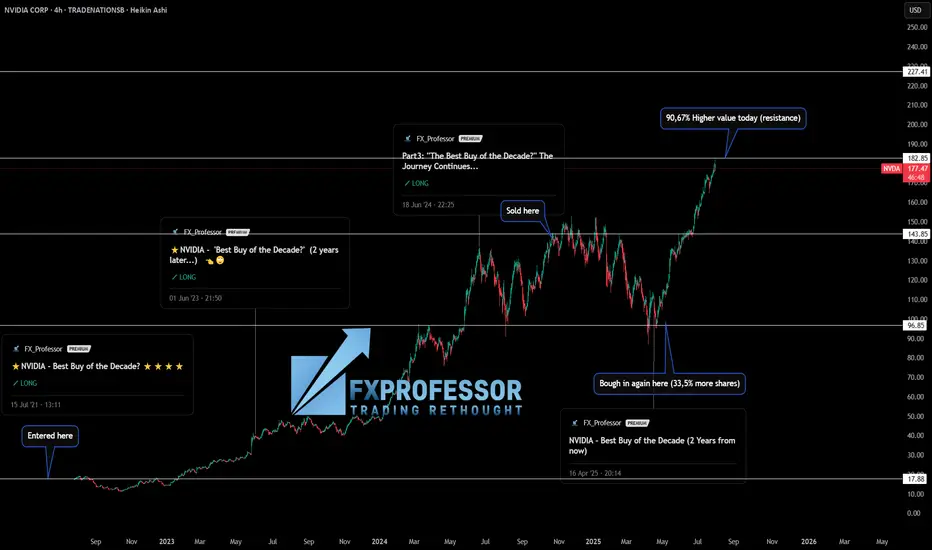
NVIDIA – From Thesis to Profits: How Fundamentals & Technicals 📚💡 NVIDIA – From Thesis to Profits: How Fundamentals & Technicals Aligned 🚀🧠
This isn’t just a trade —it’s a lesson in how conviction, timing, and structure come together when you truly understand what you're investing in.
I’ve been publicly calling NASDAQ:NVDA the “Best Buy of the Decade” since July 2021 when the price was around $18. Why? Because I’m a gamer, I understand chips, and I knew exactly what NVIDIA was building long before AI became a buzzword. From graphics cards to data centers and AI compute, the fundamentals were solid.
But let me be clear: I’m not a holder forever. I use technical analysis to manage entries and exits. And that’s where the real edge comes in. 🎯
Here’s how the trade evolved:
✅ Initial entry: $17.88 (2021)
✅ First target hit: $143.85 → Took profits
✅ Re-entry: $96.85 → Got 33.5% more shares for the same money
✅ Today’s value (July 31st): Up +90.67% in just 100 days
📅 That’s from April 23rd to today.
(and it was ALL publicly posted here, for You!)
This is what happens when macro conviction meets micro execution.
🧠 The key takeaways:
Fundamentals gave me the why.
Technicals gave me the when.
And risk management gave me more shares for free.
That’s not luck —it’s structure, patience, and doing the work. If you’re just “HODLing” and hoping, consider learning how to work the chart instead of letting the chart work you.
Let me know in the comments—did you catch this move? Are you in, or waiting for the next entry?
One Love,
The FX PROFESSOR 💙
ps. in this case i did not sell many shares today i hedged with a short on SP500. Nvidia might correct a bit
Disclosure: I am happy to be part of the Trade Nation's Influencer program and receive a monthly fee for using their TradingView charts in my analysis. Awesome broker, where the trader really comes first! 🌟🤝📈
GOLD Local Short! Sell!
Hello,Traders!
GOLD made a retest
Of the horizontal resistance
Of 3313$ and we are already
Seeing a bearish reaction and
We will be expecting a further
Bearish move down
Sell!
Comment and subscribe to help us grow!
Check out other forecasts below too!
Disclosure: I am part of Trade Nation's Influencer program and receive a monthly fee for using their TradingView charts in my analysis.
