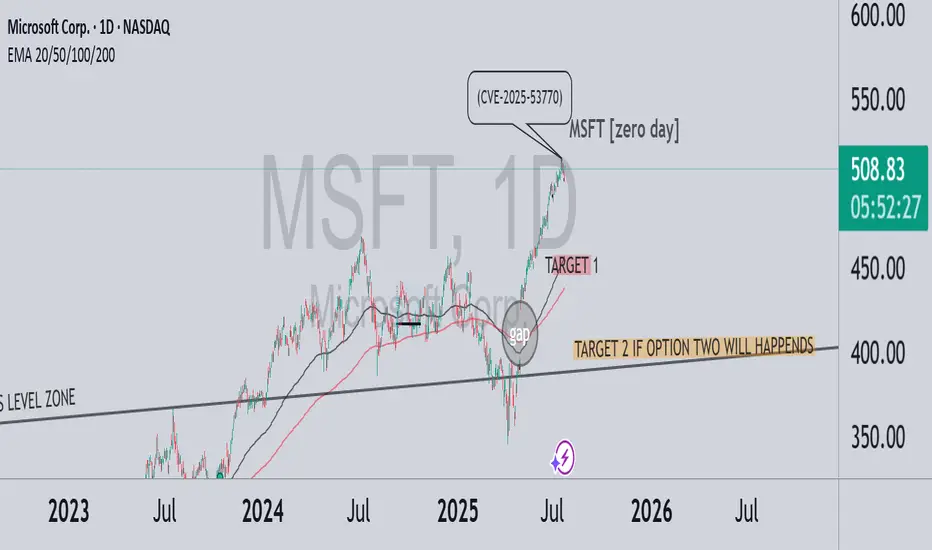
MSFT – A correction brewing? zero day CRWD-like scenario?In July 2025, a critical vulnerability in Microsoft SharePoint (CVE-2025-53770) was exploited by threat actors globally. Although the issue was first reported during the Pwn2Own Berlin competition back in May, Microsoft delayed the patch — allowing attackers a significant head start. Over 400 servers and dozens of organizations were breached, including U.S. and European government entities.
💬 On July 18, Reddit users began discussing the flaw’s severity, comparing it to past vulnerabilities like Log4j. Interestingly, this coincided with the first significant technical deviation from the bullish trend — marking a potential beginning of downside momentum.
🔍 In the chart above:
Strong bullish run until the Zero-Day disclosure
Clear gap beneath current price action
TARGET 1 reflects a natural technical retracement toward EMA 50–100 and the mid-term trendline
TARGET 2 is conditional – it only applies if a massive event occurs, similar to what we saw with CRWD
⚠️ Key distinction:
CrowdStrike: A software update bug caused a global Windows crash — no cyberattack, but massive operational impact
Microsoft: A real, actively exploited security vulnerability — with long-tail risk for data leaks, ransomware, and regulatory backlash
🎯 Conclusion:
If the SharePoint exploit escalates in visibility or consequences, and Microsoft fails to contain the damage — we could see extended downside pressure. TARGET 2 remains valid only under a high-severity scenario, like CRWD’s global meltdown.
Chart Patterns
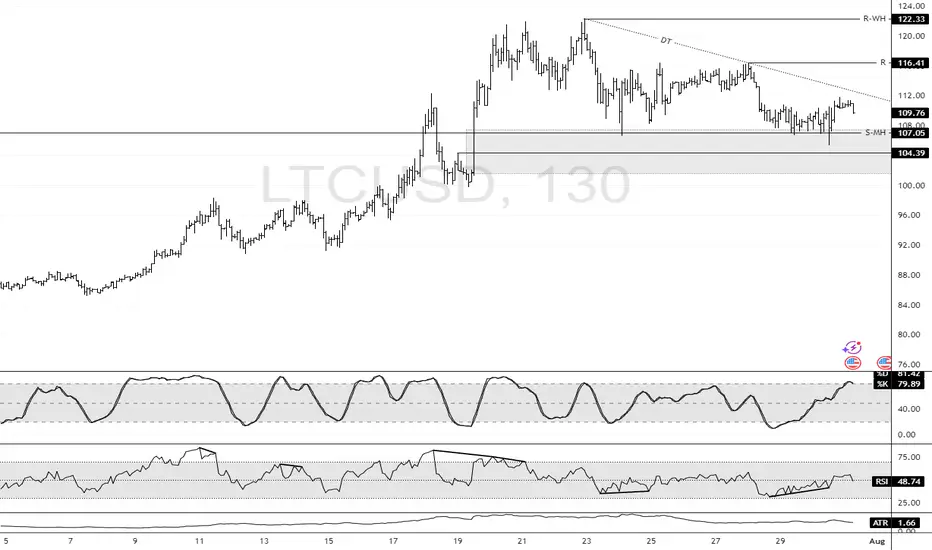
LTC: Bullish Structure Intact Above $104.3 SupportFenzoFx—Litecoin swept liquidity below $107.0 during today’s session and is currently trading near $110.0, supported by a descending trendline.
Technically, key support stands at $104.3. As long as this level holds, the bullish outlook is preserved. A break above the descending trendline could propel LTC toward the previous highs at $116.4 and potentially $122.3.
Gold Sell Setup - M15PEPPERSTONE:XAUUSD
Timeframe: m15
Risk Level: Medium
🔹 Setup:
Price is testing the upper boundary of the descending channel.
📈 Entry:
Current price zone: 3302.5
🎯 Targets (TP):
TP1: 3393
TP2: 3283
TP4: 3264
TP6: 3244
⛔ Stop Loss (SL):
3312.2
#XAUUSD #GOLD #SELL #Signal #MJTrading
Psychology Always Matters:

GOLD SHORT10 year bullrun is followed by a shorter term bearmarket. Gold is starting to lose its strength, which is a clear sign of weakness and the beginning of a bearish reversal.

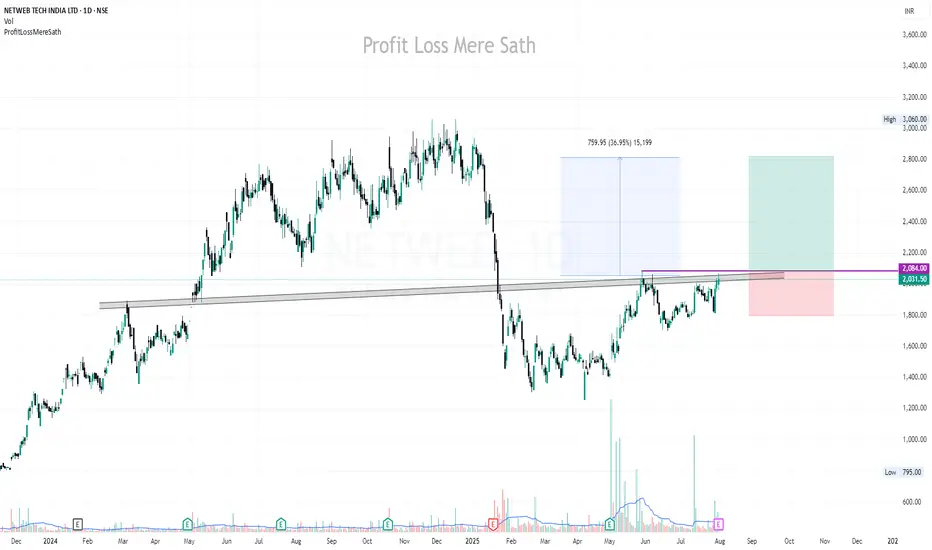
NETWEB | Buy above 2085 | Strict SL below 1800 | Target 2830Disclaimer:
This is not financial advice. Please do your own research or consult with a financial advisor before making any investment decisions. Investments in stocks can be risky and may result in loss of capital.
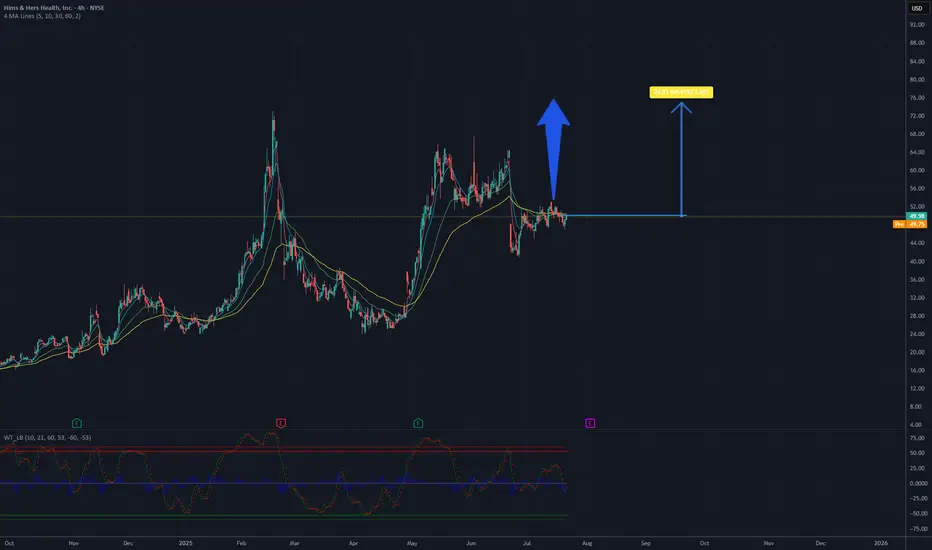
Is it a time for HIMS? Potential 50%,target 75USD.The company has announced plans to introduce comprehensive at-home lab tests, leveraging the acquisition of Trybe Labs, which could enhance service personalization and attract new customers. Additionally, expansion into markets such as Canada and Europe (through the acquisition of Zava) opens new revenue growth opportunities. The company demonstrates continuous financial improvement, including record profitability and a 111% revenue increase since reaching its ATH (All-Time High) in February 2025, which builds investor confidence.
The chart analysis of Hims & Hers Health, Inc. (NYSE: HIMS) indicates a clear upward trend in the recent period. The current price is approximately 49.38 USD. Based on historical data and visible momentum, there is potential for a growth of about 50%, which could bring the price to around 75 USD. Key support is located around 45 USD, while resistance may be tested in the 55-60 USD range before further upward movement. It is recommended to monitor volume and key technical levels to confirm the continuation of the trend.
Potential TP: 75 $
BTC/USD – Strong Buy Opportunity from Demand Zone BTC/USD – Strong Buy Opportunity from Demand Zone
🟢 Technical Outlook:
Bitcoin (BTC/USD) has tapped into a well-defined Demand Zone near 115,000–116,000, showing early signs of a potential bullish reversal. This level aligns with key liquidity zones, smart money concepts, and price inefficiencies — offering high-probability long setups.
🧠 Key Technical Highlights:
🔻 Equal Lows + Sell-Side Liquidity:
Market swept equal lows, grabbing liquidity below support — a common institutional setup before a bullish push.
✅ Break of Structure (BOS):
A prior BOS indicates a shift from bearish to bullish structure after liquidity collection.
📉 Fair Value Gap (FVG):
Price created and respected an FVG after the BOS, validating bullish intent.
📊 Imbalance Filled:
A prior price inefficiency has now been filled, completing a clean move from imbalance back into structure.
📈 Target Zone: 119,000 USD
Marked as the logical next stop — sitting near prior resistance and a liquidity zone.
🎓 Educational Insight:
This is a textbook Smart Money Concept scenario:
Sell-side liquidity sweep
Demand zone tap
Imbalance rebalancing
Shift in market structure
It shows how institutions often engineer liquidity grabs before a large directional move.

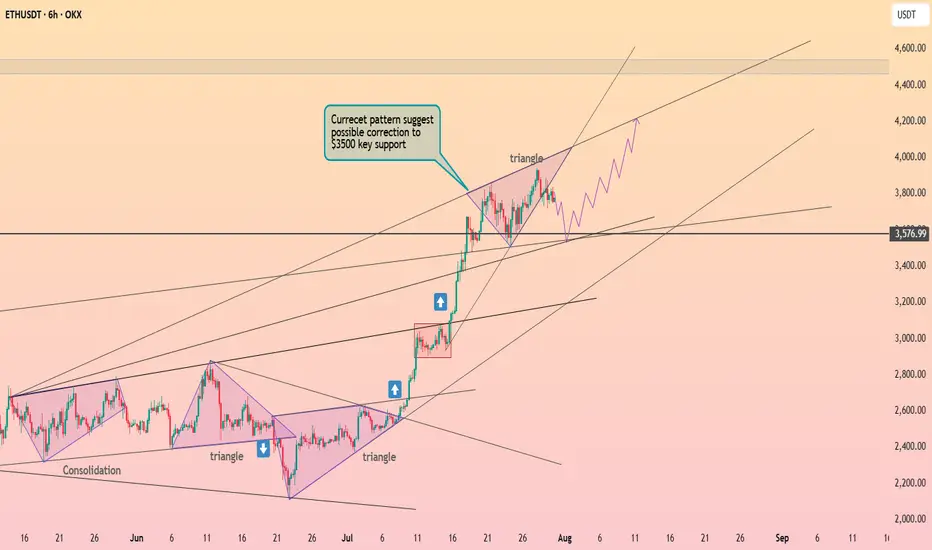
Ethereum is holding the $3700 level ┆ HolderStatOKX:ETHUSDT rallied from multiple triangle breakouts to test 4,400+ before pulling back. It’s now approaching key support at 3,576, which coincides with a major horizontal and trendline intersection. If this zone holds, the next leg up may target 4,600–4,800. Structure remains bullish above 3,500.
Ethereum Rally (?) : Strong Infusion with Volume RequiredEthereum can make a very strong rally of at least 35-40 percent.
And so the same goes for the Ishares Ethereum Trust ETF. (ETHA ETF)
But it needs to break the pennant.
And we need to observe strong volume.
Also, if we stay above the 50 and 200 period moving averages while this is happening, good things can happen.
Still, I am neutral until we break the pennant.

NZDUSD BUY SETUP LOOOOOOOONGHELLO
we have demand and ascending channel 4h
and low time frame the price make engulfing candle on 30m 15m on support zone
and can't make lower low so i will buy it

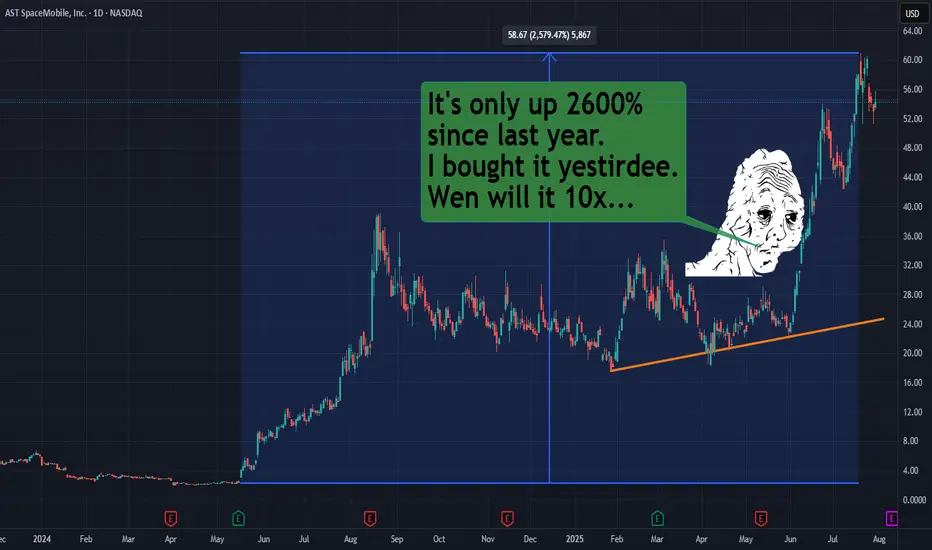
ASTS | Starlink ain't the only game in space no mo!This stock NASDAQ:ASTS is only up like 2600% in a year. That's like nothing. Might as well be losing that paypah.
Yes, it will swing more wildly than a chimpanzee from a vine. And yes my chart is probably effed as heck, but I'm looking for beyondosphere type of returns.
Is there room for more than one big f***y boom batty space phone company? Elon, scoot your bumbie over and let ASTS get in on that space rocket seat.
Play here is direct-to-cell calls between satellites and cell phones. Starlink probably has the advantage like the tide rolling over middle state a&m community college, but just like there was room for many phone companies in the last decades, there will be room for multiple space junkie phone companies.
You will not get rich because you will not HODL!
Live long and prosper. This is not financial advice. I JUST LIKE THE STOCK.
THANK YOU FOR YOUR ATTENTION ON THIS MATTER
FTTUSDT 1D#FTT has formed a falling wedge pattern on the daily chart.
For a bullish scenario to play out, it must break above the resistance cluster, which includes the wedge resistance, the Ichimoku Cloud, and the daily SMA100, with strong volume.
If that happens, the potential targets are:
🎯 $1.1623
🎯 $1.4424
🎯 $1.6475
🎯 $1.9046
🎯 $2.2782
🎯 $2.6517
⚠️ As always, use a tight stop-loss and apply proper risk management.

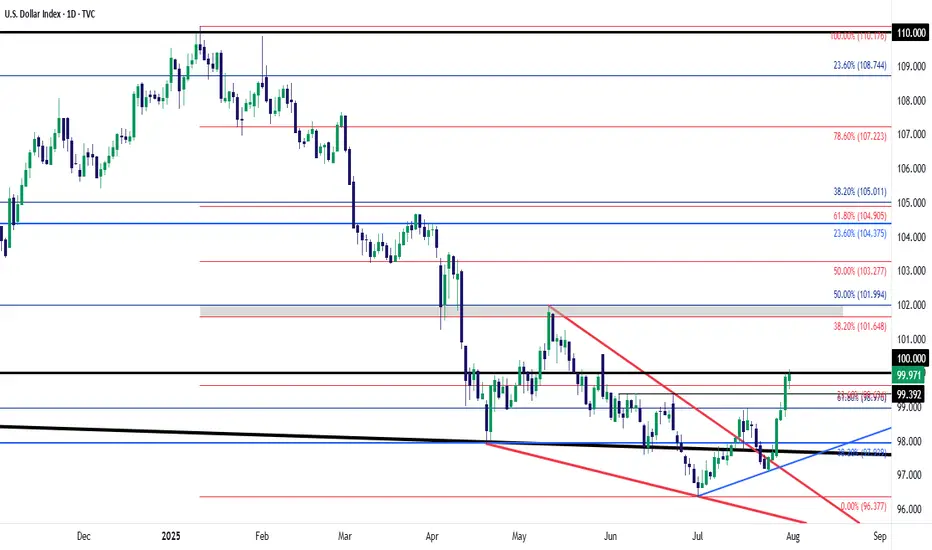
USD Working Strongest Month Since April 2022After a decisive sell-off ran for most of the first-half of the year, USD bulls have stepped up in July and DXY is currently up 3.3% for the month.
That's the strongest monthly outing in the currency since April of 2022- and that's just after the Fed had started their rate hike campaign that year. It led into a massive rally that ran through September as the USD set fresh 20-year highs.
The question now is one of continuation, and motive seems to be fairly clear. I've outlined the technical backdrop as this shift has taken place over the past month, as the Dollar held a higher-low last week and that drove into a higher-high this week.
There's likely some short squeezing contributing to the rally but with U.S. data remaining strong, and inflation on the way back up, the rate cuts that markets had priced-in back in March and April for 2025 are now in question.
This brings attention to the next major item - with Non-farm Payrolls tomorrow morning.
On a short-term basis the USD move has already started to show overbought conditions on the four-hour chart, and daily RSI is getting close to the 70-level. So perhaps ideal would be a soft report tomorrow at which point a pullback could show. It's from that that we can see whether bulls will come in to defend higher-lows, and there's now support potential at prior resistance of 99.40 in DXY.
If we do see a strong report, the 100 level is the spot for bulls to reckon with and at that point, we may be looking at an overbought RSI scenario on the daily chart - which doesn't necessarily preclude bullish continuation although it will make it more difficult to chase topside breakouts. - js
Review and plan for 1st August 2025Nifty future and banknifty future analysis and intraday plan.
Quarterly results.
This video is for information/education purpose only. you are 100% responsible for any actions you take by reading/viewing this post.
please consult your financial advisor before taking any action.
----Vinaykumar hiremath, CMT

GOLD: Strong Bullish Sentiment! Long!
My dear friends,
Today we will analyse GOLD together☺️
The recent price action suggests a shift in mid-term momentum. A break above the current local range around 3,296.556 will confirm the new direction upwards with the target being the next key level of 3,310.375 and a reconvened placement of a stop-loss beyond the range.
❤️Sending you lots of Love and Hugs❤️

$NOVO_B updated channelNovo Nordisk has had a tough time over the past 13 months, with its stock falling significantly. The main reason is growing investor concern that the explosive growth in sales of Wegovy and Ozempic may be slowing down, especially as competition heats up — particularly from Eli Lilly. Just a few days ago, Novo cut its full-year growth forecast, which confirmed some of those market worries.
At the same time, they announced a leadership change. Current CEO Lars Fruergaard Jørgensen is stepping down, and from August 7, Mike Doustdar will take over. He’s been with Novo since 1992 and has led the company’s international operations with great success. He’s also completed executive education at Harvard, and he’s widely seen as a strong, action-oriented leader with global experience.
Looking at the chart the price has almost always swayed up and down within this tunnel. Occationally falling to the trendline bellow.
Now we are at the trendline below - Meaning we are at an absolute panic state. One og the biggest pharma companies in the world - who in a matter of 5 years will bring a weight loss pill to this world - is ready for a new start.
Still somewhat of a falling knife - so be careful. But keep an eye out for a speedy return upwards.
NYSE:LLY on the other hand has a bit of the same trend BUT… price has hit the top of the channel…

Repeated pattern?We have to wait and see whether gold is going to repeat the same pattern or if this time it manages to rise from that level.

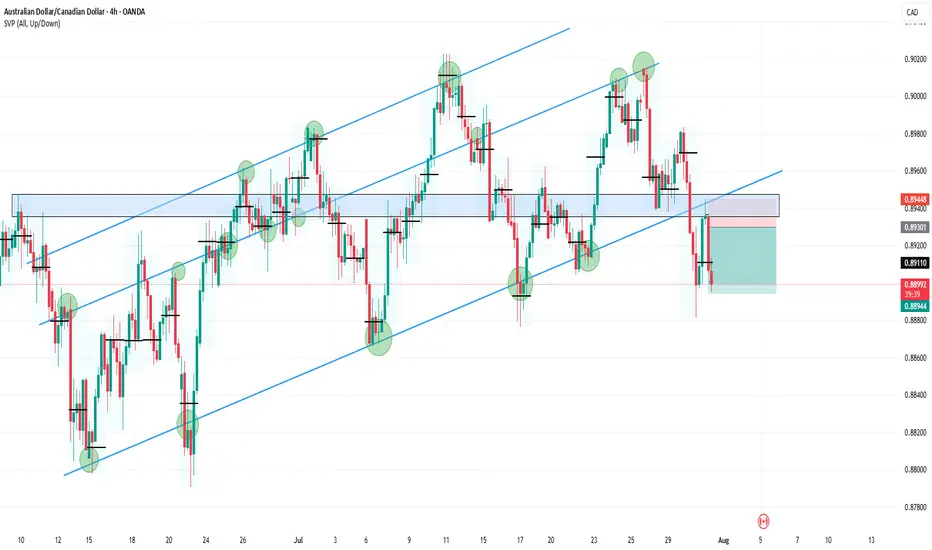
AUDCAD4HR:
The price broke down from a double parallel channel, forming a lower low, which confirms a bearish bias. It then pulled back to retest the broken channel and resistance, where a long-wick candle rejection occurred.
This rejection also aligned with multiple previous Points of Control (POC), adding confluence.
Afterward, a shift from bullish to bearish was confirmed on the 15-minute timeframe.
A clean 1:2 risk-reward trade setup followed.
Decentraland: Where Are the Bulls?Decentraland’s MANA has recently struggled to sustain the upward momentum of wave iii in orange. Nonetheless, our primary scenario remains that this move should eventually push the altcoin above the $0.40 resistance level. Overall, we anticipate the full five-wave orange sequence could extend beyond the next key threshold at $0.85 before the larger blue wave (i) reaches its peak. Conversely, our 25% likely alternative scenario still allows for a new wave corrective low below the $0.19 support.
📈 Over 190 precise analyses, clear entry points, and defined Target Zones - that's what we do (for more: look to the right).

BoJ keep interest rate unchanged, yen weakeningFollowing the July meeting, the BoJ maintained its interest rate at 0.5%, citing prevailing uncertainties from trade tariffs. Concurrently, the BoJ revised its inflation forecast upward to 2.7% YoY from 2.2%. The central bank's language on economic uncertainty has become less pessimistic, downgrading trade policy risks from "extremely high" to "high uncertainties remain," which signals a growing, albeit cautious, confidence in the economic outlook.
In the US, the June PCE surged to 2.6% YoY, surpassing the 2.5% prev. cons. The increase was attributed to tariff impacts, with Goods prices rising 0.4% MoM, the fastest pace since January, while Services prices held steady at 0.2% MoM.
The higher-than-expected US PCE data and the BoJ's decision to hold interest rates have continued to drive further appreciation of the USDJPY.
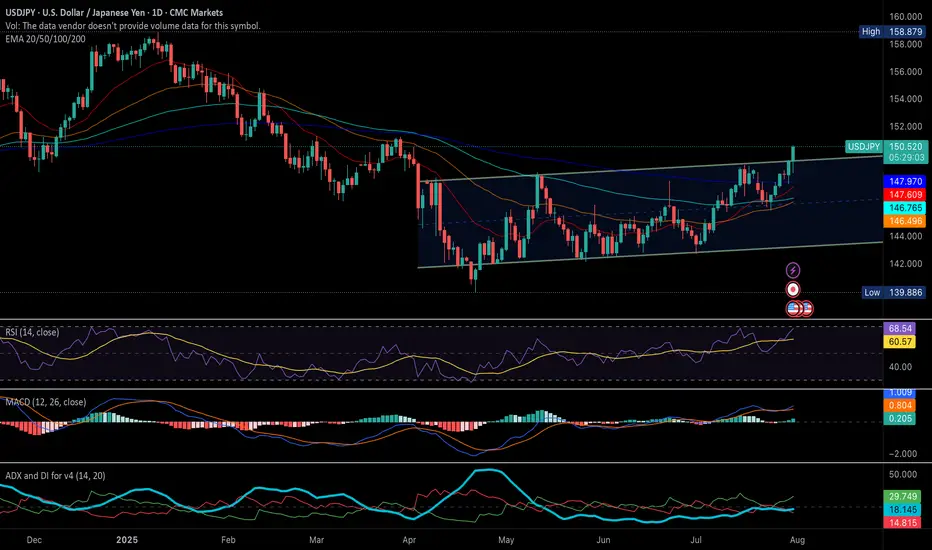
USD/JPY Technical Analysis
The USD/JPY pair is trading above its EMAs extensions, signaling a continuation of the bullish momentum. The price has successfully breached the ascending resistance trendline. However, the RSI is in overbought territory, suggesting that the current rally may be extended, and a potential pullback could be imminent.
The pair could continue to test the resistance level at 151.367. Should it fail to break this level, a rebound could see the USD/JPY pair test the support at 149.65.
By Van Ha Trinh - Financial Market Strategist at Exness
EURJPY: Short Trade Explained
EURJPY
- Classic bearish formation
- Our team expects pullback
SUGGESTED TRADE:
Swing Trade
Short EURJPY
Entry - 171.66
Sl - 172.11
Tp - 170.81
Our Risk - 1%
Start protection of your profits from lower levels
Disclosure: I am part of Trade Nation's Influencer program and receive a monthly fee for using their TradingView charts in my analysis.
❤️ Please, support our work with like & comment! ❤️


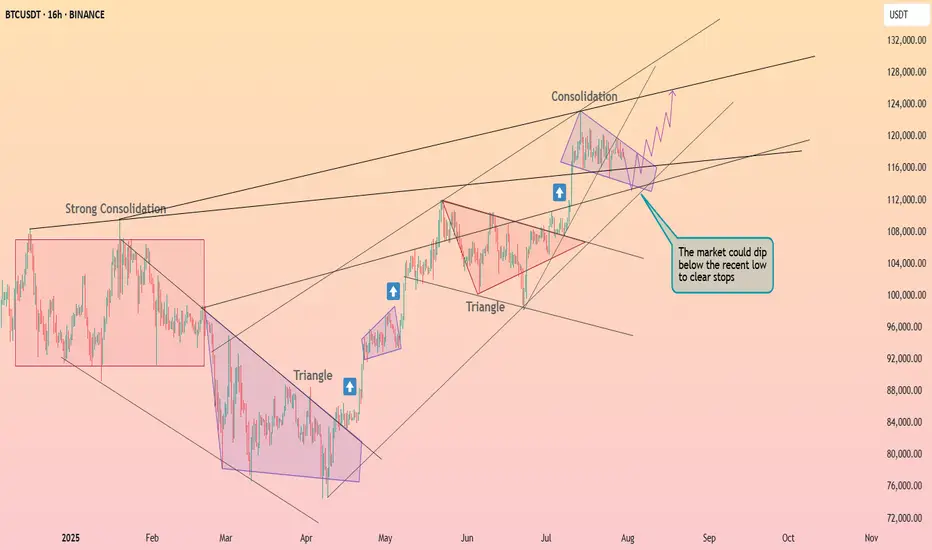
Bitcoin held the $115k level ┆ HolderStatBINANCE:BTCUSDT is currently in a triangle formation just above key support near 112,000. The price recently dipped below short-term support, likely triggering stop-losses, but still holds inside a bullish structure. If momentum builds, a push toward 125,000+ is likely. The trend remains intact above 110,000.