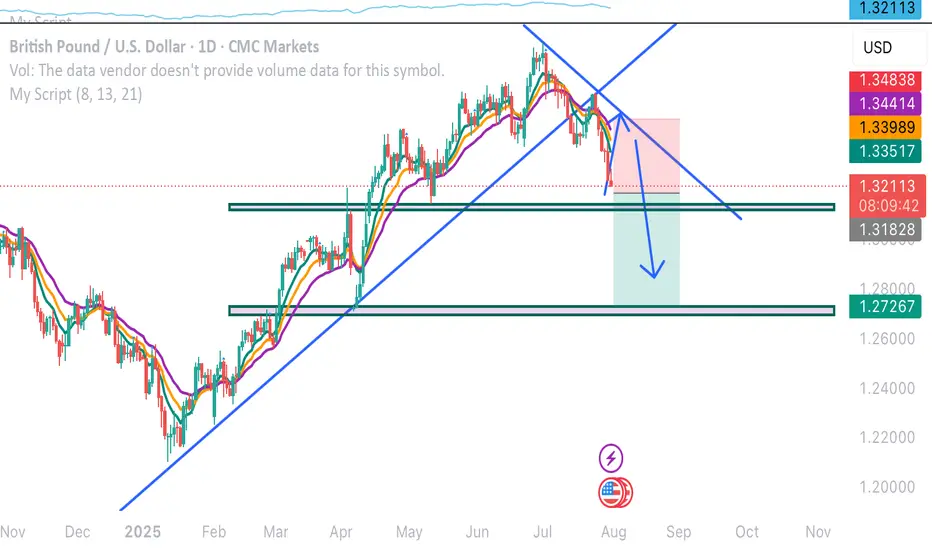
GBPUSD OUTLOOKHey traders what’s your take on this ? If it breaks the that zone, expect a bearish continuation
Chart Patterns
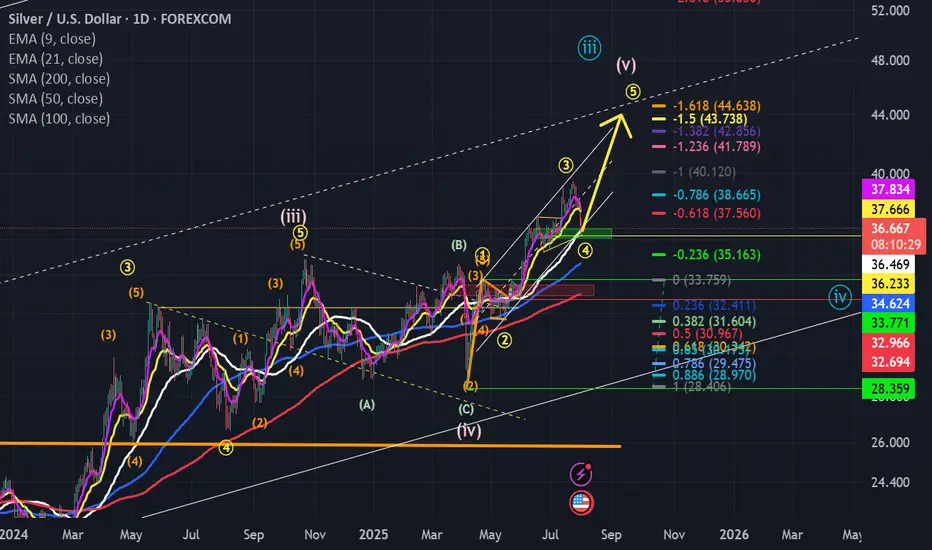
Not time to dismount yet!!!Dont get shaken off the horse...yet. There is more to come imo...this is to shake the weak hands...
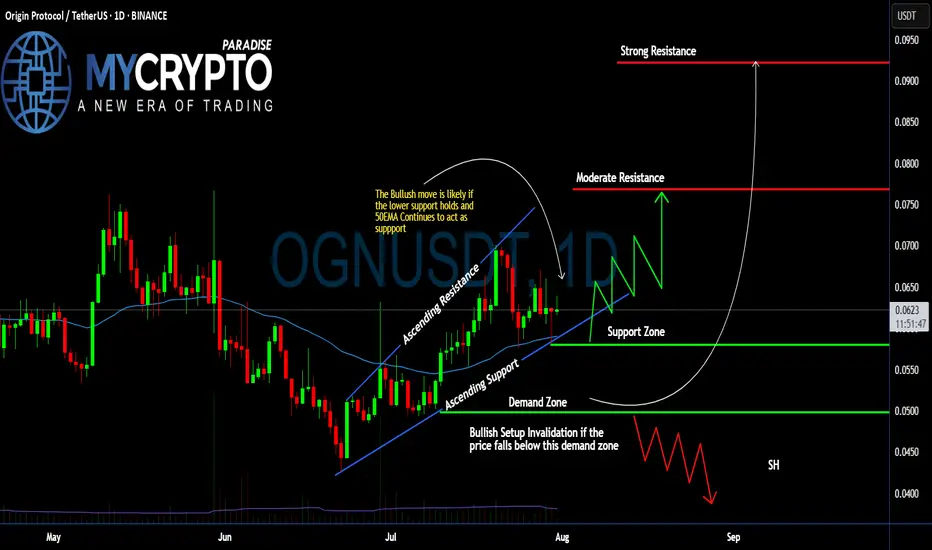
#OGN Ready For a Massive Bullish Move | Must Watch For BullsYello, Paradisers! Is #OriginProtocol about to explode to the upside, or is this a bull trap in disguise waiting to liquidate the impatient? Let’s break down what’s brewing on #OGNUSDT:
💎After forming a clean ascending channel, #OGN has been respecting both the ascending resistance and ascending support levels. Price is currently trading just above the 50 EMA, which has been acting as a dynamic support line since early July. This structure shows clear buyer interest around the $0.058–$0.062 zone—an area that aligns with volume cluster support.
💎The bullish scenario remains valid as long as #OGNUSD holds above the demand zone between $0.0499–$0.0580, and especially if it stays above the 50 EMA. As long as this structure is maintained, we could see a bounce toward the moderate resistance level at $0.076, where previous sellers stepped in and price stalled.
💎If buyers can break through that moderate resistance with strength and rising volume, the next key target lies at $0.092, which aligns with a strong resistance level and high-volume node on the visible range. This area is likely to trigger a reaction, so traders should remain agile.
💎However, if price breaks down below the demand zone, this would invalidate the current bullish setup and open the door for a potential move back toward the $0.045–$0.040 area. A broader shakeout would likely accompany this and could trap many late long entries.
Stay patient, Paradisers. Let the breakout confirm, and only then do we strike with conviction.
MyCryptoParadise
iFeel the success🌴
gold on buy retrace#XAUUSD price have reformed back above 3306, now we are expecting bullish from 3309 on 2 times breakout.
Entry 3309 2 times breakout, target 3326-3335, SL 3297.
Below 3297 holds bearish reversal, target 3270. 3317 will reject, H1 closure there will continue bullish.

BITCOIN, GOLD ANALYSISQuickly we dive into analyzing our favorite pairs for the day we check and confirmed our directional biased which at the end of the day 1:2 is being targeted. BTC is is in a tricky spot but we will always follow the direction of the market to be more o the safer side.

GBPUSD in Trend ReversalGBPUSD is in bullish divergence and we observed an inverse FVG forming suggesting a reversal in trend
Entry Price 1.3237
Stop Loss 1.3200
Risk 1%
Lot 0.68
TP1 1.3274
TP3 1.3348

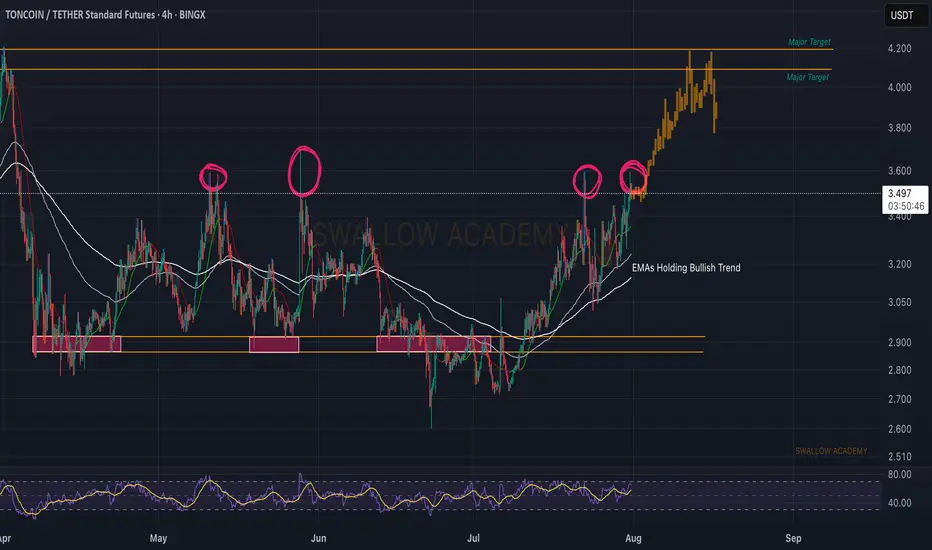
Toncoin (TON): Targeting $4.10TON coin looks still good; recently we filled one ofo ur targets and now price is near local liquidity area, which we intend to see to be broken and once we get that breakout, we are going to aim for the $4.10 area, so keep an eye on it for now
Swallow Academy
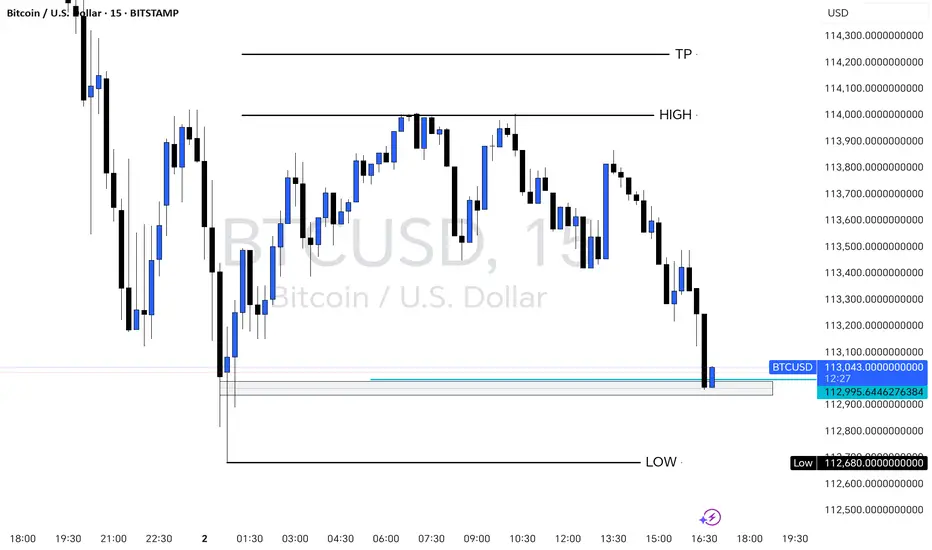
BITCOIN 15-Min Chart – Key Support Retest with Bullish PotentialThis 15-minute BTCUSD chart shows Bitcoin retesting a strong support zone near $112,680 after a clear downward move. The price is currently reacting at a previous demand area, marked in blue, just above the session’s LOW. A possible bullish reversal setup is forming if the support holds, targeting the previous HIGH around $114,000 and a potential TP at $114,200. Traders may look for confirmation signals (e.g., bullish engulfing, order block reaction) before entering long positions.
#MANTA/USDT – Bullish Setup Alert ?#MANTA
The price is moving within a descending channel on the 1-hour frame and is expected to break and continue upward.
We have a trend to stabilize above the 100 moving average once again.
We have a downtrend on the RSI indicator that supports the upward break.
We have a support area at the lower boundary of the channel at 0.190, acting as strong support from which the price can rebound.
We have a major support area in green that pushed the price upward at 0.186.
Entry price: 0.196
First target: 0.205
Second target: 0.214
Third target: 0.225
To manage risk, don't forget stop loss and capital management.
When you reach the first target, save some profits and then change the stop order to an entry order.
For inquiries, please comment.
Thank you.

#LINK/USDT targeting 17.77 $ ?#LINK
The price is moving within a descending channel on the 1-hour frame and is expected to break and continue upward.
We have a trend to stabilize above the 100 moving average once again.
We have a downtrend on the RSI indicator that supports the upward break.
We have a support area at the lower boundary of the channel at 15.60, acting as strong support from which the price can rebound.
We have a major support area in green that pushed the price higher at 15.30.
Entry price: 15.84
First target: 16.47
Second target: 17.00
Third target: 17.77
To manage risk, don't forget stop loss and capital management.
When you reach the first target, save some profits and then change the stop order to an entry order.
For inquiries, please comment.
Thank you.

The Power of Support, Resistance, and Moving Averages**Analyzing Ocean Protocol (OCEAN/USD): The Power of Support, Resistance, and the 21 EMA**
When trading or investing in the ever-changing world of cryptocurrencies, technical analysis tools offer vital insights into price action and market psychology. Let’s explore how these concepts play out in the recent price chart of Ocean Protocol (OCEAN/USD).
**Dynamic and Static Support/Resistance: A Quick Primer**
Support and resistance are foundational concepts in technical analysis:
- **Support** refers to price zones where a declining market tends to find a “floor,” often pausing or reversing losses.
- **Resistance** marks zones where rising prices tend to stall or reverse, acting as a “ceiling.”
On the OCEAN/USD weekly chart, I marked these static levels at price points where the market has historically reacted, reflecting the areas of repeated reversals or consolidation. Identifying these levels allows traders to anticipate potential moves and manage risk.
**The 21 Exponential Moving Average (EMA): A Dynamic Barrier**
A standout element on our chart is the 21-period EMA, plotted as a gently curving yellow line. Unlike static horizontal lines, the 21 EMA moves with price action, providing a dynamic measure of the prevailing trend. My analysis confirms that:
- In uptrends, the 21 EMA often acts as a support, helping price bounce higher during pullbacks.
- In downtrends, it acts as resistance, causing rallies to stall or reverse.
Repeated interactions between OCEAN’s price and the 21 EMA further validate its role as a crucial area to watch, where buyers and sellers contend for control.
**Descending Resistance and Support: Guiding the Trend**
I’ve also drawn descending (diagonally sloping) trendlines to highlight the broader bearish structure since mid-2024. These lines mark a channel where price has generally been contained, further defining the primary market trend and its boundaries.
**Conclusion: Clarity from Structure**
Through the combination of classic support and resistance lines and the dynamic 21 EMA—which both reliably reflect real market turning points—this analysis brings clarity to OCEAN’s current market structure. These tools not only offer traders a roadmap for likely reactions but also foster a disciplined approach to navigating crypto’s volatility.
*By combining proven tools like horizontal and diagonal support/resistance with the dynamic insight that moving averages provide, traders can approach complex charts like OCEAN/USD with greater confidence and objectivity.*
Please keep an eye for a breakout above the 21 EMA 0.33 price area for possible bullish action. Be cautious of fakeouts and liquidations.
(Some help with the AI Perplexity)

PUMPIMHO once we cross the level above EMA 200 there is launching area to this two zones. Be accurate this thing very active. NFA - DYOR

#BONK/USDT About to Break Out !#BONK
The price is moving within a descending channel on the 1-hour frame and is expected to break and continue upward.
We have a trend to stabilize above the 100 moving average once again.
We have a downtrend on the RSI indicator that supports the upward break.
We have a support area at the lower boundary of the channel at 0.00002440, acting as a strong support from which the price can rebound.
We have a major support area in green that pushed the price upward at 0.00002372.
Entry price: 0.00002552.
First target: 0.00002694.
Second target: 0.00002882.
Third target: 0.00003118.
To manage risk, don't forget stop loss and capital management.
When you reach the first target, save some profits and then change the stop order to an entry order.
For inquiries, please comment.
Thank you.

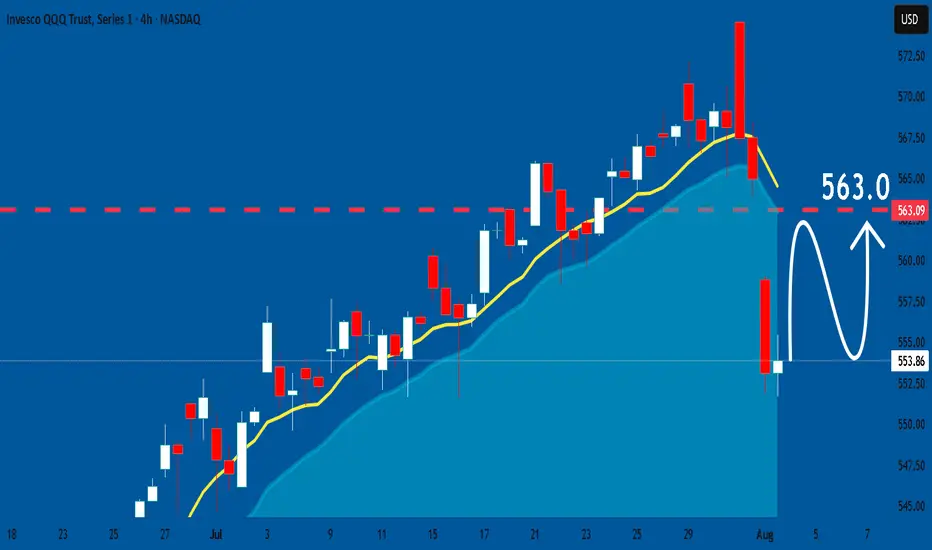
QQQ: Expecting Bullish Continuation! Here is Why:
Our strategy, polished by years of trial and error has helped us identify what seems to be a great trading opportunity and we are here to share it with you as the time is ripe for us to buy QQQ.
Disclosure: I am part of Trade Nation's Influencer program and receive a monthly fee for using their TradingView charts in my analysis.
❤️ Please, support our work with like & comment! ❤️
#PEPE/USDT or Breakdown? PEPE Eyes 0.00001166 Target !#PEPE
The price is moving within a descending channel on the 1-hour frame and is expected to break and continue upward.
We have a trend to stabilize above the 100 moving average once again.
We have a downtrend on the RSI indicator that supports the upward break.
We have a support area at the lower boundary of the channel at 0.00000980, acting as a strong support from which the price can rebound.
We have a major support area in green that pushed the price upward at 0.00000990.
Entry price: 0.00001030.
First target: 0.00001075.
Second target: 0.00001120.
Third target: 0.00001166.
To manage risk, don't forget stop loss and capital management.
When you reach the first target, save some profits and then change the stop order to an entry order.
For inquiries, please comment.
Thank you.

TESLA: Bullish Continuation & Long Trade
TESLA
- Classic bullish setup
- Our team expects bullish continuation
SUGGESTED TRADE:
Swing Trade
Long TESLA
Entry Point - 302.63
Stop Loss - 296.98
Take Profit - 312.87
Our Risk - 1%
Start protection of your profits from lower levels
Disclosure: I am part of Trade Nation's Influencer program and receive a monthly fee for using their TradingView charts in my analysis.
❤️ Please, support our work with like & comment! ❤️

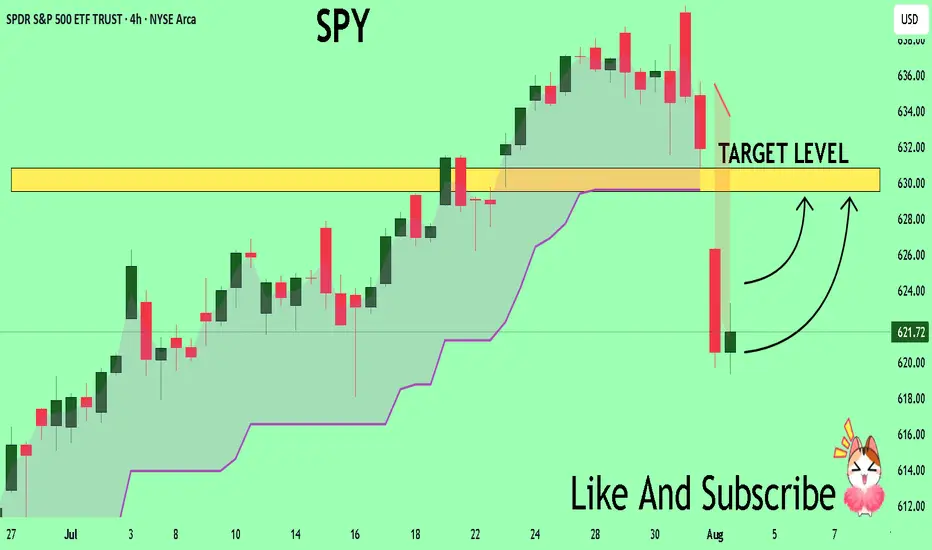
SPY Massive Long! BUY!
My dear subscribers,
My technical analysis for SPY is below:
The price is coiling around a solid key level - 621.72
Bias - Bullish
Technical Indicators: Pivot Points Low anticipates a potential price reversal.
Super trend shows a clear buy, giving a perfect indicators' convergence.
Goal - 629.55
About Used Indicators:
By the very nature of the supertrend indicator, it offers firm support and resistance levels for traders to enter and exit trades. Additionally, it also provides signals for setting stop losses
Disclosure: I am part of Trade Nation's Influencer program and receive a monthly fee for using their TradingView charts in my analysis.
———————————
WISH YOU ALL LUCK
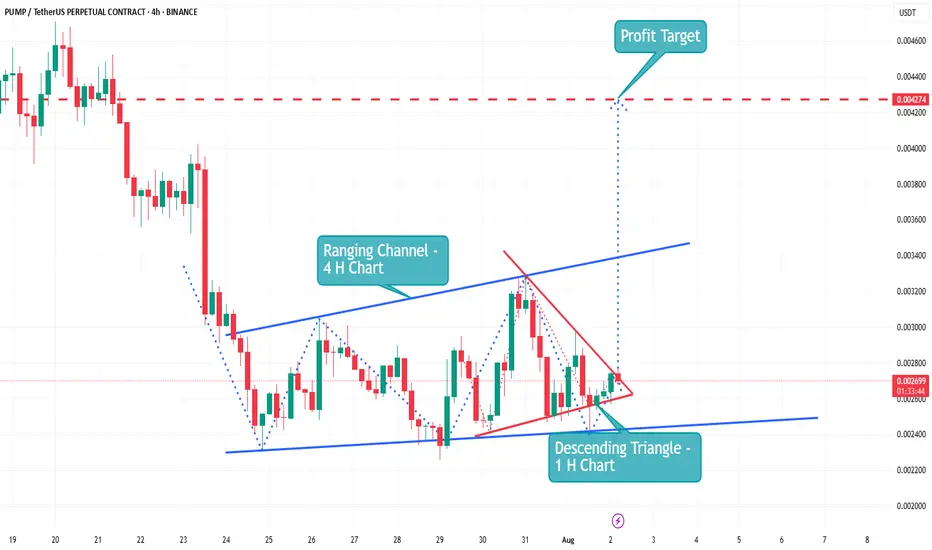
The Pump coin is now showing an upward trend | Live AnalysisPump ▶️
The Pump coin has now touched its All Time Low.🕯
The coin is now showing an upward trend.👀
🛫 a Descending Triangle is currently forming a breakout on the 1H chart.
🛫 Making a Ranging Channel on the 4 H Char
🛫 Make A CHoCH (1H)
🛫 Bullish OB (1H)
🛫 Buy Tag (1 H)
🛫 Making Golden Cross (1 H

XRPUSDT 4H – Pullback Into Support, But Will This Bounce Stick?XRP has retraced nearly 25% off its local highs after a powerful +90% move in July. Price is now pulling back into a well-defined demand zone around 2.85–2.88, which previously triggered the breakout impulse.
📌 What’s notable:
Clean retest of demand + price hovering above the final bullish structure
EMAs are overhead, but not yet fully bearish — a reclaim could flip short-term bias
The lower demand zone (~2.15–2.25) still stands as a last line of defense from the original rally base
This bounce attempt is key — a strong push from here could send price back toward the $3.30–3.50 region. But if bulls fail to hold, there’s room for a deeper retracement.
Trade Planning Notes:
Aggressive Long: Entry on wick into support with tight invalidation
Conservative Long: Wait for EMA reclaim confirmation
Bearish Case: Breakdown = target $2.25 zone
The path from here decides whether this is a healthy pullback — or the start of a reversal. What’s your play? 👇

Ethusd $2500 I suspect may be the last dipTechnical analysis on ethusd .
Whilst everyone is bullish from current level, my technicals is telling me $2500 region which is key for upward movement or a break makes it want to go lowet

NZDUSD What Next? SELL!
My dear subscribers,
This is my opinion on the NZDUSD next move:
The instrument tests an important psychological level 0.5920
Bias - Bearish
Technical Indicators: Supper Trend gives a precise Bearish signal, while Pivot Point HL predicts price changes and potential reversals in the market.
Target - 0.5899
My Stop Loss - 0.5932
About Used Indicators:
On the subsequent day, trading above the pivot point is thought to indicate ongoing bullish sentiment, while trading below the pivot point indicates bearish sentiment.
Disclosure: I am part of Trade Nation's Influencer program and receive a monthly fee for using their TradingView charts in my analysis.
———————————
WISH YOU ALL LUCK

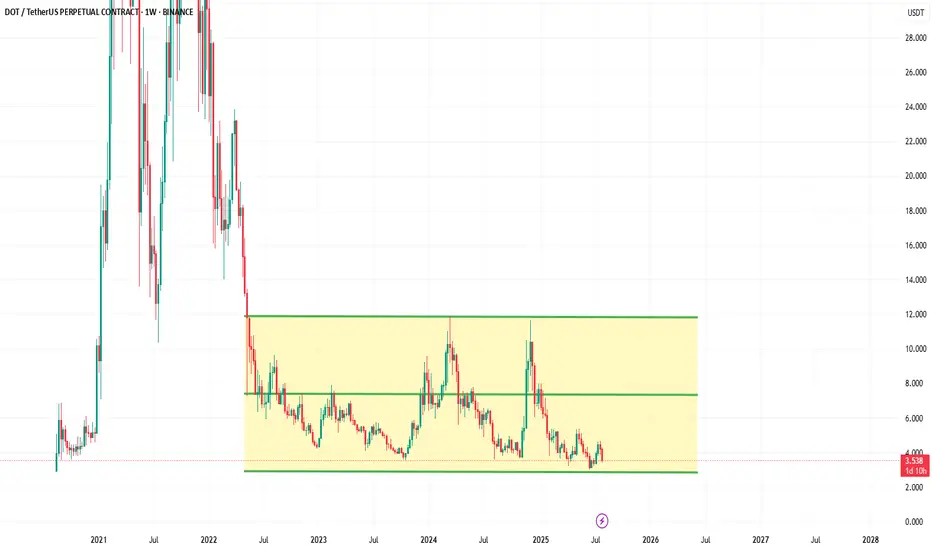
DOT is sitting at the bottom of the Weekly Channel💰 #DOT is sitting at the bottom of the Weekly Channel👀
Given the fact that market is in correction mode, it's literally the dip🔥
Target: 10$📈