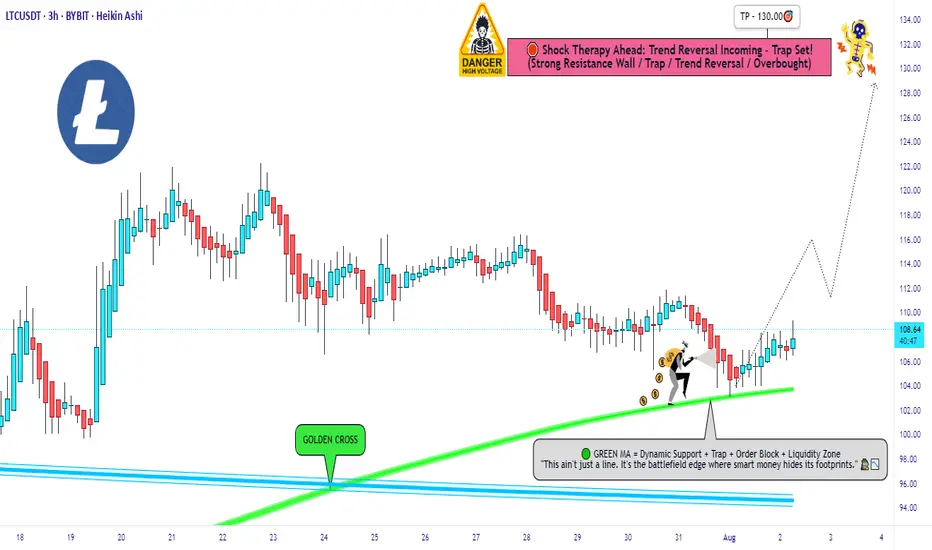
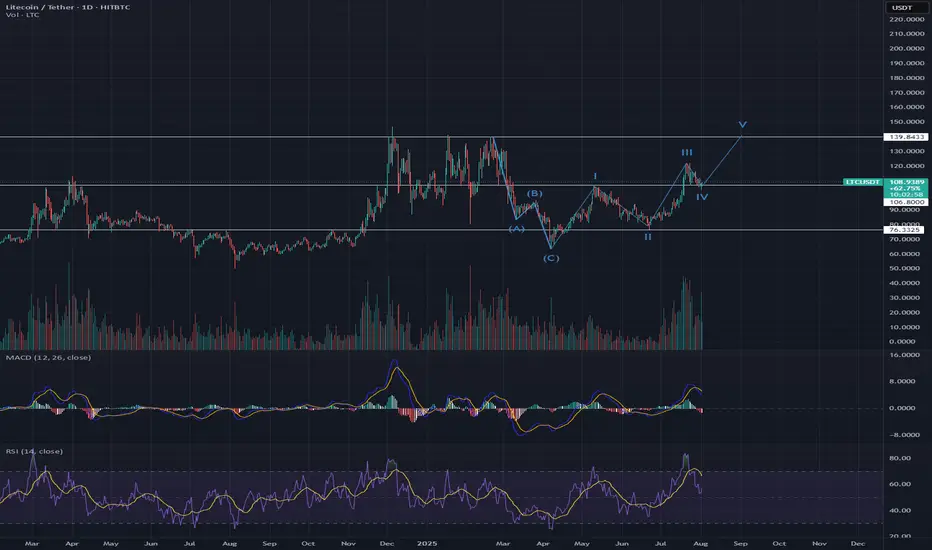
LTC/USDT Robbery Underway | Bullish Setup, Get In Now!🔥💎 LTC/USDT HEIST PLAN: ROB AT ANY PRICE! 💎🔥
🚨 Bullish Move Incoming | Layered Entries | Thief Trader Exclusive 🚨
🌟Hi! Hola! Ola! Bonjour! Hallo! Marhaba!🌟
Dear Money Makers & Market Robbers, 🤑💰💸✈️
The time has come for another high-stakes Thief Trading heist, and this time we're lockin' in on LTC/USDT – aka "Litecoin vs Tether" 💣💸
🎯 Thief’s Mission Plan: BULLISH AT ANY PRICE LEVEL!
We're going full stealth mode with a layering strategy — stacking multiple limit orders like a true pro thief preparing for a clean escape! 🔪📉📈
🚪 ENTRY: "Anywhere, Anytime" 🚪
📈 Buy from any price level — but for optimal entry:
🟢 Use Buy Limit orders near recent lows (15-30 min TF)
🔔 Don’t forget to set alerts for breakout confirmation!
🛑 STOP LOSS: Strategic Defense 🛑
🗣️ "Listen up, team! Stop loss ain’t a maybe — it’s your armor. Place it smart, or prepare for pain." 🔥
📍Recommended SL: 100.00
🔐 Adjust based on your lot size & how deep you stack your orders.
🏁 TARGET: 130.00 🏁
💸 But always Escape Early if the plan gets too hot!
Use a Trailing SL to lock in gains and slip out clean 😎🧨
🧠 PRO TIPS from the THIEF:
🔎 Only Buy. No Shorting!
💣 Scalpers: Jump in with the trend, not against it.
🧲 Swing Traders: Stay patient, and execute the full heist.
🚀 Use Trailing Stops – Let profit ride, but stay protected!
📢 MARKET INSIGHT:
🔥 Bullish Bias backed by:
✅ On-Chain Metrics
✅ Sentiment Shifts
✅ Macro Flows
✅ COT Reports
✅ Intermarket Divergence
⚠️ TRADING ALERT: Stay Sharp!
📰 News Events = Volatility.
💡 Avoid fresh entries during high-impact events.
📉 Use Trailing SL to secure your running trades.
💖 SUPPORT THE CREW 💖
🚀 Smash that Boost Button if you believe in the Thief Style Strategy
👑 Let's rob the market together, one level at a time.
🧠 Stay sharp, stay sneaky – and I’ll see you at the next target 🎯
— Thief Trader 🐱👤💰🚁🌍
Chart Patterns
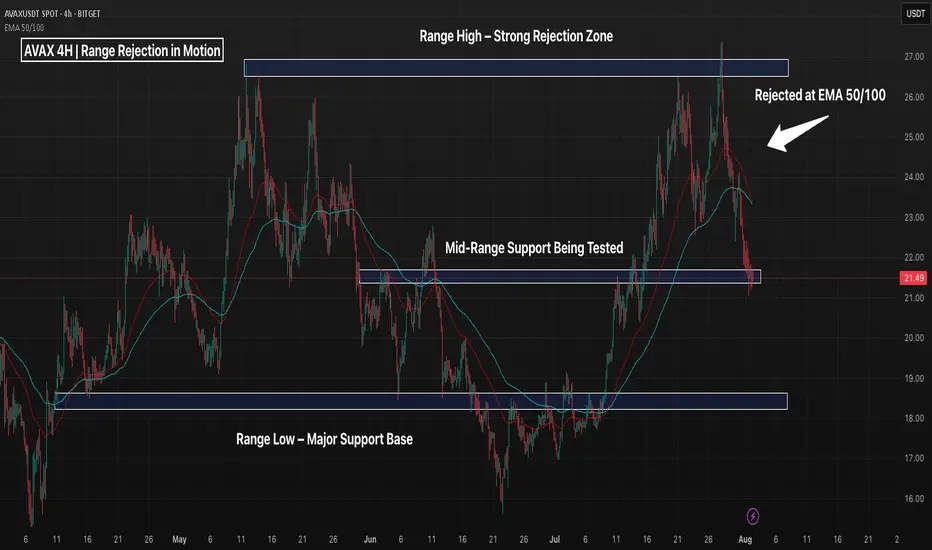
AVAX - Rejected at Range High, Now Testing Mid-Zone SupportAVAX just printed a textbook range rejection from the $26–27 resistance zone, which has capped price action since April. After rejecting the 50/100 EMA cluster, price is now testing mid-range support around $21.50 — a level that has historically offered short-term bounce opportunities or clean breakdown setups.
📌 Key Zones:
Top Resistance (~$26.50–27): Strong sell zone — multiple rejections
Mid-Range (~$21.50): Currently being tested for a possible bounce
Bottom Support (~$18.20–19): Range base with prior reversal history
📉 Reclaiming the EMAs could suggest another trip toward the highs, but failure to hold $21.50 opens the door to a deeper move toward $19 — or even a range breakdown if broader momentum weakens.
This chart highlights the importance of range trading structure — clean rejection up top, bounce attempt in the middle, and final line in the sand at the bottom.
Trade Idea Scenarios:
Bullish: Bounce + reclaim of $23.50 EMAs = long toward $25+
Bearish: Breakdown below $21.50 = short toward $19 or lower
How are you playing this range? 👇
EURUSD: Bears Will Push Lower
Remember that we can not, and should not impose our will on the market but rather listen to its whims and make profit by following it. And thus shall be done today on the EURUSD pair which is likely to be pushed down by the bears so we will sell!
Disclosure: I am part of Trade Nation's Influencer program and receive a monthly fee for using their TradingView charts in my analysis.
❤️ Please, support our work with like & comment! ❤️

ETH Price Weakens: Watching This Strong Demand Zone Closely$ETH/USDT Analysis (12H)
Ethereum has broken below a key support zone, confirming short-term weakness in price structure.
At the same time, the RSI is showing bearish divergence, signaling slowing momentum while the price was making higher highs — a classic early warning of a potential drop.
Now all eyes are on the strong demand zone below. If ETH finds support there, we could see a solid bounce or even a full trend reversal. But if this zone fails, deeper correction may follow.
DYOR, NFA
Thanks for the reading

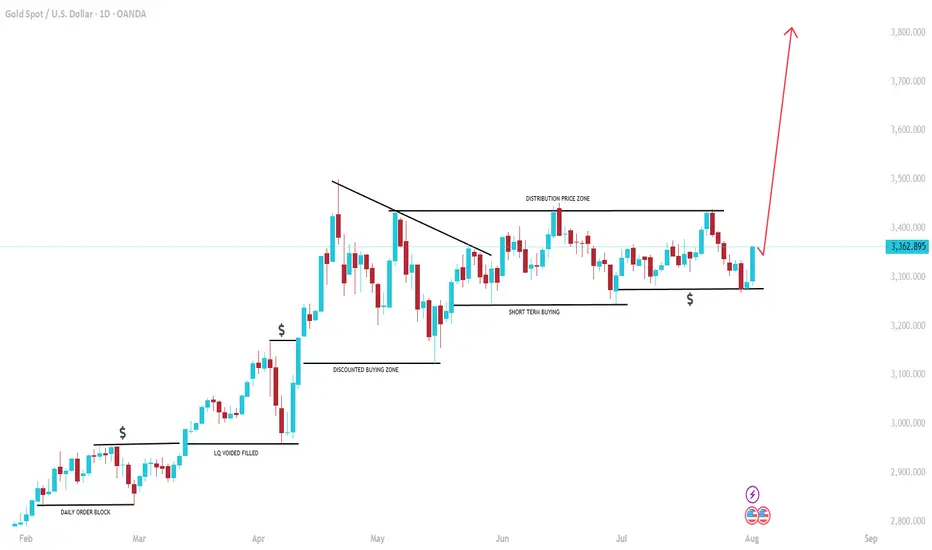
GOLD: $4000 on the way! Bulls has the controlGold is on the way hitting a record high since the global tension rising we can see gold creating another record high. Please note that it is a swing trades and may take weeks and months to hit the target or it may not even reach the target itself. This is prediction only so do your own due diligence.
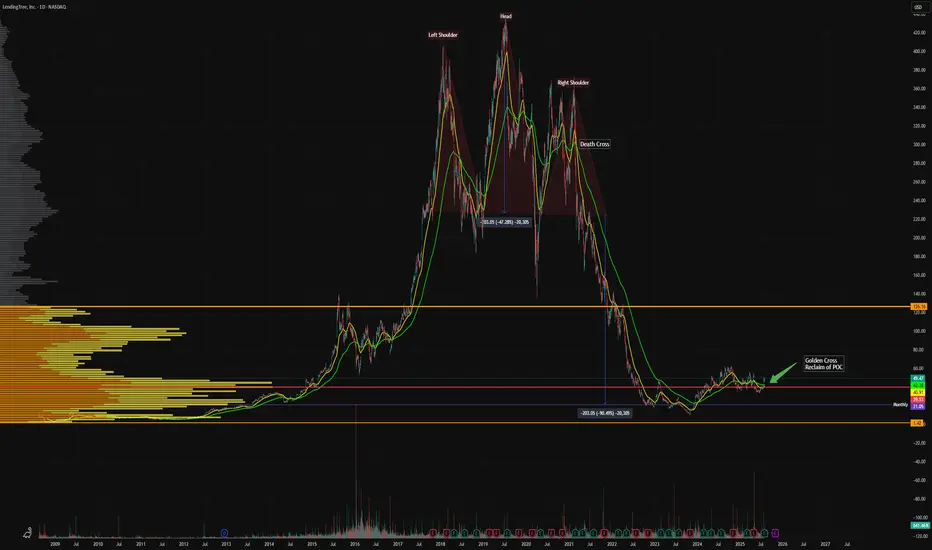
Interest Rate Cutting Cycle - Opportunity?LendingTree is well positioned to benefit from a declining interest rate environment. As the rates fall, consumer appetite for refinancing, mortgages and personal loans typically surge. This is likely to boost TREE's lead generation revenue.
The company's recent revenue pick up in recent quarters indicates early signs of this rebound and the chart has recovered from its Head and Shoulders drop. We have a reclaim of the POC and an imminent death cross.
Trading at a historically low valuation, do you believe TREE can scale quickly in renewed customer demand? It's highly likely IMO. This is high up on my watchlist.
Not financial advice, do what's best for you.
BTCUSD: Long Signal with Entry/SL/TP
BTCUSD
- Classic bullish formation
- Our team expects growth
SUGGESTED TRADE:
Swing Trade
Buy BTCUSD
Entry Level - 11326
Sl - 11231
Tp - 11516
Our Risk - 1%
Start protection of your profits from lower levels
Disclosure: I am part of Trade Nation's Influencer program and receive a monthly fee for using their TradingView charts in my analysis.
❤️ Please, support our work with like & comment! ❤️

TriangleIf price closes below the trendline(white line on chart)there is a possibility, for price to touch the Demand Zone below. If price breaks resistance around the 0.83 area the asset can touch the 1.00 area. Please be careful of fakeouts and liquidations and consolidations.

Asian Paints Forming a W pattern looks bullish above 2613Asian Paints is showing a bullish reversal setup with a clear W pattern (Double Bottom) forming on the daily chart. The stock has tested the ₹2500 support zone twice and bounced, indicating strong buying interest. It is now approaching the neckline at ₹2600, a critical breakout level.
A sustained move above ₹2613, especially with good volume, could confirm the breakout and push prices toward the ₹2675–₹2700 zone, with a possible extension toward ₹2735. This setup provides a favorable risk-reward opportunity.
Trading Plan:
• Entry: Above ₹2613 on confirmation
• Stop Loss: ₹2580 (conservative) or ₹2560 (aggressive)
• Target: ₹2675–₹2700 (initial), ₹2735+ (extension)
Why it matters:
• Strong base at ₹2550 zone
• W pattern signaling reversal
• Breakout potential on good volume
This is a price-action-based setup, supported by pattern structure. Keep an eye on volume and market sentiment for confirmation and Ofcourse Nifty 50 needs to be bullish
Let me know your thoughts in comments
🔔 This is not financial advice. Please do your own analysis before taking any trade.

GBPUSD is in Bearish Reversal Head & ShoulderGBPUSD is showing clear bearish head & shoulder pattern on daily chart it will retrace for some time to get close to the price 1.33788 at that point short sell will be good

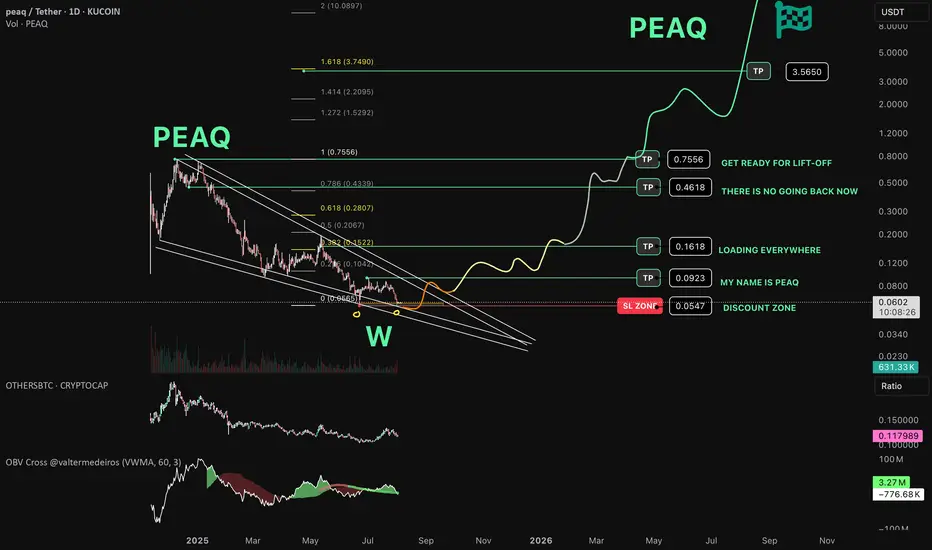
PEAQ Network about to make another pea(q) ? Bottom can be IN!
// ==================================
// ====THE===========================
// ========MACHINE=============^^====
// ===============NEEDS===TALK=======
// ====================TO============
// ==================================
Is this the time?
Chart Recap
🔍 Pattern:
Price formed a falling wedge pattern, which typically signals a potential bullish reversal.
A large W-shaped double bottom pattern is highlighted at the wedge's base, adding strength to the bullish thesis. Can this be the awaited bottom?
🟢 Accumulation & Support Zone :
"DISCOUNT ZONE" is marked near $0.0547, aligned with the wedge support.
Repeated touches at this level suggest strong buyer interest — also called "MY NAME IS PEAQ" and "LOADING EVERYWHERE"
🚀 Bullish Scenario & Targets:
If the wedge breakout plays out:
TP1: $0.0923 – early target near the local range high.
TP2: $0.1618 – aligns with the 0.382 Fib level.
Labeled as “LOADING EVERYWHERE”
TP3: $0.4618 – near the 0.618 retracement.
“THERE IS NO GOING BACK NOW”
TP4: $0.7556 – previous swing high.
“GET READY FOR LIFT-OFF”
TP5: $3.5650 – long-term Fib extension target (1.618).
Ultimate moonshot-level target.
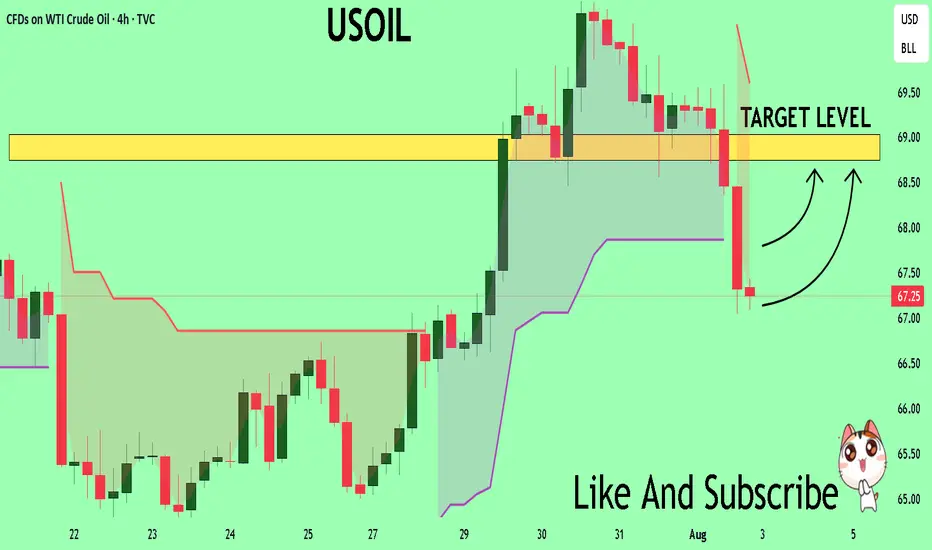
USOIL Technical Analysis! BUY!
My dear followers,
I analysed this chart on USOIL and concluded the following:
The market is trading on 67.25 pivot level.
Bias - Bullish
Technical Indicators: Both Super Trend & Pivot HL indicate a highly probable Bullish continuation.
Target - 68.74
About Used Indicators:
A super-trend indicator is plotted on either above or below the closing price to signal a buy or sell. The indicator changes color, based on whether or not you should be buying. If the super-trend indicator moves below the closing price, the indicator turns green, and it signals an entry point or points to buy.
Disclosure: I am part of Trade Nation's Influencer program and receive a monthly fee for using their TradingView charts in my analysis.
———————————
WISH YOU ALL LUCK
Ethereum Breakdown Imminent: Bearish Triple Tops confirmedEthereum has fired off multiple bearish signals that traders and investors cannot ignore. A confirmed triple top on the daily chart suggests exhaustion at resistance, while the appearance of a hanging man candlestick pattern adds weight to the reversal thesis.
The daily RSI has confirmed a bearish divergence, and the MACD has officially crossed below the zero line—marking a shift in momentum and confirming bearish control.
In this video, I’ll break down:
• The triple top formation and its implications
• Why the 200 EMA is the next major support target
• The significance of RSI and MACD confirmations
• What traders should watch for in the coming sessions
This isn’t just noise—Ethereum’s technicals are flashing red. Make sure you’re prepared.

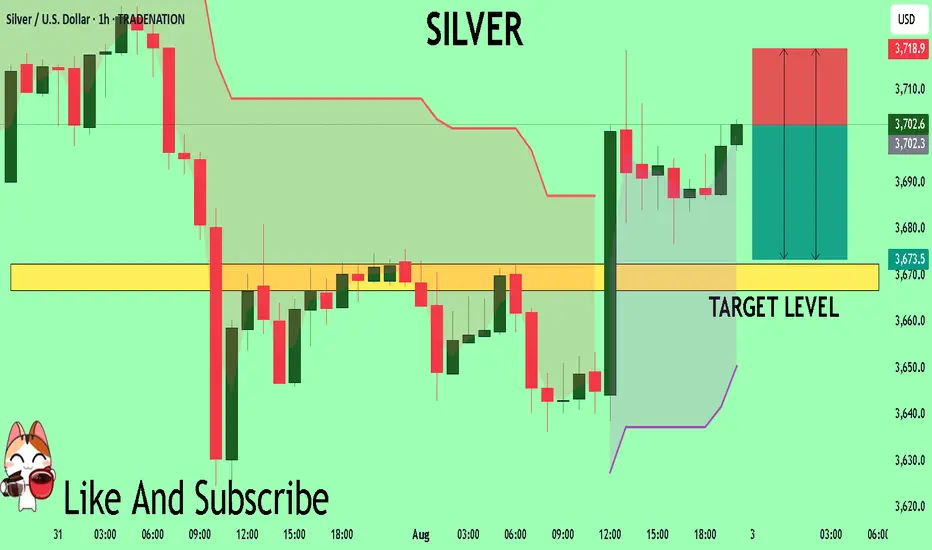
SILVER My Opinion! SELL!
My dear friends,
Please, find my technical outlook for SILVER below:
The price is coiling around a solid key level - 37.026
Bias - Bearish
Technical Indicators: Pivot Points Low anticipates a potential price reversal.
Super trend shows a clear sell, giving a perfect indicators' convergence.
Goal - 36.725
Safe Stop Loss - 37.189
About Used Indicators:
The pivot point itself is simply the average of the high, low and closing prices from the previous trading day.
Disclosure: I am part of Trade Nation's Influencer program and receive a monthly fee for using their TradingView charts in my analysis.
———————————
WISH YOU ALL LUCK
$76k incoming. Will Bitcoin de-couple from the altcoins? BTC.DCOINBASE:BTCUSD $76K incoming. Will Bitcoin de-couple from the altcoins? BTC.D

SEI - MACD Liquidity Tracker Nailed the Long, Now Flipping ShortThe MACD Liquidity Tracker Strategy just clocked a +103% long trade on SEI before momentum flipped and a short signal fired on this 8H chart.
The previous long captured a textbook impulse — clean MACD crossover, EMA alignment, and breakout confirmation. Now price is back under the 50/100 EMA, and MACD is turning decisively bearish.
📌 What’s notable:
QTP Strategy caught the entire move from ~$0.19 to ~$0.38
Fresh short entry printing as structure breaks down
MACD histogram and signal lines aligning with bearish momentum
If trend continuation plays out, this short could target the $0.24–0.22 zone. Alternatively, a reclaim of $0.30+ would invalidate.
Built-in logic helps filter out chop, so we’re watching to see if this becomes the next clean leg — or a trap before reversal.
—
Test it yourself with our preset configs or tweak for SEI’s volatility.
Ready for this reversal?👇


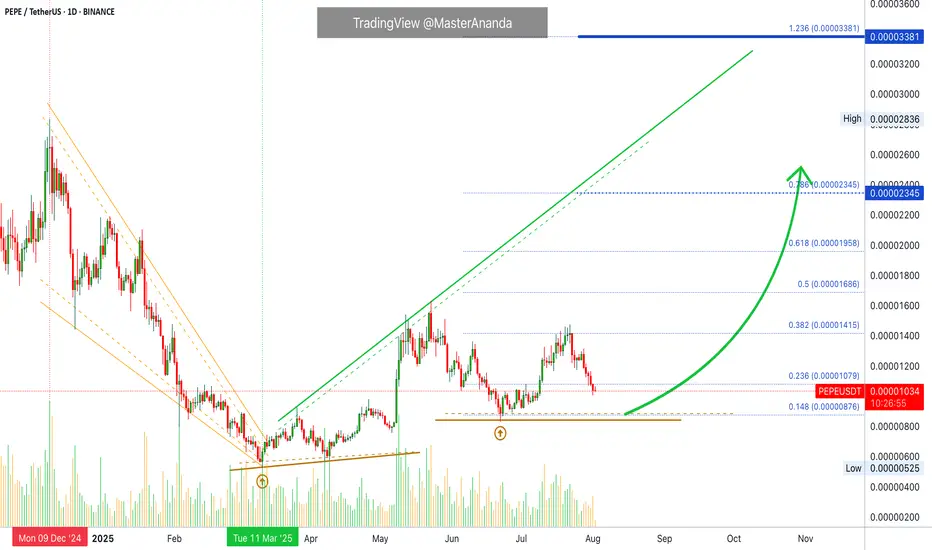
PEPE Will Turn Bullish · Strong Chart StructureThe market is one. We are all one and the same.
Crypto is one, and all the pairs move in the same way. Not in the exact same manner but the broader direction always tend to be the same.
PEPE is great because it reveals that the market isn't likely to go much lower. Since they all move together, the fact that PEPE will recover reveals that the others will recover.
PEPE grew in late 2024 together with the rest of the market. The first part of 2025 was a correction and the lows started to come-in in March and April. The first high in May, exactly the same as the rest of the market. A higher low in June and another high in July. Now a new retrace.
PEPEUSDT is trading on a very strong structure. We have a higher low from June but also from March. This makes it very unlikely that PEPE will produce a new low in this correction, which means that even now the correction is reaching its end. Volume is very low. If it isn't over then one major flash crash and the next day full green. That's how close we are from change.
Technical analysis
The market downtrend ended in March this year. From a low point PEPEUSDT switched from bearish to bullish. The trading is now happening within a bullish chart.
The main move peaked in May and the market is consolidating before additional growth. The action stays kind of sideways, mid-range, which shows that we are seeing consolidation. Consolidation always precedes a wave of growth, specially when the action is happening across marketwide support.
Namaste.
XAGUSD--SHORT--02-08.25--looking at multime-frame (M,W), short term great short opportunity
--entry around 37.52854 and 37.32500, TP is 35.267

NVIDIANVIDIA Corporation is a leading American technology company known for designing and manufacturing graphics processing units (GPUs), system-on-a-chip units (SoCs), and AI computing platforms. Founded in 1993, the company originally focused on gaming graphics but has since evolved into a global powerhouse in artificial intelligence, data centers, autonomous vehicles, and high-performance computing. NVIDIA’s GPUs are widely used not only in gaming and visual computing but also in scientific research, AI model training, machine learning, and cloud infrastructure.
In recent years, NVIDIA has been at the forefront of the global AI boom. Its data center business, powered by its high-end GPU architecture (like the H100 and newer generations), has become a critical backbone for tech companies, cloud providers, and governments seeking to build large-scale AI systems. The company also made major strategic moves through acquisitions and software integration, further solidifying its dominance in the AI hardware space. NVIDIA’s strong financial performance and technological leadership led to rapid growth in its market capitalization, briefly making it one of the most valuable companies in the world.
As of August 2025, NVIDIA’s stock is trading at $173.60 per share, following a stock split that adjusted its price while increasing liquidity. Despite broader market volatility, NVIDIA remains a key player driving the AI revolution and is closely watched by investors and analysts. Its valuation continues to be shaped by demand for AI chips, innovation in GPU architecture, and its ability to maintain technological leadership amid growing global competition. NVIDIA stands at the intersection of multiple megatrends, making it a critical stock in both the technology and semiconductor sectors.

WTIWTI crude oil (West Texas Intermediate) is one of the main global benchmarks for oil pricing, alongside Brent crude. It is a light, sweet crude oil primarily produced in the United States and traded on the New York Mercantile Exchange (NYMEX). WTI is known for its high quality and low sulfur content, making it ideal for refining into gasoline and other fuels. Crude oil prices are influenced by a wide range of factors including global supply and demand dynamics, geopolitical tensions, OPEC+ decisions, US shale production, and macroeconomic trends such as inflation and economic growth.
Over the past two decades, crude oil has experienced significant volatility. Prices surged to over $140 per barrel in 2008, collapsed during the global financial crisis, and again plummeted during the COVID-19 pandemic in 2020, when demand collapsed and prices briefly turned negative for the first time in history. The years following saw a sharp rebound as the global economy reopened and supply constraints persisted. However, rising interest rates, concerns about slowing global growth, and increasing energy transitions toward renewables have put downward pressure on oil demand in recent years.
As of August 2025, WTI crude oil is trading at $66.59 per barrel, reflecting a relatively weak energy market compared to its highs in 2022. The current price suggests concerns over slowing global industrial demand, increased US oil production, and ongoing geopolitical negotiations that have stabilized some of the previous supply shocks. While energy markets remain sensitive to global conflicts, economic shifts, and OPEC+ policy decisions, WTI at this level represents a market balancing between moderate demand and ample supply. It remains a critical asset for energy traders and a key indicator of global economic health.

US100The US100, also known as the Nasdaq 100 Index, tracks the performance of the 100 largest non-financial companies listed on the Nasdaq Stock Exchange, primarily in the technology, consumer services, and healthcare sectors. It is a market-capitalization-weighted index and includes major corporations such as Apple, Microsoft, Amazon, NVIDIA, Meta, and Alphabet. As a tech-heavy index, the US100 is highly sensitive to changes in interest rates, innovation cycles, investor sentiment, and macroeconomic indicators, especially those related to inflation, employment, and monetary policy.
Over the past two decades, the Nasdaq 100 has experienced strong long-term growth, driven by the expansion of the digital economy, cloud computing, artificial intelligence, and e-commerce. After a steep correction in 2022 caused by inflation concerns and aggressive rate hikes by the Federal Reserve, the index rebounded in 2023 and 2024, supported by improving macroeconomic conditions, a stabilization in interest rates, and renewed investor confidence in tech and growth stocks. AI-driven investments, semiconductor breakthroughs, and tech-led productivity gains have further fueled its momentum.
As of August 2025, the US100 is trading at 22,747, marking a new historical high. This reflects strong earnings performance from major tech companies, continued innovation in AI and automation, and a more dovish outlook from the Federal Reserve, which has helped reduce pressure on growth equities. Despite its gains, the index remains vulnerable to volatility stemming from inflation surprises, geopolitical risks, and shifts in central bank policy. The Nasdaq 100 continues to be a key benchmark for growth-oriented investors and a barometer for the health of the global tech sector.
