DXYThe DXY, or US Dollar Index, measures the value of the US dollar against a basket of six major world currencies: the euro (EUR), Japanese yen (JPY), British pound (GBP), Canadian dollar (CAD), Swedish krona (SEK), and Swiss franc (CHF). It is a weighted index, with the euro having the largest share, making movements in EUR/USD especially influential on the index. The DXY was created in 1973 by the US Federal Reserve to provide a clear benchmark for the dollar’s international strength after the collapse of the Bretton Woods system.
Since its inception, the DXY has served as a vital gauge of the dollar’s performance in global trade and financial markets. Historically, it reached its all-time high near 164.72 in 1985, during a period of aggressive US interest rate hikes and a strong economic expansion. Conversely, it hit its all-time low around 70.70 in 2008, at the peak of the global financial crisis, when confidence in the US economy sharply declined.
The index typically rises when investors seek safety in the US dollar, especially during global risk-off events or when US interest rates are relatively high. It also tends to strengthen during periods of US economic growth, reduced liquidity, or tightening by the Federal Reserve. On the other hand, the DXY weakens when the Federal Reserve cuts rates, inflation rises, or investor sentiment shifts toward riskier assets and other global currencies.
In the years following the COVID-19 pandemic, the DXY saw sharp movements. It rallied strongly in 2022 as the Federal Reserve raised interest rates aggressively to combat inflation, reaching levels above 114. This was followed by a pullback as inflation cooled and expectations of rate cuts emerged in 2023 and 2024. As of August 2025, the DXY stands at approximately 93.4, reflecting a weaker dollar compared to its recent highs, influenced by a more dovish Federal Reserve, growing US debt concerns, and rising investor interest in alternative assets such as gold and other currencies.
The DXY remains a key tool for traders, economists, and policymakers to assess the dollar’s position in the global economy. Its movements affect everything from commodity prices and trade balances to emerging market capital flows and inflation pressures worldwide.
Chart Patterns

EURUSDEUR/USD is the most traded currency pair in the world, representing the exchange rate between the euro (EUR) and the US dollar (USD). It reflects how many US dollars are required to purchase one euro. Introduced in 1999 with the launch of the euro, this pair has become a global benchmark due to the economic size and influence of both the Eurozone and the United States. It is highly liquid and closely watched by traders, investors, and policymakers, with its value shaped by monetary policy, interest rate differentials, macroeconomic indicators, and geopolitical developments.
Historically, EUR/USD has seen major swings. In the early 2000s, the pair fell to around 0.82 before rallying to a peak above 1.60 in 2008 during a period of dollar weakness. It then declined sharply during the European debt crisis. In 2022, amid aggressive interest rate hikes by the US Federal Reserve and rising global uncertainty, the pair briefly fell below parity, trading under 1.00 for the first time in nearly two decades. However, as inflation in the US began to ease and expectations of rate cuts grew, the euro gradually strengthened through 2023 and 2024.
As of August 2025, EUR/USD is trading around 1.15800. This reflects a moderate recovery of the euro from its lows, supported by a more stable Eurozone economy and a softer US dollar. The pair remains sensitive to central bank signals, particularly from the European Central Bank and the Federal Reserve, and is likely to continue reacting to shifts in monetary policy, inflation data, and global risk sentiment. EUR/USD remains a cornerstone of the forex market, widely used by traders for both short-term strategies and long-term positioning.

MAGICUSDT.P 15m – Short Setup at Key Fib ResistancePrice sharply rejected from the 0.2042 high and is now breaking below the 50%–61.8% Fibonacci retracement zone after a lower high. The move shows strong selling interest, aligning with MACD histogram momentum shift into the negative.

XAUUSDXAU/USD represents the exchange rate between one troy ounce of gold (XAU) and the US dollar (USD). It shows how much in US dollars is required to purchase one ounce of gold. This pair is widely traded across forex and commodities markets and is considered a key indicator of global economic stability and investor sentiment.
Historically, gold was pegged to the US dollar under the Bretton Woods Agreement from 1944 to 1971. During this period, one ounce of gold was fixed at $35, and the US government guaranteed the convertibility of dollars into gold. In 1971, President Richard Nixon ended the gold standard, allowing gold to trade freely on global markets. This led to significant volatility in the price of gold, which began to reflect real-time market forces such as supply, demand, inflation, and geopolitical events.
In the decades that followed, gold experienced several major price movements. In 1980, gold surged to around $850 per ounce due to high inflation and geopolitical instability. It then declined and remained relatively low through the 1990s, reaching a low near $270 in 2000. Starting in the mid-2000s, gold began a strong upward trend driven by concerns about inflation, financial crises, and central bank policies, culminating in a peak near $1,920 in 2011 during the Eurozone crisis and Federal Reserve monetary easing.
In 2020, gold hit a new all-time high around $2,070 during the global uncertainty of the COVID-19 pandemic. Since then, it has continued to be influenced by economic data, interest rate decisions, inflation trends, and geopolitical developments. In 2024 and 2025, gold has remained strong, supported by central bank buying and expectations of future rate cuts. As of August 2025, the current price of gold has reached $3,363 per ounce, reflecting heightened demand and ongoing macroeconomic uncertainty.
XAU/USD is influenced by many factors, including the strength of the US dollar, inflation expectations, geopolitical risks, and investor demand for safe haven assets. When the dollar weakens or global uncertainty increases, gold typically gains value. Traders and investors often use gold to hedge against economic instability, inflation, or currency devaluation.
Today, gold remains one of the most important assets in global markets, and XAU/USD continues to be a major pair for both short-term traders and long-term investors.

Major Warning: Bitcoin Breaches Key Support with Bearish SignalsBitcoin has officially broken down from its recent consolidation zone, closing below the critical 21 EMA on the daily chart. This move, combined with reversal signals on both the weekly and daily timeframes, suggests that downward pressure is intensifying.
In this video, I’ll walk you through:
• The candlestick patterns signaling reversal
• The significance of the 21 EMA breach
• Confirmed divergences from key indicators
• What this means for short-term and long-term price action
Whether you're holding Bitcoin or trading around it, this is a pivotal moment. The charts are speaking—are you listening?

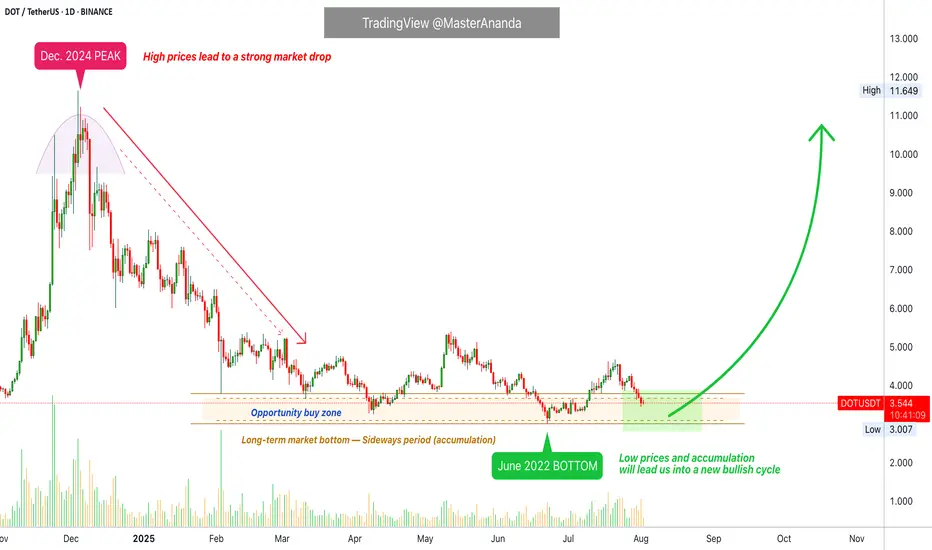
Polkadot · Trading at Bottom Prices · Bullish Scenario ExplainedThe same levels, the same prices, the same support zone. Polkadot is still trading at bottom prices. From the bottom the market tends to grow.
Good morning my fellow Cryptocurrency trader, I hope you are having a wonderful day. Notice the brown lines on the chart. We have the 7-April low, the June 22 low and also the low in March and yesterday, 1 August. This is a bottom range and this is the buy zone.
Polkadot (DOTUSDT) has been trading near this range since February 2025, six months ago. This is a very long—and strong—consolidation period. This much accumulation is surely the preparation for a major market change, a change of trend. A new uptrend. An event that has not happened since 2021.
I think the most important part is to truly understand that a bullish wave develops only from low prices. Notice the peak from December 2024. As soon as prices are high, the market seeks balance and starts to decline. But, when prices are low, an accumulation period develops and afterward a wave of growth. That is what I see happening right now across the market and with this chart. It already happened to hundreds of projects, literally. They all had the same chart.
These projects grew in late 2024, November-December. Then they went into correction in early 2025 until recently. The current low as witnessed on DOTUSDT led to massive growth. Some of these pairs are trading at new all-time highs while others have grown 500% or more. Those trading at the bottom are still early and next in line to move when the market does.
We will be bullish within days, as soon as Bitcoin ends its retrace. I shared in another publication why I believe Bitcoin will recover in the coming days.
Thank you for reading.
Namaste.
ETHUSD The Week Ahead Key Support and Resistance Levels
Resistance Level 1: 3677
Resistance Level 2: 3752
Resistance Level 3: 3833
Support Level 1: 3485
Support Level 2: 3400
Support Level 3: 3316
This communication is for informational purposes only and should not be viewed as any form of recommendation as to a particular course of action or as investment advice. It is not intended as an offer or solicitation for the purchase or sale of any financial instrument or as an official confirmation of any transaction. Opinions, estimates and assumptions expressed herein are made as of the date of this communication and are subject to change without notice. This communication has been prepared based upon information, including market prices, data and other information, believed to be reliable; however, Trade Nation does not warrant its completeness or accuracy. All market prices and market data contained in or attached to this communication are indicative and subject to change without notice.

BTCUSD The Week Ahead Key Support and Resistance Levels
Resistance Level 1: 119,000
Resistance Level 2: 121,030
Resistance Level 3: 122,862
Support Level 1: 111,683
Support Level 2: 110,450
Support Level 3: 108,720
This communication is for informational purposes only and should not be viewed as any form of recommendation as to a particular course of action or as investment advice. It is not intended as an offer or solicitation for the purchase or sale of any financial instrument or as an official confirmation of any transaction. Opinions, estimates and assumptions expressed herein are made as of the date of this communication and are subject to change without notice. This communication has been prepared based upon information, including market prices, data and other information, believed to be reliable; however, Trade Nation does not warrant its completeness or accuracy. All market prices and market data contained in or attached to this communication are indicative and subject to change without notice.

BTCUSDT 1D – Retesting Key Support, Will Bulls Hold the Line?Bitcoin is retesting a crucial structural support level around $112K after its recent local top near $120K. This zone previously acted as resistance and is now being tested as support — a textbook bullish continuation signal if it holds.
Historically, these flips (from resistance to support) have triggered strong upside momentum, as seen after the $78K breakout earlier this cycle. However, failure to hold this level could open the door for a deeper correction toward $100K or even the $90K region.
This chart outlines the major structural zones:
Long-term accumulation base near $70–78K
Resistance flip zone at $110–112K
Local resistance near $120K
📌 If bulls defend this zone and reclaim momentum, we could see another push toward cycle highs. If not, patience is key — the next high-conviction entry may come lower.
How are you positioning around this zone? Let me know in the comments 👇

Silver The Week AheadKey Support and Resistance Levels
Resistance Level 1: 3756
Resistance Level 2: 3855
Resistance Level 3: 3915
Support Level 1: 3600
Support Level 2: 3544
Support Level 3: 3480
This communication is for informational purposes only and should not be viewed as any form of recommendation as to a particular course of action or as investment advice. It is not intended as an offer or solicitation for the purchase or sale of any financial instrument or as an official confirmation of any transaction. Opinions, estimates and assumptions expressed herein are made as of the date of this communication and are subject to change without notice. This communication has been prepared based upon information, including market prices, data and other information, believed to be reliable; however, Trade Nation does not warrant its completeness or accuracy. All market prices and market data contained in or attached to this communication are indicative and subject to change without notice.

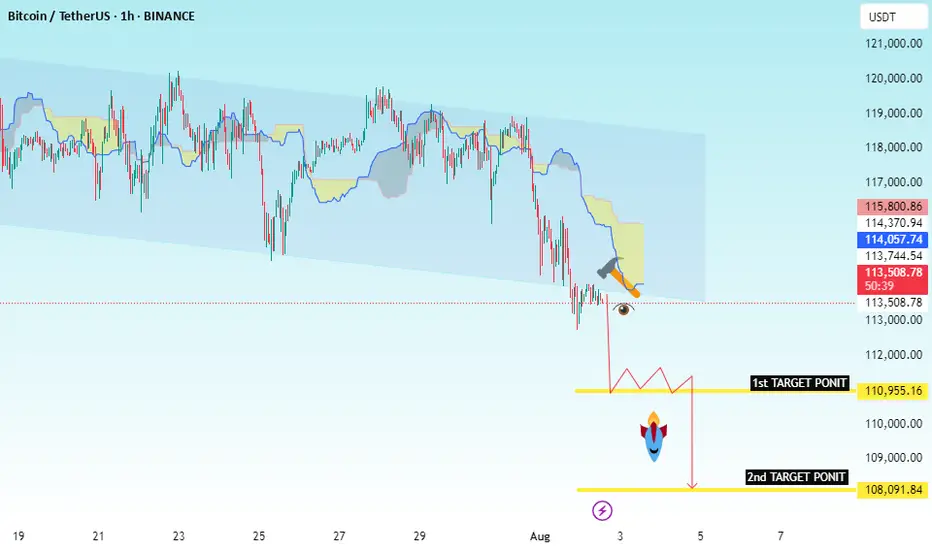
BTC/USDT Bearish Continuation SetupChart Identification:
Timeframe: Likely 1H or 4H
Pair: BTC/USDT
Indicators: Ichimoku Cloud
Pattern: Price broke down from cloud resistance and is retesting previous support
Setup: Bearish continuation with consolidation before next leg down
---
✅ Trade Setup (Sell):
🔹 Entry Point:
Sell Entry: Below 113,500.84
This level marks the neckline of a small consolidation zone.
Wait for clean candle close below this level.
---
🎯 Target Levels (Take Profit):
1. TP1: 110,955.16
Previous minor support
2. TP2: 108,091.84
Key support/demand area
---
🧠 Optional Confirmation:
You can wait for:
Bearish candlestick pattern at 112.1K zone
Rejection of retest near 113.7K–114.3K (top of cloud)
---
📌 Summary:
> BTC/USDT Short Setup
🟢 Entry: Below 113,500.84
🎯 Target 1: 110,955.16
🎯 Target 2: 108,091.84
Bearish bias as price remains below the Ichimoku cloud and shows signs of continuation.
GBPUSD : NEW WEEK TECHNICAL BIAS (MARKET OPEN)CONTEXT
(Strictly Technical Outlook – No Fundamental Overlays)
▪︎ Higher Timeframe (HTF) Price Action from the previous week signals a potential pullback or reversal, as last month closed with a strong bearish momentum candle.
▪︎ However, the broader bullish structure remains intact — current Descend Sequence is interpreted as a corrective leg into discounted territory.
▪︎ I anticipate price to trade lower into the Monthly Price Inefficiency Zone (M-PIZ) and further toward the discount zone of the prevailing price leg.
▪︎ A rally toward the 1.33502 – 1.34014 region would offer a high-probability zone for short setups. A sweep or reclaim of 1.31739 may precede this rally.
▪︎ The premium OCZ appears unlikely to be reached — unless employed as a Trap.
▪︎ Downside targets include:
i. Monthly PIZ
ii. 1.29442 and potentially levels below
Invalidation:
Bearish setup will be invalidated if price trades above 1.36942 with microstructure confirming an Ascend Sequence continuation.
Note: Bias is developed strictly from chart structure using IntelEdge Technical Protocol – no fundamental overlays included.
📌 Disclaimer: is a strategic directional bias, not financial advice. Execute only with confirmation and proper risk management.

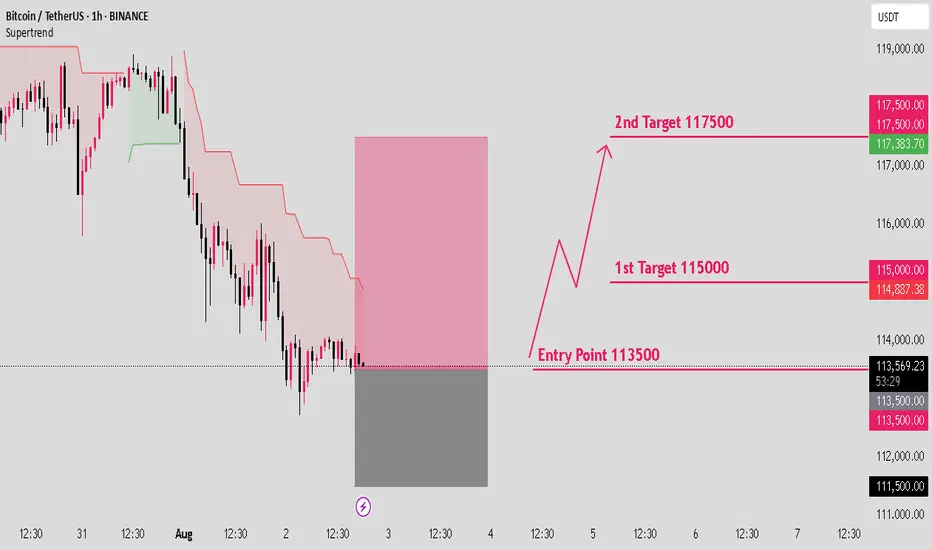
BTCUSD long setup: Targeting the next bull move.Hello IGT FOLLOWERS
Here is my BTCUSD overview, Bitcoin is showing bullish momentum after holding strong support near $112,000. A breakout above the $115000 resistance suggests buyers are regaining control. RSI is turning upward, and volume is increasing on green candles signaling demand. As long as price holds above $113,000, bulls may push toward the $117,500 target.
Key points :
Entry point : 113500
1st Target : 115000
2nd Target : 117500
Follow me for more latest updates and signals
is BTC dead again ?I was really bullish until wave 4 didnt really bounce between the 38 and 50
suddenly very bearish

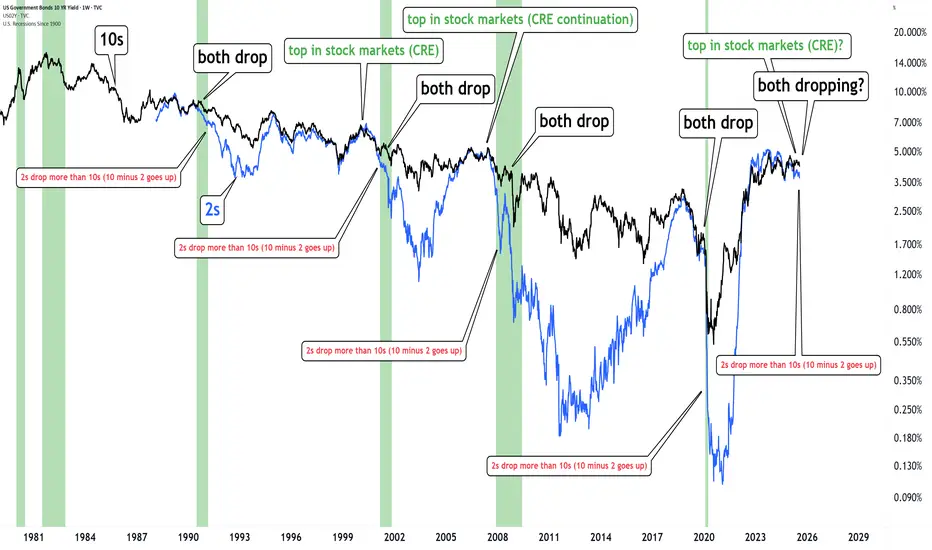
The bond market is warning us.When both 2s & 10s drop together and the yield curve steepens (10–2 rises)... It’s historically followed by important market turmoil
Happened in 2000, 2008 and 2020.
It's possibly happening again.
The bond market is warning us.
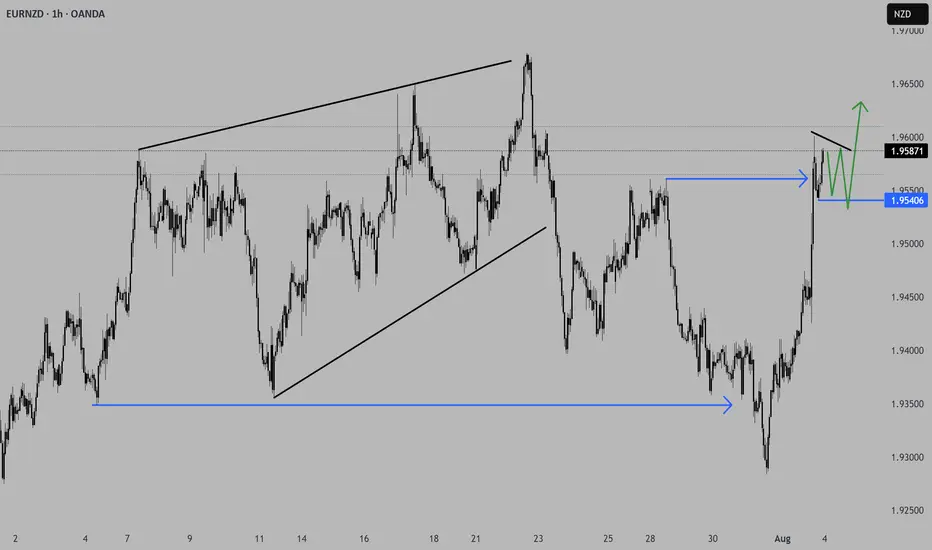
EURNZD shows signs for a continuation long.Price did finish the initial selloff into the start of the HTF 3-touch structure with a 1-2-3 move and started to aggressively reverse. We saw price turning bullish again and is now trading through an AoI and starting to form a consolidation. Price left a small Liq.P, which could act as a base, and if we see price stalling in this area and forming some kind of bull flag, that would be deliberate PA for a continuation to the upside, with the previous high as initial target.
*** **** *****
The pairs I publish here are usually discussed in detail in my Weekly Forex Forecast (WFF) and are now showing further developments worth mentioning.
Remember, technical analysis is subjective; develop your own approach. I use this format primarily to hold myself accountable and to share my personal market views.
⚠ Ensure you have your own risk management in place and always stick to your trading plan.
*** **** *****
JUVUSDT Forming Bullish MomentumJUVUSDT is showing signs of a strong recovery from its recent consolidation phase, with a clear bullish momentum starting to emerge. The price action has bounced confidently from a well-defined support zone, highlighted in the chart, and buyers have stepped in aggressively. This indicates strong market interest and could be the early stage of a new upward trend. The expected upside potential ranges from 30% to 40%+, supported by increasing volume and favorable sentiment.
The token is now trading just above a key breakout zone, which has historically acted as resistance but is now turning into strong support. This shift in market structure is often a signal of a bullish reversal. Given the recent breakout attempt and minor pullback for retesting, the chart suggests JUVUSDT may be gearing up for a significant push toward the next resistance level. Technical indicators such as RSI and MACD also hint at further bullish continuation if current levels hold.
Investor interest in JUV is steadily growing, with fundamentals and market sentiment aligning to support a short-to-mid-term rally. The project’s presence in the fan token sector, along with improving volume trends on major exchanges like Binance, reflects increasing confidence among traders and crypto investors.
Traders keeping a close eye on potential breakout setups should not overlook JUVUSDT. The current technical setup offers a promising opportunity with a favorable risk-reward ratio, especially if the bullish momentum accelerates from here.
✅ Show your support by hitting the like button and
✅ Leaving a comment below! (What is You opinion about this Coin)
Your feedback and engagement keep me inspired to share more insightful market analysis with you!

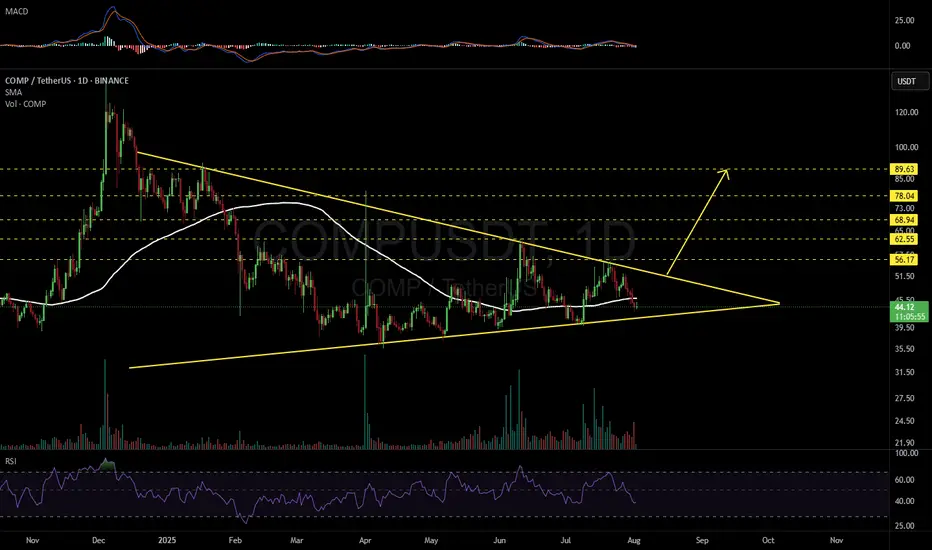
COMPUSDT 1DMany of you have been asking about #COMP.
It needs to hold the triangle’s support line and ideally reach above the daily SMA100 as soon as possible — only then can we expect a potential bullish move.
In any case, if a breakout occurs above the triangle resistance, the upside targets are:
🎯 $56.17
🎯 $62.55
🎯 $68.94
🎯 $78.04
🎯 $89.63
⚠️ As always, use a tight stop-loss and apply proper risk management.
ETH VS AI?Hi
Asked AI on the next movement ETH
Predicted Target = 4 847
Time Projection 20 days → 15 Aug 2025
Probability (%) Attenuation × 100 = 183.6 %
Variance vs. Today (Target) 4 847 − 3 507 = 1 340
Projected Retracement Price 3 886 − 599 = 3 287
Variance vs. Today (Retrace) 3 287 − 3 507 = −220
All the best
Caveat emptor
Not a guru

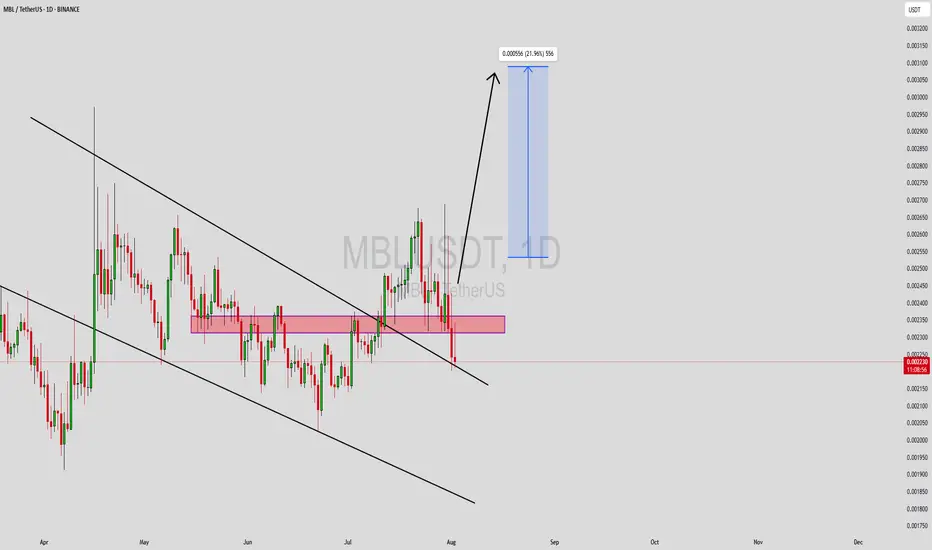
MBLUSDT Forming Bullish ReversalMBLUSDT is currently exhibiting signs of a bullish reversal pattern, indicating a potential trend shift in favor of the bulls. After an extended downtrend, the price appears to have found strong support, which is now serving as a base for upward momentum. This structure is often seen before a breakout rally, especially when paired with a steady increase in trading volume—suggesting accumulation by informed investors.
The recent price action confirms growing investor confidence in the MBL project. With volume picking up and a bullish reversal structure forming on the chart, traders are beginning to position for an anticipated move to the upside. Technical indicators support this sentiment, aligning with a potential gain of 20% to 30%+ in the short term if the current momentum is sustained.
As broader market sentiment continues to recover, MBLUSDT stands out with a clean technical pattern that offers a favorable risk-to-reward ratio. The combination of healthy volume, a well-defined support zone, and early signs of bullish continuation make this setup appealing to both swing traders and mid-term holders watching for breakout confirmation.
MBL’s fundamentals are also garnering interest, adding to the technical strength seen on the chart. If buyers continue stepping in near support levels, the breakout target could be reached faster than expected.
✅ Show your support by hitting the like button and
✅ Leaving a comment below! (What is You opinion about this Coin)
Your feedback and engagement keep me inspired to share more insightful market analysis with you!
Gold ready to create new all time high!!!Buy: $3447.28
Set up: wait for a breakout and hidden bullish divergence on a weekly basis.
Sl: $3183.11
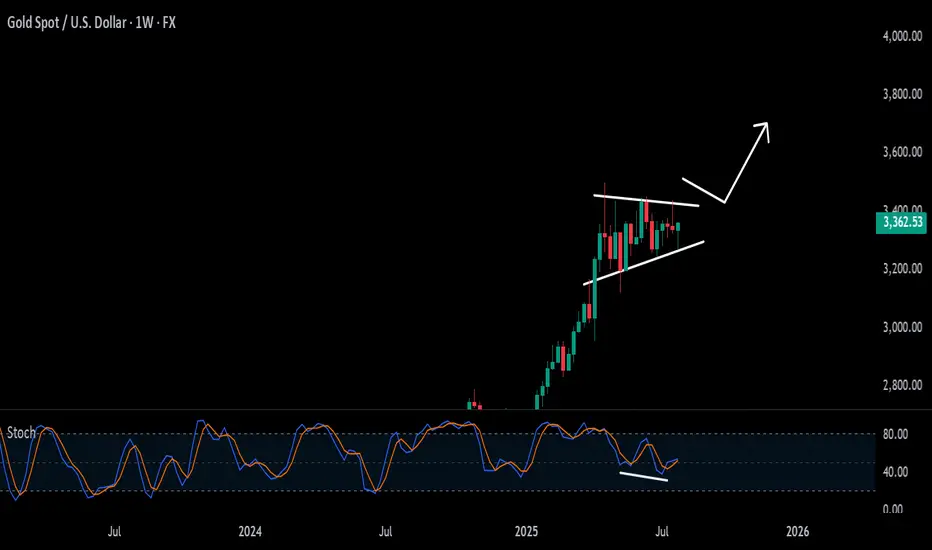
Weekly Hammer Ignites Gold’s Breakout PotentialGold has been quietly consolidating for the past three months, forming a classic accumulation zone. Now, a powerful weekly hammer candlestick has emerged—hinting at a potential breakout.
In this video, I break down the technical setup:
• The structure of the accumulation range
• The significance of the weekly hammer
• Key indicators hovering near breakout confirmation
• Price levels to watch for validation or rejection
While the breakout isn’t confirmed yet, momentum is building. If you're tracking commodities or trading gold, this is a moment to pay attention. The next move could be decisive.

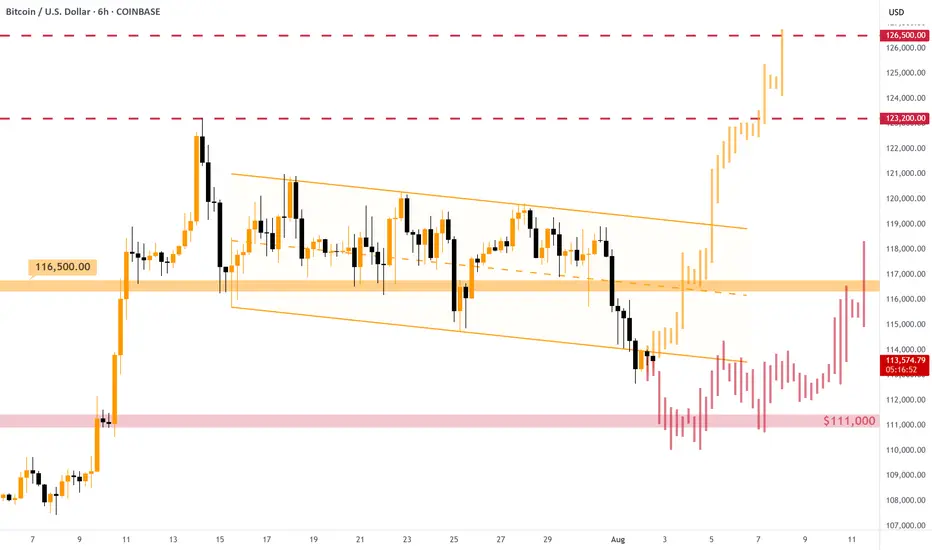
#BITCOIN - Short-Term Options [EXPLAINED]As expected, the price dumped below the descending channel , currently consolidating right below one's support level.
As expected, the price dumped below the descending channel , currently consolidating right below one's support level. On the chart I've described two possible options for the price movement: strictly positive and hmm.. okey.
Strictly positive: some consolidation below the support with, then quick retrace back inside the channel and new upward rally on the next working week. Entering LONG position will make sense after the breakout of the $116,500 resistance, not earlier.
Hmm.. okey: Bitcoin is not strong enough to come back inside the channel and dumps to $111,000 support level. Near this level we must see some consolidation to gather more power. Possible fakes down to $108,000. In some time (1 week+) we will have chances of going back up.
👉 Overall, the support of $111,000 is crucial right now. If we lose it, Bitcoin goes towards $100,000 and the current bullish phase might be considered as finished. For now we still have chances.