TONUSDT Bullish Structure Continuation – Minor Pullback Leg Up🧾 1. Overview of the Chart Setup:
The current TONUSDT (Toncoin/USDT) 2-hour chart exhibits a strong bullish market structure, characterized by a clear sequence of higher highs and higher lows. This confirms bullish momentum and suggests that the market is in a well-established uptrend.
The key highlight here is the "Blue Ray – Trend Continuation Pattern", which signals sustained bullish pressure following a clean breakout. This breakout was preceded by a consolidation phase, indicating accumulation by smart money before the expansion move.
🔍 2. Technical Structure and Pattern Breakdown:
🔵 Blue Ray – Trend Continuation Pattern:
This diagonal support trendline captured the initial breakout after the market bottomed near July 29–30.
Price respected this ascending line multiple times before accelerating, confirming bullish control.
Once the price broke above the previous swing high, it completed the pattern and triggered a momentum-driven rally.
🔲 Structural Zones – Major and Minor:
Minor Support Zone (~3.50 USDT):
Currently acting as short-term demand.
Price is showing early signs of rejection here, suggesting bulls may reload for a second impulsive move.
If this zone holds, we expect a new higher high to form, potentially targeting 3.80–4.00+ USDT.
Major Support Zone (~3.20–3.25 USDT):
Acts as long-term bullish defense.
In case of deeper retracement or shakeout, this is the key level to watch for possible trend continuation and re-entry.
📈 3. Structural Analysis and Price Projection:
The projected path on the chart shows a classic price action structure:
Impulse
Correction (toward minor support)
Next Impulse (break of recent high)
Higher low (continuation within trend channel)
Potential final push toward the 3.90–4.00 range
This type of Elliott Wave-inspired behavior suggests we're in wave 3 or 5 of a bullish sequence, with minor dips offering low-risk long setups.
📊 4. Candlestick & Market Behavior:
Recent candles show long lower wicks, suggesting buyers are stepping in during dips.
Bearish candles are relatively smaller and followed by immediate bullish response.
This indicates buy-the-dip sentiment, common in a trending market.
🔄 5. Trading Plan & Scenarios:
✅ Bullish Continuation (Base Case):
Wait for a clear bullish engulfing or price bounce at the minor support zone (~3.50 USDT).
Enter with confirmation: bullish candle close, volume spike, or trendline reaction.
Targets:
TP1: 3.80 USDT
TP2: 4.00–4.10 USDT
Stop Loss: Below 3.45 (or structure-based trailing stop)
⚠️ Bearish Case / Deeper Pullback:
If 3.50 fails, look for signs of accumulation around the major support (~3.20–3.25).
This zone can serve as the ultimate defense for trend continuation and provide a second long opportunity with better R:R.
🧠 6. Mindset for Traders:
Don’t chase: Let price come to your level, and focus on confirmation.
Trade with the trend: Structure supports bullish movement — trade in the direction of strength.
Use proper risk management: Define SL and TP before entering. Partial profits at key resistance zones are a smart strategy.
Avoid overtrading : Wait for structural retests or confirmation candles to stay on the right side of the market.
Chart Patterns

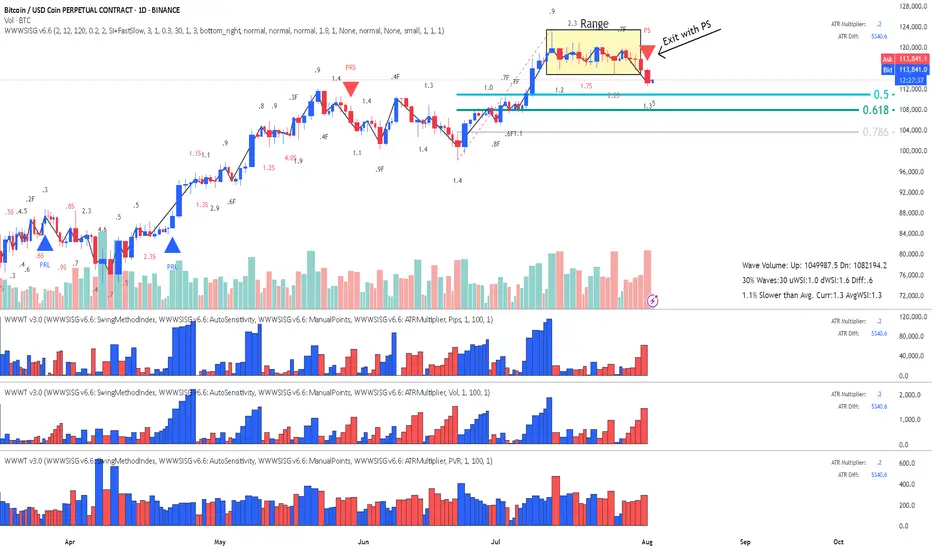
BitCoin - Is it heading for the Fib?This is a classic Entry Short for Weis Wave with Speed Index owners called " Exit from Range with a Plutus Signal" and in this case it was a PS. It looks that it's heading for the Fib, I will wait for some pullback on 1HR to confirm with Speed Index and the waves, as well as getting a better RR.
I
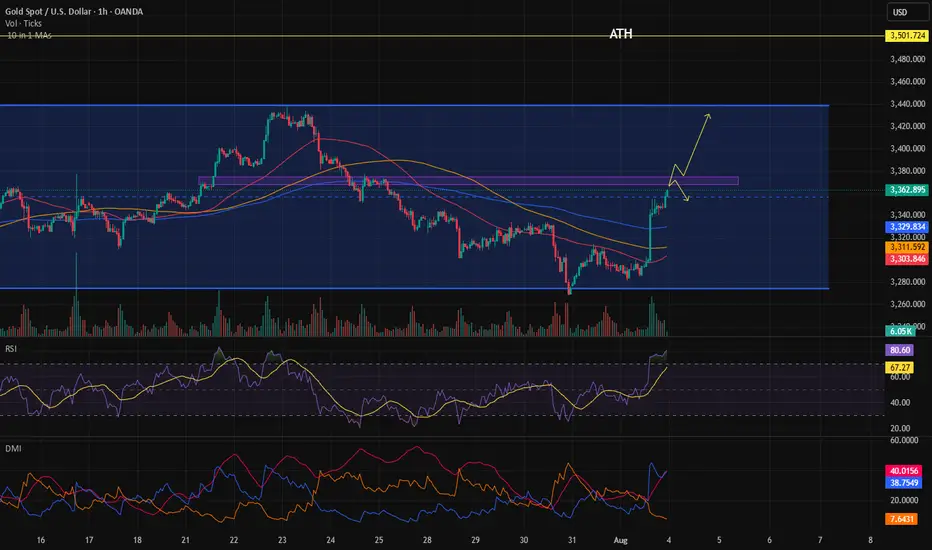
Trend continuation or reversal?Gold bounced strongly from the bottom of the higher time frame channel, and we should also consider that this bounce was triggered by news that was negative for the dollar on Friday. Now we need to wait and see whether this move is truly strong or if it's going to turn out to be a fake and head back down toward the bottom of the channel.
S&P500 corrective pullback key support at 6200Key Support and Resistance Levels
Resistance Level 1: 6316
Resistance Level 2: 6374
Resistance Level 3: 6430
Support Level 1: 6200
Support Level 2: 6112
Support Level 3: 6073
This communication is for informational purposes only and should not be viewed as any form of recommendation as to a particular course of action or as investment advice. It is not intended as an offer or solicitation for the purchase or sale of any financial instrument or as an official confirmation of any transaction. Opinions, estimates and assumptions expressed herein are made as of the date of this communication and are subject to change without notice. This communication has been prepared based upon information, including market prices, data and other information, believed to be reliable; however, Trade Nation does not warrant its completeness or accuracy. All market prices and market data contained in or attached to this communication are indicative and subject to change without notice.

Dollar Index in Danger: Patterns Point to More DownsideThe dollar index (DXY) is flashing serious warning signs. In this video, I break down the technical evidence behind my bearish outlook on both the monthly and daily charts. The head and shoulders pattern we spotted did work it's way to breaking the neckline BUT the target will Not be achieved as the data on the charts have changed. On the daily charts we have a strong bearish engulfing candle, there is also an RSI divergence in the overbought zone, stochastic indicator has turn down and momentum is also following along. The downtrend on the monthly timeframe has not formed any divergence yet so I expect price to fall below the previous month's low in the coming weeks.
There will be bounces from support zones on the daily and 4 hours, these will be opportunities for good entries.
If you’re holding USD or trading around it, this is a must-watch. The signals are clear—are you prepared?
Cheers and I wish everyone a profitable trade in the coming week.

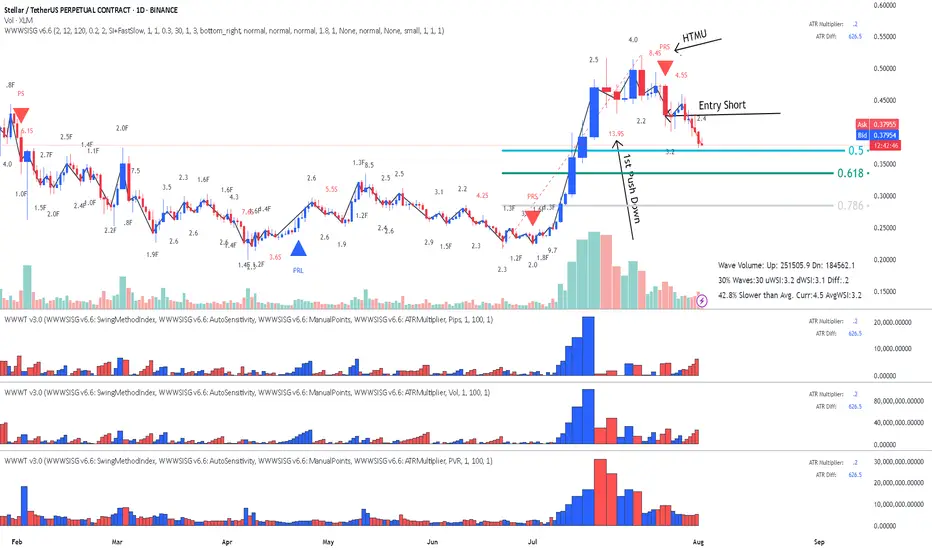
XLM Stellar - Previous video continuation, as forecasted.Not much to say. Just watch the forecast on previous video a few days back. Close to Fib now - no entries.
Video:
Enjoy!
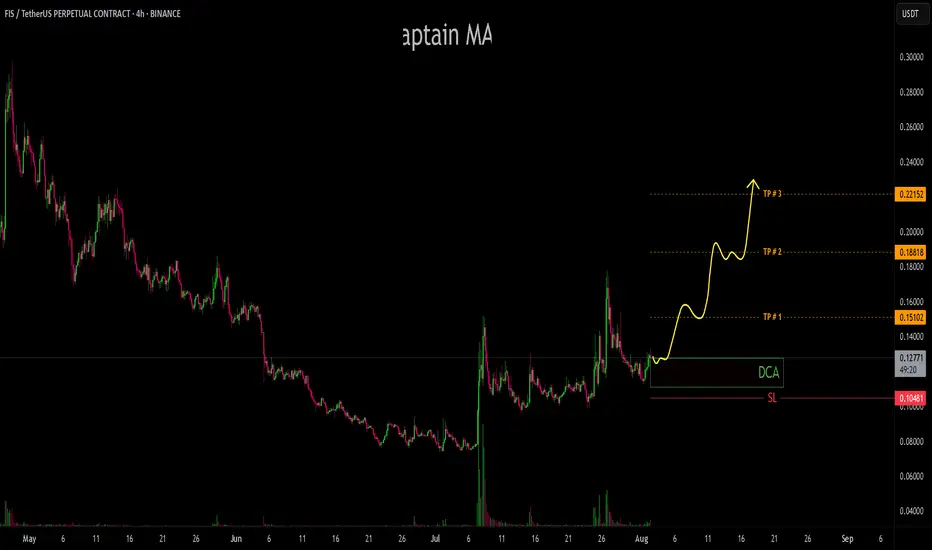
FIS/USDTFIS has shown an aggressive push from buyers, confirming strong demand as the price consistently defends the $0.10–$0.11 zone as solid support. This accumulation range has held firm despite market volatility, indicating a possible base formation. signaling momentum building for a breakout.
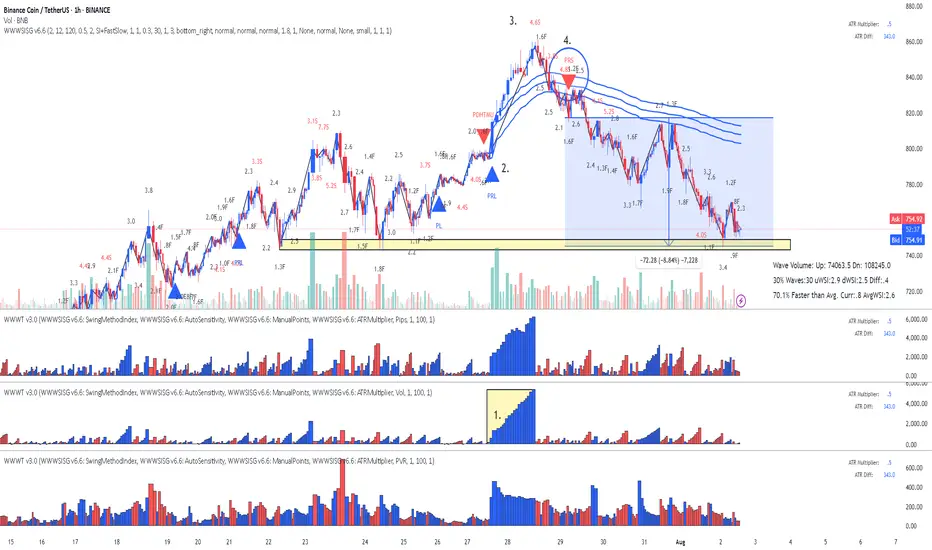
BNB Binance Coin: Lesson 15 methodology did the job again
Lesson 15 methodology (annotations in sync with the chart):
1. Largest up volume wave after a while - sellers might be in there.
2. Placed AVWAP and waited for price to cross downwards and pullback again on AVWAP
3. HTMU (hard to move up) - Abnormal Speed Index 4.6S at the top
4. Entry short signal PRS with abnormal SI 4.8.2 (price has a hard time to move up - absorption)
Simple as that. Enjoy!
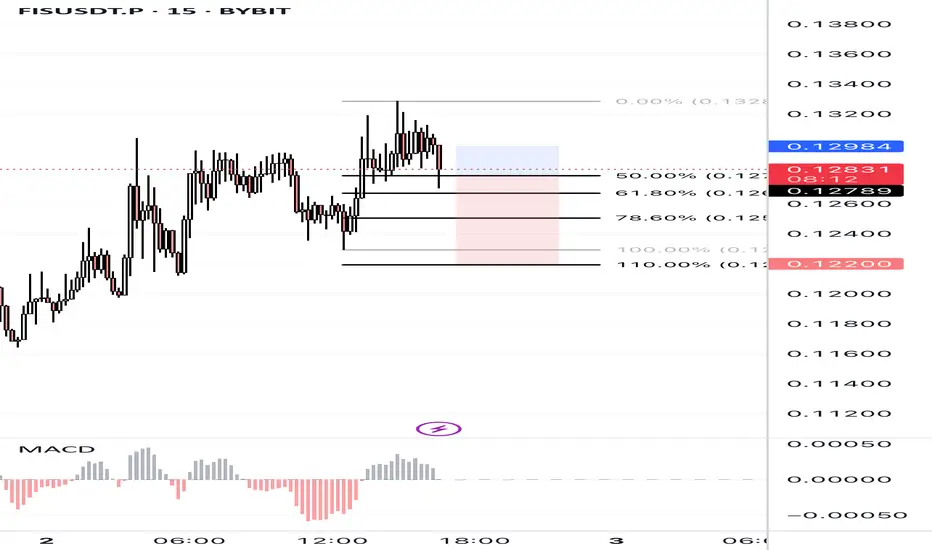
FISUSDT.P 15m – Bearish Rejection at Fib Zone | Short SetupPrice faced strong rejection at the 0.13280 high, forming a double top and now pulling back. Current move aligns with Fibonacci retracement zones, with price reacting near the 50–61.8% zone. MACD histogram is weakening, signaling bearish momentum.
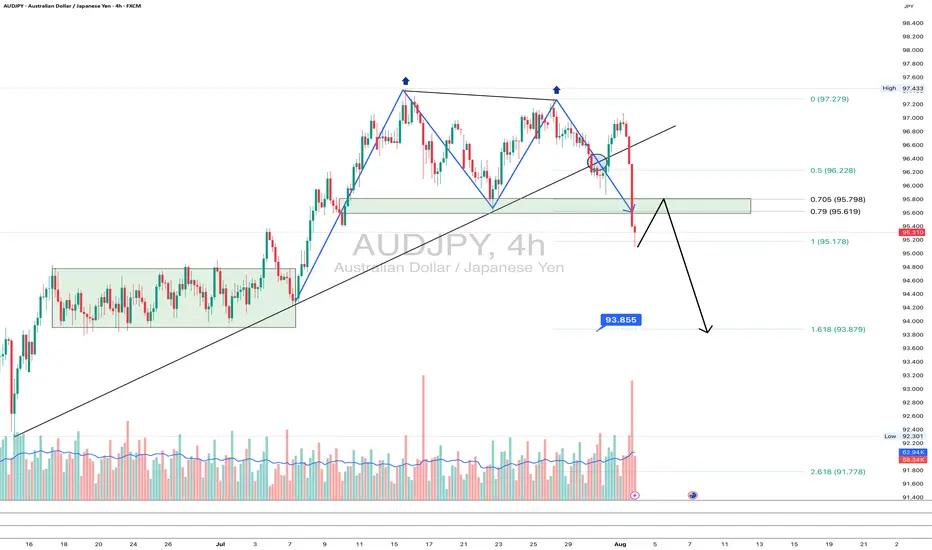
AUDJPY: goodbye uptrend?On the 4H chart, AUDJPY has printed a textbook double top pattern, breaking the rising trendline and diving below the 95.6–95.78 support zone - now acting as resistance. The pair is currently retesting this zone from below, which often provides a clean re-entry point for bears.
This area also aligns with the 0.705–0.79 Fibonacci retracement, reinforcing it as a key resistance. If the price rejects this zone, the next target is 93.85 (1.618 Fibo projection), followed by 93.25 and potentially 91.71 if momentum strengthens.
Fundamentally, the yen gains strength on risk-off flows and diverging rate expectations, while the Australian dollar is pressured by falling commodity prices and a likely pause from the RBA. This widens the rate differential and weakens AUD.
As long as price remains below 95.78, sellers are in control. Watch for a rejection from this retest zone.
GOLD: NEW WEEK TECHNICAL BIAS (MARKET OPEN)CONTEXT
▪︎ HTFs Bias: Bullish stance remains intact until a valid structural breach occurs.
▪︎ Monthly Context: Despite consistent upper wick rejections, price continues to close above prior monthly opens — suggesting bullish resilience.
▪︎ Weekly View: Current price action reflects a Value Compression Phase (VCP) within the premium zone of the active range, implying potential buildup for a bullish Impulse Drive.
▪︎ Daily Alignment: Daily price behavior mirrors the Weekly context, supporting a continuation thesis.
Preferred Scenario: Leaning towards a Retrace Precision Entry (RPE) before the Ascend Sequence resumes. Watching:
• Point A (shallow pullback) near B/C level, or
• Point B (deep pullback) into the pending Rejection Zone (ARB).
Invalidation Trigger: A structural breach below 3336, backed by bearish momentum and microstructure shift, targets first 3280, then levels below.
Uncertainty Variable: Will price first sweep 3433.2 before retracing? Or will it retrace from market open? This remains unclear and demands a patient, reactive stance.
📌 Disclaimer: This is a strategic directional bias, not financial advice. Execute only with confirmation and proper risk management.

BITCOIN - Price can turn around and start to move upHi guys, this is my overview for BTCUSD, feel free to check it and write your feedback in comments👊
The price reversed its prior downtrend with a decisive breakout from a falling channel.
This breakout triggered a strong upward impulse, which then began to consolidate into a large symmetrical pennant.
However, the price recently failed to hold the lower support trendline of this pennant and broke to the downside.
The asset is currently trading just below this broken trendline, in what appears to be a liquidity grab.
To continue upwards, buyers must now overcome the immediate resistance located at the $116300 level.
I expect that this breakdown was a fakeout, and the price will soon reverse, break through the $116300 resistance, and continue its rally toward the $121000 target.

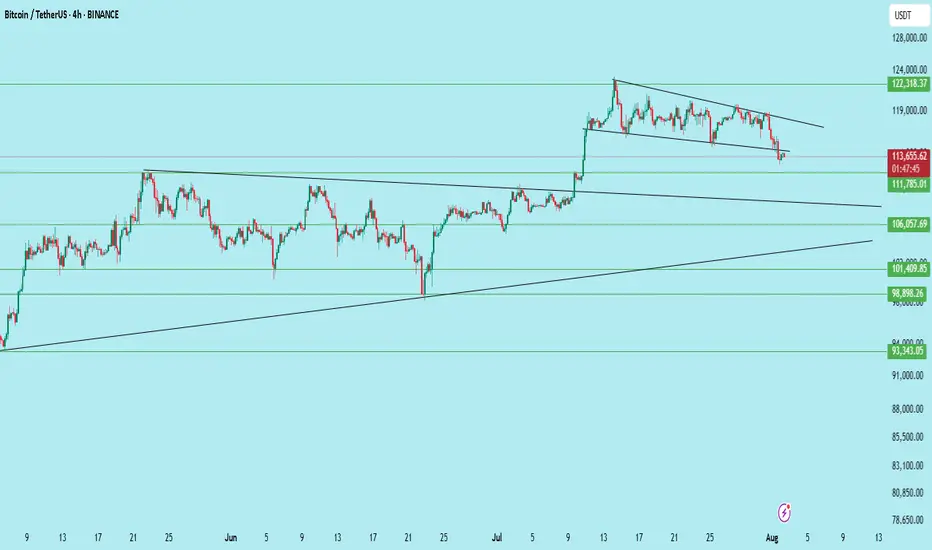
$BTC /USDT – Breakdown from Channel, Bears Gaining ControlBitcoin has broken down from its descending channel on the 4H chart after repeated rejection from the upper trendline. Price is now hovering near key support at $111,785.
Key Technicals:
Rejection from the descending trendline resistance
Breakdown of the mini-channel structure
Current price: $113,637
Support levels:
$111,785 (Immediate)
$106,057
$101,409
$98,398
Bearish continuation is likely if $111,785 breaks with volume
If the $111.7k zone fails to hold, BTC could see further downside toward $106k and even $98k in the coming sessions.
Invalidation: Bullish only on reclaim of $117K+ with strength.
DYOR | Not Financial Advice
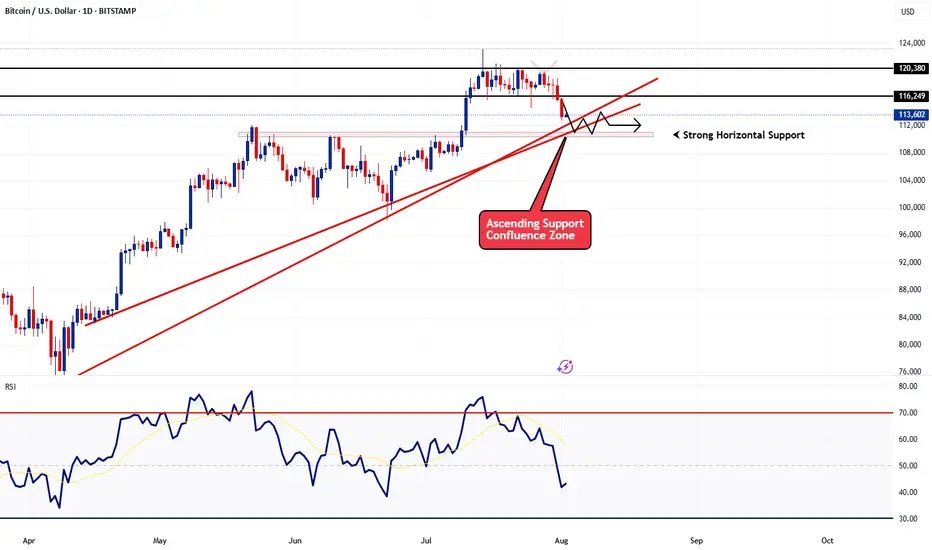
BTCUSD - Follow Up AnalysisTaking a look at the daily chart, price action did come down as previously expected in my last article.
Now we're heading into an area of strong support and I expect to see some sideways action until something significant happens next.
How I'm trading this price action?
I believe price action may continue to bounce around from the current price of 113,600 down to 110,000 for at least the next few days. With that said I'm implementing my range trading strategy. The range trading strategy also known as the Bitcoin Scalper scalps on the 1 and 5min timeframe creating sort of like a grid style approach but it's based on candlestick momentum. Since it trades off momentum, it's able to detect breakouts and know when to switch from the ranging strategy to the breakout strategy.
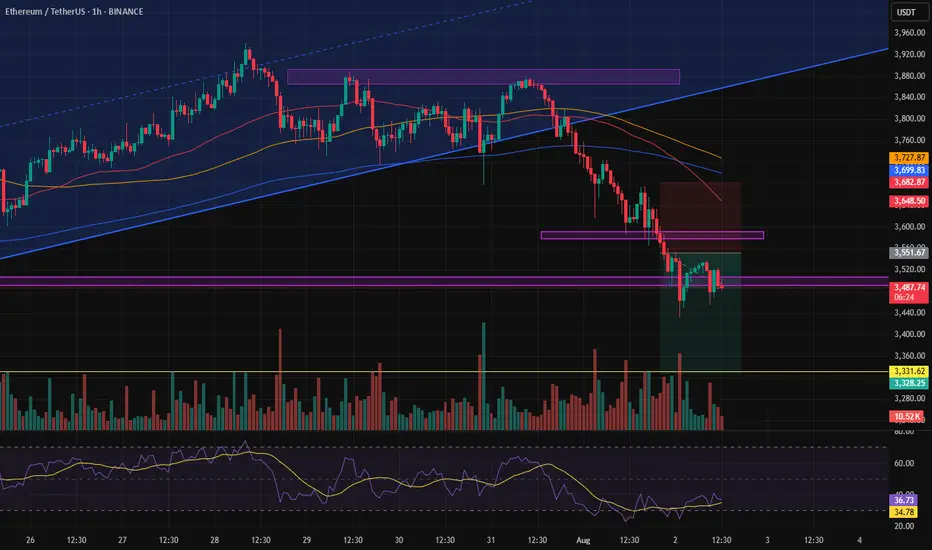
Update on the previous analysis.Our analysis hasn’t changed much since yesterday — we still believe the price will reach the $3,330 zone unless buying volume increases significantly and this area turns out to be a fakeout.
Gold Futures Super Strong Resistance - Price Coming Back StrongGold Future has been very strongly pushing up without filling any gapes in the short side before pushing up more further.
One unique line is probably the target super strong resistance.
In a daily chart, probably better wait until it reaches that point to try to check for strong short entries maybe.
Still arriving there it would explode up even more further to transform that line into a super strong probable support.
Keep watching!
(Do we actually have to believe that gold is secretly targeting $10,000) in the Yearly Chart?... Since February 2022 it just went berserk!)

ALCH / Usdt BINANCE:ALCHUSDT.P
### ALCH / TetherUS Perpetual Contract (1h) - Binance
- **Price**: 0.16361 (-0.44%, -0.00073)
- **High/Low**: 0.16458 / 0.16310
- **Buy/Sell**: 0.16356 (BUY) / 0.16353 (SELL)
- **Levels**: Support at 0.16029, Resistance at 0.17000
- **CVD (1D)**: Mixed volume (1.17M to 1.53M)
- **OI (Open Interest)**: ~407M (stable)
- **Volume (ALCH)**: 1.2M
- **Sentiment (Trendmaster)**: Neutral (51.79M)
**Summary**: Slight bearish movement, low volatility, neutral sentiment. Watch key levels (0.16029 support, 0.17000 resistance).
Disclaimer : Not Financial Advice

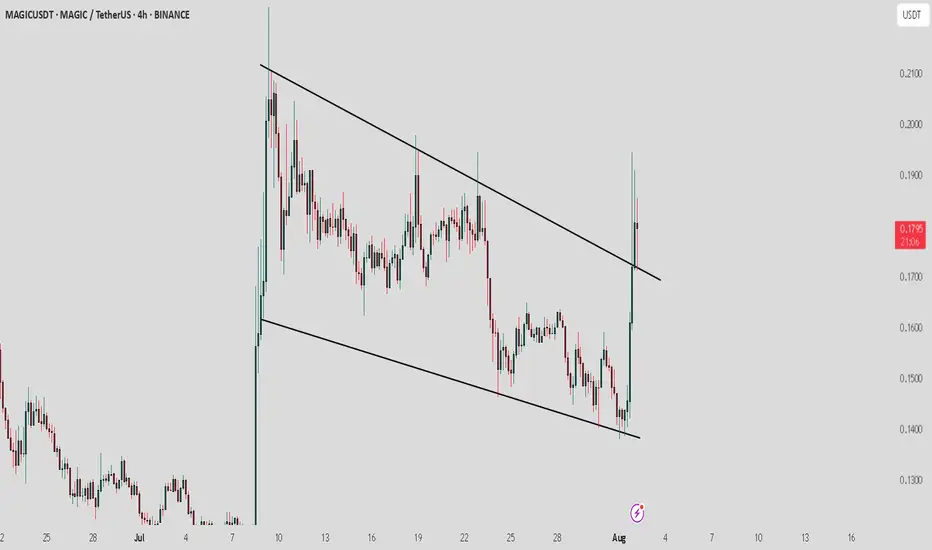
MAGIC/ USDT: Retest is in progress, keep a watch on confirmationMAGIC / USDT has broken out from the Trendline resistance and retest is still in progress . However, the market conditions are not ideal right now.
Bullish scenario : If the price holds above the breakout level and the retest is confirmed, the next target could be 0.19–0.21.
Bearish scenario : A failure to maintain above the breakout level may lead to a drop back to 0.15 or 0.13.
Pro Tip: Use tight stop-losses below the breakout point. Wait for confirmation before committing larger positions. Keep an eye on BTC dominance
STRONG BUY | PALLADIUM Strategy: Impulse Correction
Direction: Bullish
Moving Average: Blue above Red
Fib Retracement: 38.2 reached
MACD > 0
Support : Finding additional confluence, as the weekly bounces off a massive support structure
1st Target = 1336
2nd Target = 1419
3rd Target = 1527
Lots: 0.2 (Plan to pyramid into this one)
RISK: Tariff Wars continue to hamper global growth as supply chains feel the brunt of the disruption.
Trade 4/20

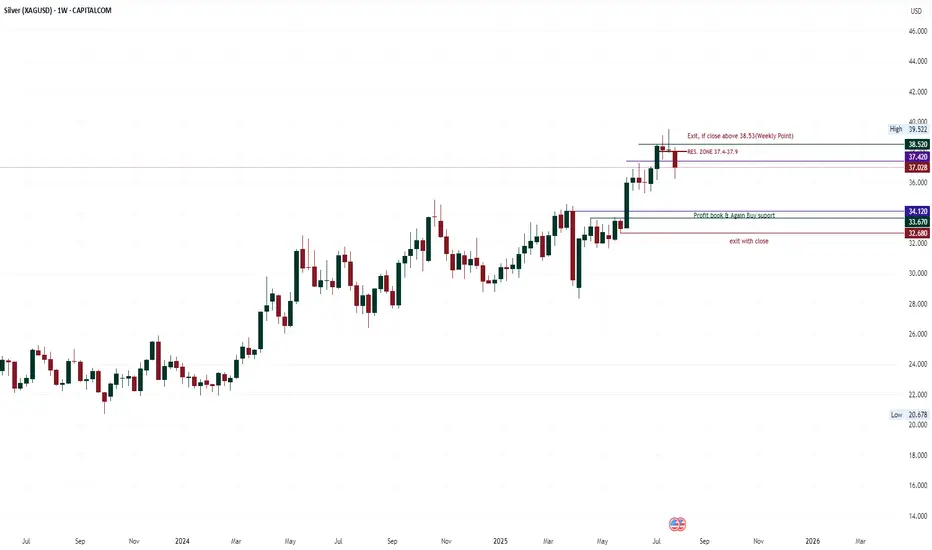
silver correction patternThere has been no close above 38.52 in the last 4 weeks, i.e. every weekend has closed below 38.52. The weekend candle of 7 July is an important candle, apart from this this week's candle has also closed below the low of 14 July, which also indicates a down sign, over all a resistance zone is shown from 37.42 to 37.95. This pattern can go down to 34.1 or 33.67. But use a strict weekend Stop loss of 38.52.
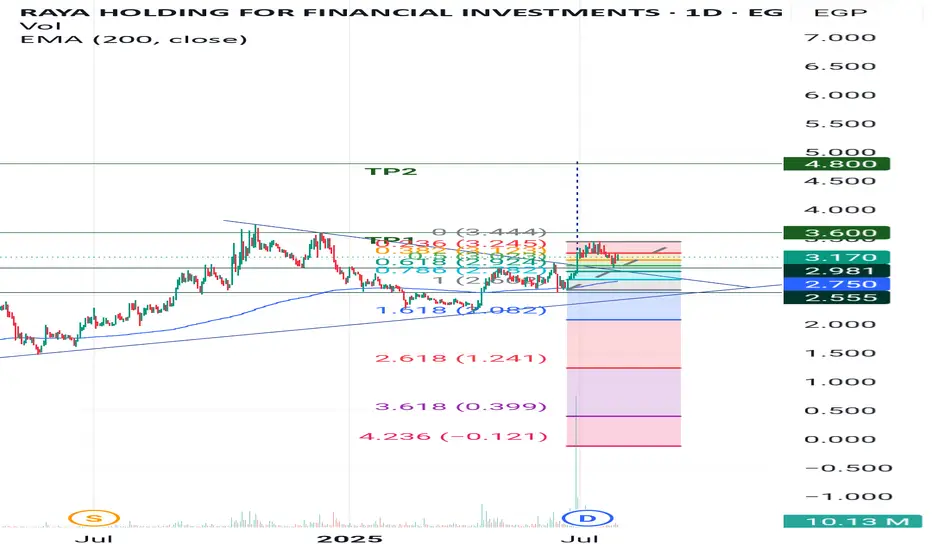
Rebound from significant support levelRAYA after breakthrough symmetric triangle pattern the stock just tested a significant support level 2.98 which considered 50% fibo retracement level, the potential targets are as follows:
- TP1: 3.6 "Short - medium term target"
- TP2: 4.8 "Long term target"
- SL: below 2.95 "current SL level"
Retracement SL is advised.
STRONG BUY | HARMONY GOLDStrategy: Impulse Correction
Direction: Bullish
Moving Average: Blue above Red
Fib Retracement: 61.80% reached
MACD > 0
1st Target = 36,000
2nd Target = 40,927
3rd Target = 47,161
Lots: Can't trade on Meta, but hold 75 of the stock.
RISK: Tariff Wars continue to hamper global growth as supply chains feel the brunt of the disruption.
Trade 3/20

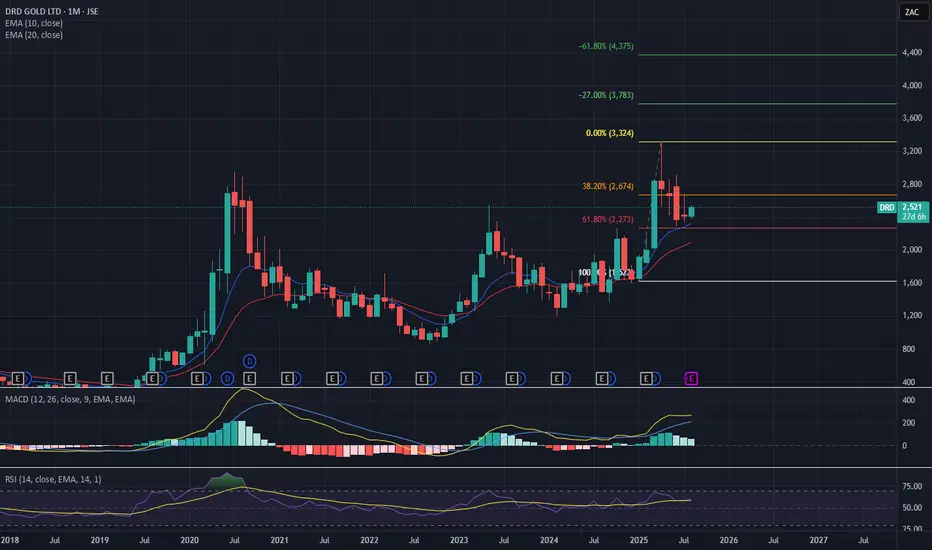
STRONG BUY | DRD Strategy: Impulse Correction
Direction: Bullish
Moving Average: Blue above Red
Fib Retracement: 38.2 reached
MACD > 0
1st Target = 3324
2nd Target = 3783
3rd Target = 4375
Lots: Can't trade on Meta, but hold 5000 of the stock.
RISK: Tariff Wars continue to hamper global growth as supply chains feel the brunt of the disruption.
Trade 2/20