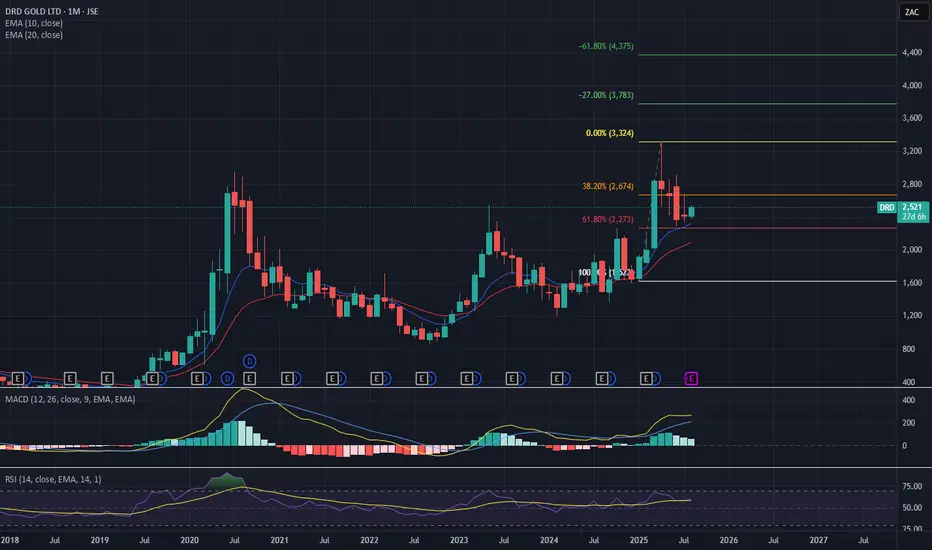
STRONG BUY | DRD Strategy: Impulse Correction
Direction: Bullish
Moving Average: Blue above Red
Fib Retracement: 38.2 reached
MACD > 0
1st Target = 3324
2nd Target = 3783
3rd Target = 4375
Lots: Can't trade on Meta, but hold 5000 of the stock.
RISK: Tariff Wars continue to hamper global growth as supply chains feel the brunt of the disruption.
Trade 2/20
Chart Patterns
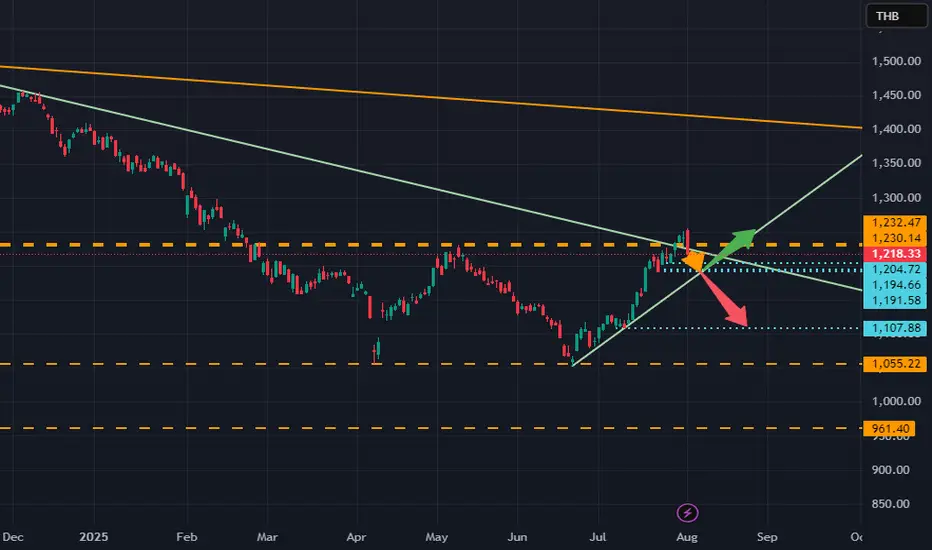
Analysis on SET INDEX: After the target hit, what comes nextDear All
Currently, SET INDEX has reached 1245- 1250 and on the first day, it can hold at this level.
However, once the tax news released, not only it fail to make new high, it fell drastically.
As a result, it can be concluded that the upward momentum is now ceased.
Also, with the big red, the set is entering the new stage.
the case is as followed,
1. most likely went down to around 1190-1200.
After which it should either
1.1 can hold at 1190-1200 and go back to retest the high 1250 once more
1.2 can not hold at 1190, it should be expected to 1110.
Best of luck
Not a trading advise.
Trader PP
Downtrend not over yet !First upside attact till $171.
Then continue about to $150.
Up for 2 days, down for 2-4 days last time before the next mid term uptrend.

The 7 Secrets Of Trading MasteryIn this video we are going to talk about:
Buy Limit Orders
Sell Limit Orders
Reversal Patterns
Double Tops
Double Bottoms
Using The Rocket Booster Strategy
The Power Of Risk Management
Watch this video on CAPITALCOM:EURAUD in order for you to learn more
take care and trade safe.
Rocket Boost This Content To Learn More
Disclaimer;Trading is risky please a simulation ion trading account
before you trade with real money
also learn risk management and profit taking strategies.

USOIL BULLS ARE STRONG HERE|LONG
USOIL SIGNAL
Trade Direction: short
Entry Level: 67.26
Target Level: 68.46
Stop Loss: 66.46
RISK PROFILE
Risk level: medium
Suggested risk: 1%
Timeframe: 1h
Disclosure: I am part of Trade Nation's Influencer program and receive a monthly fee for using their TradingView charts in my analysis.
✅LIKE AND COMMENT MY IDEAS✅

EUR/CHF SHORT FROM RESISTANCE
Hello, Friends!
EUR/CHF pair is in the uptrend because previous week’s candle is green, while the price is obviously rising on the 5H timeframe. And after the retest of the resistance line above I believe we will see a move down towards the target below at 0.926 because the pair overbought due to its proximity to the upper BB band and a bearish correction is likely.
Disclosure: I am part of Trade Nation's Influencer program and receive a monthly fee for using their TradingView charts in my analysis.
✅LIKE AND COMMENT MY IDEAS✅

EUR/NZD BEARS WILL DOMINATE THE MARKET|SHORT
Hello, Friends!
EUR/NZD pair is trading in a local uptrend which we know by looking at the previous 1W candle which is green. On the 12H timeframe the pair is going up too. The pair is overbought because the price is close to the upper band of the BB indicator. So we are looking to sell the pair with the upper BB line acting as resistance. The next target is 1.929 area.
Disclosure: I am part of Trade Nation's Influencer program and receive a monthly fee for using their TradingView charts in my analysis.
✅LIKE AND COMMENT MY IDEAS✅

Pengu inverse 12 hourOn the inverse chart I believe what we are seeing is a trend line break followed by a failed reclaim. This then lead to two swing high fails and is now starting its way into continuation (UP). On the hourly I believe it is currently on the cusp of its last “gasp” as it’s creating the peak of its rounded bounce. Still a few hours for this candle to confirm but at this moment I am anticipating acceleration towards ATH.

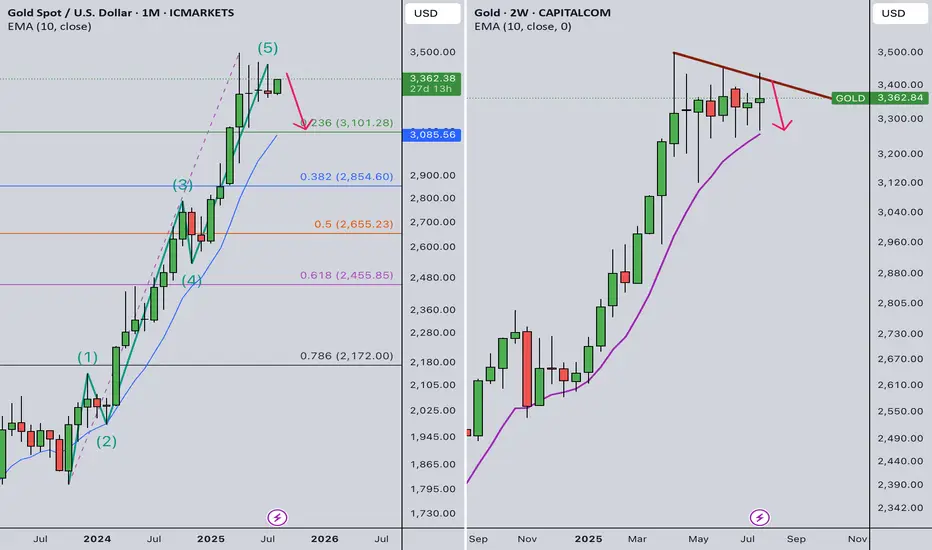
Gold Weekly Summary and Forecast 8/2/2025In monthly TF, gold has completed the full Elliot wave and it should go into a series of correction. But in 2W TF, it printed out a green bar. However, the trendline still valid. As long as the trendline is not broken, I am still bearish in gold in medium term.
Therefore, for next week, gold should first go up and should be capped at 3410. Price could quickly drop after that.
Let's see how the market plays out next week.
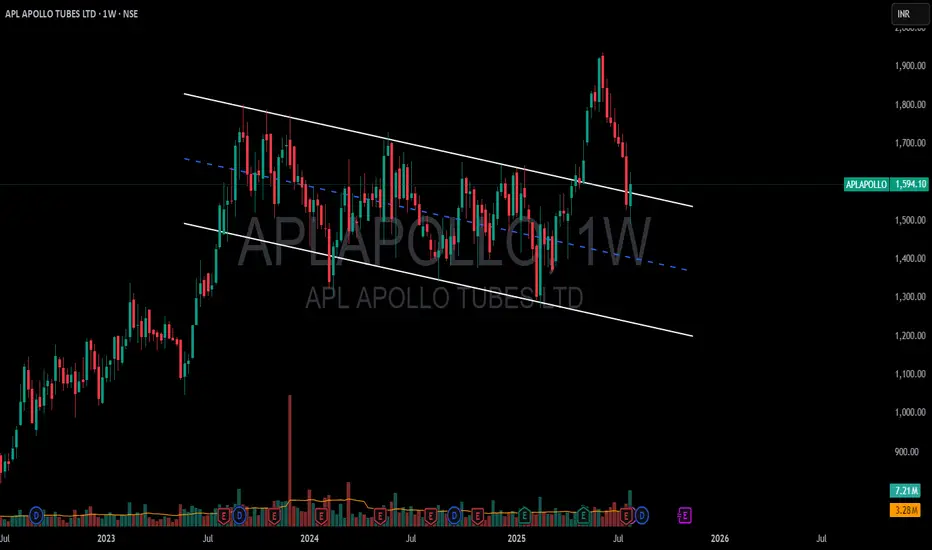
APL APOLLO TUBES Ltd. 1W📈 APL Apollo Tubes Ltd. – Bullish Channel Breakout
🔍 Pattern Insight:
Pattern: Bullish Channel (Falling or Rising?) Breakout
(Most likely a falling channel, which is bullish when broken upward)
Current Price: ~₹1594
Breakout Status: ✅ Breakout done
Current Action: 🔁 Retest phase underway
All-Time High (ATH): ₹1,685 (approx as per recent charts)
📊 Technical Setup:
Aspect Details
🔓 Breakout Type Bullish channel (indicates trend reversal or continuation)
🔁 Retest Currently testing breakout zone (bullish if holds ~₹1580–1600)
🔥 Confirmation High volumes + bullish candle near ₹1600
📈 Next Resistance ₹1640 → ₹1685 (ATH)
🧨 Break Above ATH Blue sky breakout; target can go into uncharted territory
🎯 Target Zones After Momentum:
Phase Target
✅ Breakout Sustains ₹1640 (minor supply)
🔼 ATH Challenge ₹1685 (strong resistance)
🚀 Post ATH ₹1750 → ₹1800 (based on Fibonacci or channel projection)
🛡️ Risk Management (Invalidation Levels):
Retest below ₹1575–1560 with strong red candle and volume = ⚠️ weak setup
Better to keep a stop-loss below ₹1550 if swing trading
📅 Strategy Suggestion:
🧪 If you're planning an entry:
✅ Entry Zone: ₹1590–1600 (post confirmation of support)
🛑 Stop-loss: ₹1548 (safely below breakout zone)
🎯 Targets:
1st: ₹1640
2nd: ₹1685
3rd (if ATH breaks): ₹1750+
📌 Summary:
APL Apollo has shown a bullish channel breakout ✅
Retest in progress → if buyers defend ~₹1580–1600 zone with volume, uptrend may resume
Potential to break ATH of ₹1685 if momentum continues
Watch volume and Nifty Metal Index for broader confirmation
Disclaimer: The information provided is for educational and informational purposes only and should not be considered as financial advice. Investing in the stock market involves risk, and past performance is not indicative of future results. Please consult with a certified financial advisor or conduct your own research before making any investment decisions. We are not responsible for any losses incurred as a result of using this information. Stock market investments are subject to market risks; read all related documents carefully.
GBPNZDA swing move on GBPNZD. Price is likely to breakout from a bearish flag and also a Clear candle stick rejection from a Fib level

VETUSDT is BullishPrice was in a downtrend, however the bullish divergence with a double bottom reversal pattern hints the control of bulls. If previous lower high is broken with good volume then we can expect a bullish reversal as per Dow theory. Targets are mentioned on the chart.

Overhyed Punishment This is what happens when everyone starts to fomo.
Lucky things, I sold some of my Altcoin with profit when BTC went into overbought band as in my chat.
BTC is bearish as long as below 117.6 to 118k :) . Good luck

Amber Enterprises Amber Enterprises – Q1 FY26 Concall Highlights
## Robust Growth | Strategic Capex | Margin Focus
## Financials
- Revenue: ₹3,449 Cr (↑ 44% YoY)
- Operating EBITDA: ₹263 Cr (↑ 31% YoY)
*Margin impacted by product mix*
- PAT: ₹106 Cr (↑ 42% YoY)
- FY26 EBITDA Margin Guidance: 8–9%
Resistance 8000 support 7820
Weekly RSI taken support @ 60

USDJPY BULLISHTechnically:
Daily bullish
Bullish trendline support
200 EMA retest
Fib retracement
No bearish divergence

Long-Term Technical Outlook: Critical Decision Point Approaching
The chart illustrates a long-term technical structure where the price has been following an ascending channel after a prolonged bearish trend. However, recent price action indicates a breakdown below the green ascending trendline, raising concerns about a potential shift in market sentiment.
Currently, the $117 level is acting as a pivotal support zone. A sustained breakdown below this level — and more critically, below the red lower trendline — would validate the bearish scenario. This could trigger a deeper correction phase, with downside targets aligned along the red projection path. Such a move may lead to significantly lower price levels in the medium to long term.
🔽 Bearish Scenario:
If the price fails to hold above $117 and breaks below the red trendline, this would confirm the start of a bearish leg. Based on historical structure and projected trajectories, this could result in a descent toward the $93 level initially, with the possibility of extending further downward depending on market conditions.
🔼 Bullish Scenario:
On the other hand, if the price manages to reclaim the green trendline and more importantly, stabilize above the $204 resistance zone, it would signal renewed bullish strength. Such a move would open the path toward higher highs, potentially re-entering the previous upward channel and continuing the macro uptrend.
🧭 The price structure is now approaching a decisive zone, where either a confirmation of bearish continuation or a bullish recovery will likely unfold. Both scenarios have been visually outlined — green lines indicating bullish continuation, and red lines representing bearish momentum.
📌 Note: This analysis is for educational purposes only and should not be interpreted as financial advice.

One of these lines will be right..I expect a pump in the next 2 days otherwise we will fall and continue on the next support line. Odds are 70/30

SILVER WILL FALL|SHORT|
✅SILVER is going up now
But a strong resistance level is ahead at 37,60$
Thus I am expecting a pullback
And a move down towards the target of 36,69$
SHORT🔥
✅Like and subscribe to never miss a new idea!✅
Disclosure: I am part of Trade Nation's Influencer program and receive a monthly fee for using their TradingView charts in my analysis.

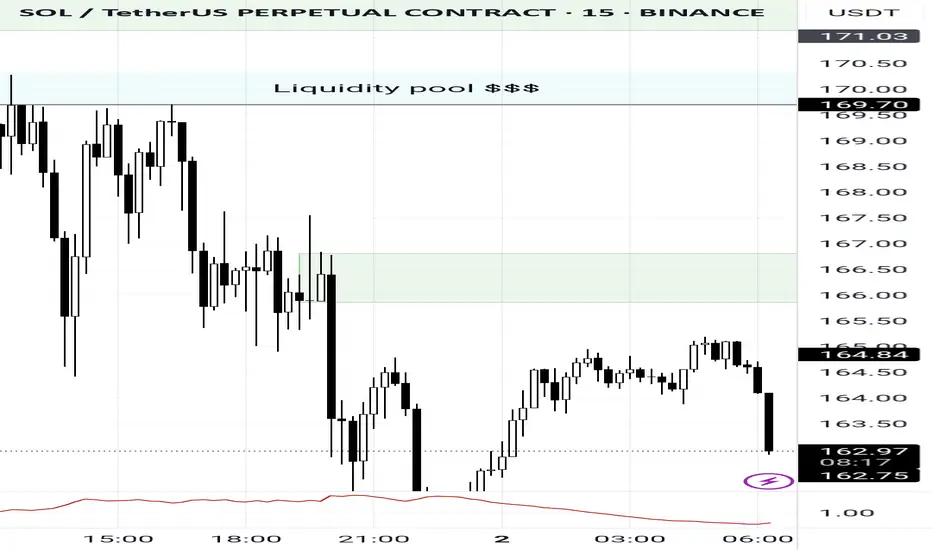
SOL BEARISH CONTINUATIONAs the market continues to create new lows, something caught my eye.
3 areas of unwicked impulsive moves (FVG's) lying around 165.18 - 166.80, 167.65 - 169.69 and 170.32 - 172
With this, I identified two order blocks
.
I'm traditionally wired to prefer the latter because there's more confluence factors;
A liquidity pool 169.70 - 170.3 established by price struggling to close above that level followed immediately by a FVG into an OB.
Price would have an instant reaction downwards if it traded to those levels.
However, the buying pressure might not be sufficient to push price to those levels before the crash.
Hence the other order block.
I'd be paying close attention to observe how it plays out.
Nifty : Technical levels metAs shared last week the nifty support 24510 , 24850 levels were worked as support exactly.
Now we may see sideways market and range bounded moves.
Sharing fresh levels:
Support : 24460
Resistance: 24660, 24850

Cardano sellll shorts All markets have TB in August.
Cardano sellll short
Tp1:0.50
Tp2:0.44
Tp3:0.29
Tp4:0.16😄😄😄😄😄

Bid on AI system limited Pakistan top IT services companyABCD pattern
Rsi div
Trend reversal
3 bull point to buy
comment if you have any bearish point.
