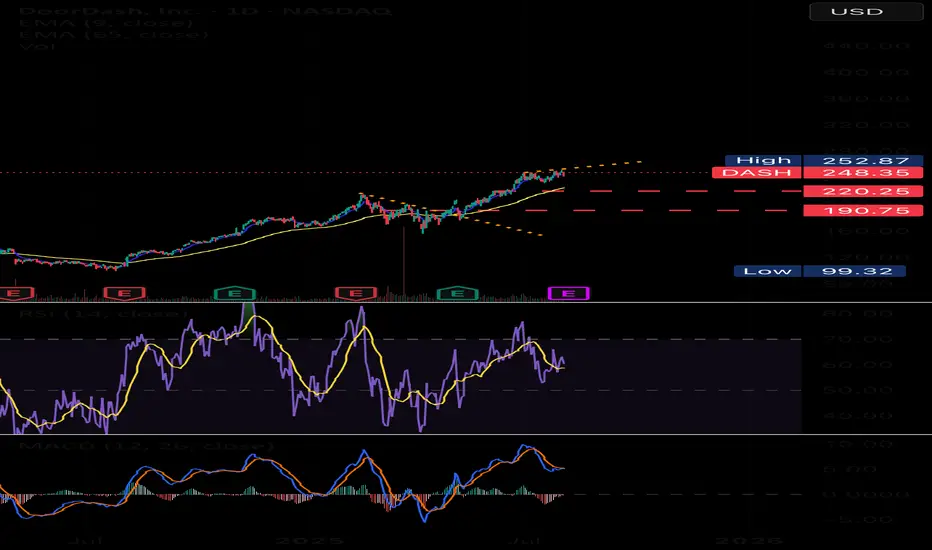
$DASH NASDAQ:DASH buyers look hesitant to buy right now after the weak job report and the Fed signaling no rate cuts anytime soon. This adds pressure on consumer pockets, limiting discretionary spending. If this trend continues, we might see DoorDash consumers slow down their activity, which could impact the company’s revenue growth.
With macro headwinds and reduced consumer demand, NASDAQ:DASH price action could remain under pressure in the short term. A break below key support levels may trigger further downside unless the market sentiment shifts with improved economic data.
Chart Patterns
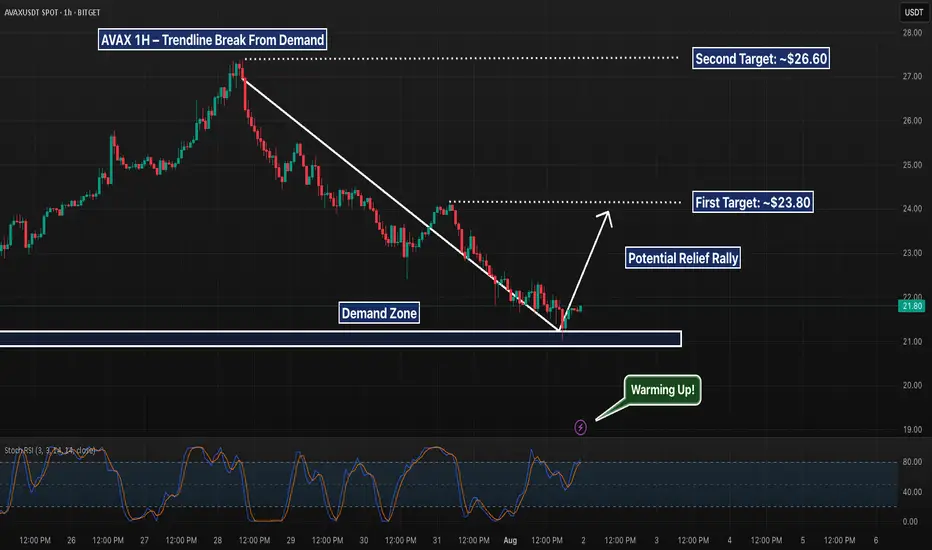
AVAX - Trendline Break From Demand, But Can Bulls Push to $24?AVAX is showing signs of life after rebounding cleanly off a local demand zone near $21 and breaking its recent downtrend line. This structure opens the door to a possible short-term rally — with first resistance sitting near $23.80 and a secondary target at $26.60. However, Stoch RSI is already pushing into overbought, so momentum must sustain or risk another fade.
A retrace to retest the broken trendline and hold would add confluence for longs. If that fails, bulls may get trapped.
📌 Demand bounce
📌 Trendline break
📌 Eyes on follow-through to reclaim higher levels
This is early-stage structure shift — not confirmation yet, but worth watching.
NE - Looking for strong bullish continuationN wave with N, NT & V projection.
Cup & Handle pattern.
The pattern strongly resembles a "Cup and Handle" formation, supported by an N wave structure with Ichimoku alignment.
Cup and Handle Pattern
Cup Shape: Smooth U-curve from Nov 2024 to Jul 2025.
Handle: A short pullback forming higher lows between late July and early August.
Breakout Area: 0.740 is the rim resistance — breakout above this will confirm the Cup & Handle.
- Valid Cup & Handle characteristics:
Rounded bottom (accumulation phase).
Handle with light pullback and low volume.
Breakout attempt with increasing volume (watch confirmation).
Price is well above the Kumo: Clear bullish trend.
- Tenkan-sen > Kijun-sen: Short-term momentum is bullish.
V as immediate resistance at 0.715. If price stay above this level, confirming the bullish continuation.
Entry (Breakout Buy) 0.740 (above resistance/handle)
Aggressive Entry 0.660–0.675 (on handle support bounce)
Stop Loss 0.620 (below handle and Tenkan/Kijun)
TP1 (V) 0.715
TP2 (NT) 0.770
TP3 (N) 0.815
- Chikou Span is above the cloud and price: Confirming trend support.
- Kumo Future is Bullish: Strong foundation for continuation.
Note:
1. Analysis for education purposes only.
2. Trade at your own risk.

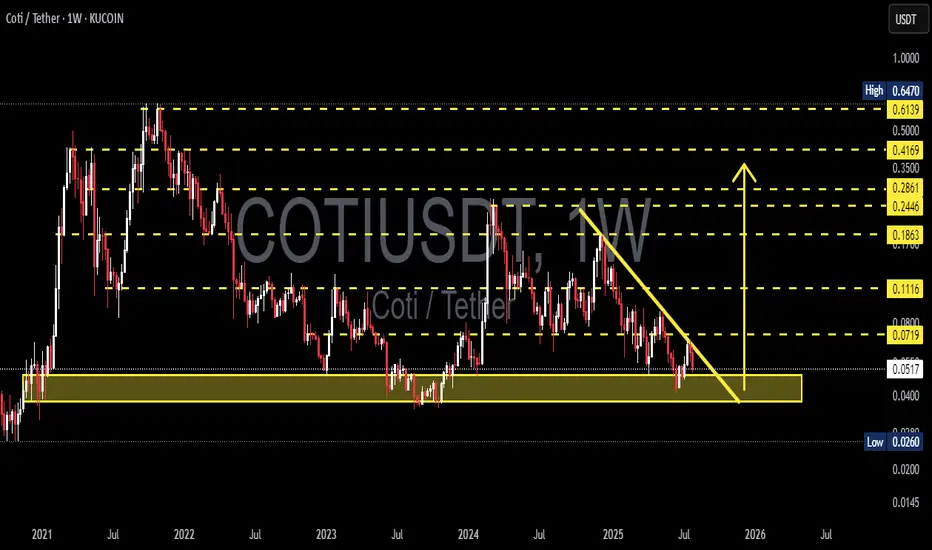
COTIUSDT Weekly Analysis Potential Reversal?📍 Current Price Position – On Top of Historical Support!
The COTI/USDT pair is currently testing a crucial support zone between $0.0400 – $0.0517, which has been a key demand zone since early 2021. This isn't just any support — it's a macro psychological area that has repeatedly triggered strong reversals in the past.
We are at a make-or-break level, where the next move could define the mid-term trend.
---
🧩 Price Structure and Pattern
📐 The chart shows a descending triangle pattern with:
Consistently lower highs (marked by the downward yellow trendline),
Flat horizontal base around the major support zone.
This pattern can result in:
A powerful breakout if the trendline is broken, or
A sharp breakdown if the horizontal support fails.
---
📈 Bullish Scenario: Reversal Momentum Building?
If price:
Breaks above the descending trendline (~$0.0719), and
Closes a weekly candle above that resistance zone,
➡️ We could see a breakout move with targets at:
Resistance Level Target
Initial Target $0.1116
Mid-Term Target $0.1863
Strong Zone $0.2446 – $0.2861
Long-Term Bullish $0.35 – $0.4169
📌 A confirmed higher high and higher low structure above $0.11 would strengthen the bullish case.
---
📉 Bearish Scenario: Breakdown from Support
If:
Price fails to hold the $0.0517 – $0.0400 support area,
and prints a weekly close below this zone,
➡️ The next bearish targets could be:
Support Level Target
First Support $0.0260
Psychological Level $0.0200
Extreme Panic Zone $0.0150 – $0.0100
⚠️ This would indicate a capitulation phase, likely to trigger panic selling and deeper lows.
---
🧠 Strategy Notes for Traders
✅ For Position Traders:
The $0.040 – $0.0517 area is a prime watch zone for reversal setups with tight stop-loss below $0.040.
Excellent Risk:Reward potential if reversal confirms.
✅ For Swing Traders:
Breakout above the trendline offers a solid entry signal.
Targets up to $0.1863 look achievable with strong volume.
✅ For Conservative Traders:
Wait for breakout + retest confirmation before entering.
Avoid FOMO — let the weekly candle close guide your decision.
---
⚡️ Final Takeaway
> COTI/USDT is at a tipping point!
This long-standing support is the last line of defense for the bulls. A breakout can trigger a macro trend reversal, while a breakdown will extend the downtrend and invite heavier selling pressure.
Watch for the weekly close, trendline reaction, and volume behavior — the next major move is likely just around the corner.
#COTI #COTIUSDT #CryptoAnalysis #AltcoinWatch #DescendingTriangle #BreakoutTrading #SupportAndResistance #PriceAction #ChartPattern #WeeklyAnalysis
Bullish potential detected for TLCEntry conditions:
(i) higher share price for ASX:TLC along with swing up of the DMI indicators and swing up of the RSI indicator, and
(ii) observation of market reaction at the support/resistance level at $5.31 (from the open of 12th May).
Stop loss for the trade would be, dependent of risk tolerance (once the trade is activated):
(i) below the support level from the open of 21st November (i.e.: below $5.05), or
(ii) below the recent swing low of 3rd June (i.e.: below $4.96).

Potential outside week and bullish potential for CXOEntry conditions:
(i) higher share price for ASX:CXO above the level of the potential outside week noted on 27th June (i.e.: above the level of $0.1025).
Stop loss for the trade would be:
(i) below the low of the outside week on 20th June (i.e.: below $0.083), should the trade activate.

EURAUD BULLISH MOVE CONTINUESOur analysis is based on a multi-timeframe top-down approach and fundamental analysis.
Based on our assessment, the price is expected to return to the monthly level.
DISCLAIMER: This analysis may change at any time without notice and is solely intended to assist traders in making independent investment decisions. Please note that this is a prediction, and I have no obligation to act on it, nor should you.
Please support our analysis with a boost or comment!

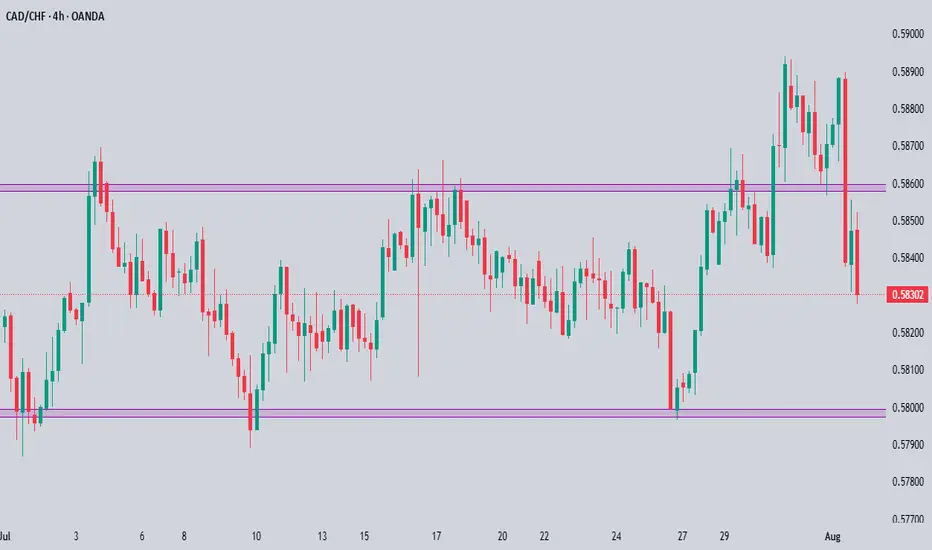
CADCHF Technical & Order Flow AnalysisOur analysis is based on a multi-timeframe top-down approach and fundamental analysis.
Based on our assessment, the price is expected to return to the monthly level.
DISCLAIMER: This analysis may change at any time without notice and is solely intended to assist traders in making independent investment decisions. Please note that this is a prediction, and I have no obligation to act on it, nor should you.
Please support our analysis with a boost or comment!
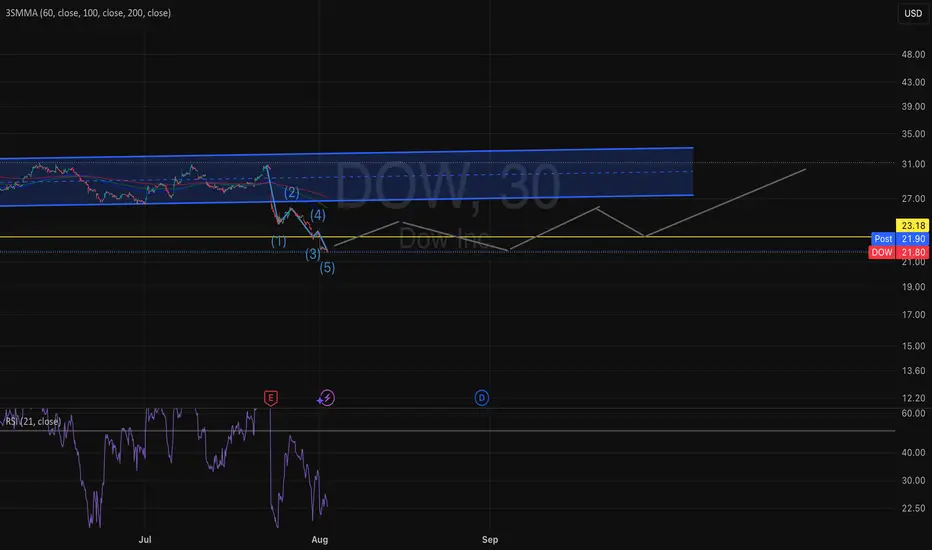
Will the DOW every Rally after Tariffs?Disclaimer: I do NOT know what I am doing.
Based on Elliot Wave, recent consolidation, and Phi sequencing, the pullback for 'Merican production should fire up the movement.
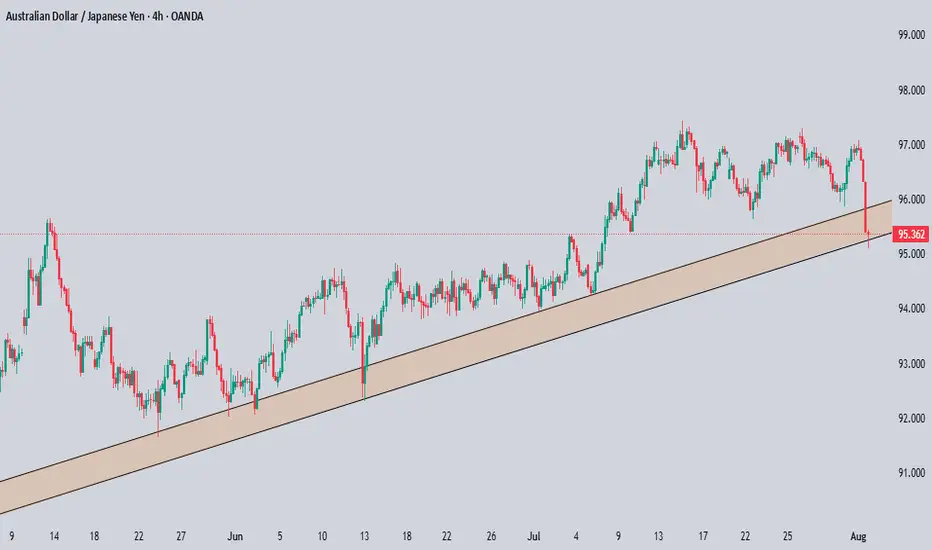
AUDJPY Technical & Order Flow AnalysisOur analysis is based on a multi-timeframe top-down approach and fundamental analysis.
Based on our assessment, the price is expected to return to the monthly level.
DISCLAIMER: This analysis may change at any time without notice and is solely intended to assist traders in making independent investment decisions. Please note that this is a prediction, and I have no obligation to act on it, nor should you.
Please support our analysis with a boost or comment!
$DUOl Bottomed? PT $600 Bounced off where it is supposed to on the lower trendline. This is on linear scale and if
DUOL manages to reclaim the 8SMA, things will start looking better to the upside. One step at a time! ;)
PT $600+ (Top of the channel)

08/1/25 Trade Journal, and ES_F Stock Market analysis EOD accountability report: +440
Sleep: 6 hours
Overall health: Good
VX Algo System Signals from (9:30am to 2pm)
— 9:30 AM Market Structure flipped bearish on VX Algo X3!
— 10:12 AM VXAlgo ES X1 Buy signal
— 10:20 AM VXAlgo NQ X1 Buy Signal
—12:30 PM Market Structure flipped bullish on VX Algo X3!
— 1:00 PM Market Structure flipped bearish on VX Algo X3!
— 1:50 PM VXAlgo ES X1 Buy signal,
— 3:00 PM Market Structure flipped bullish on VX Algo X3!**
What’s are some news or takeaway from today? and What major news or event impacted the market today?
Market range expanded a lot today, we dropped over 100 points today and sometimes i forget to adjust my bracket orders to go for 10 -15 points take profits when the volatility is so high. But overall, it was a good day, I knew to be patient as market was wild and sometimes you want to just snipe a few trades and call it a day before you get caught on the wrong side.
The great thing about big moves is that it will eventually hit a major level and it will react really well, you just have to wait for it.
a great question is will the market recover? Or is going back down to April prices?
News
*STOCKS TUMBLE TO END THE WEEK, VIX SPIKES AS SOFT JOBS DATA STOKE ECONOMIC JITTERS
What are the critical support levels to watch?
--> Above 6330= Bullish, Under 6310= Bearish

EUR-AUD Bullish Breakout! Buy!
Hello,Traders!
EUR-AUD made a bullish
Breakout of the falling resistance
And the breakout is confirmed
So we are bullish biased
And we will be expecting
A further bullish move up
On Monday!
Buy!
Comment and subscribe to help us grow!
Check out other forecasts below too!
Disclosure: I am part of Trade Nation's Influencer program and receive a monthly fee for using their TradingView charts in my analysis.

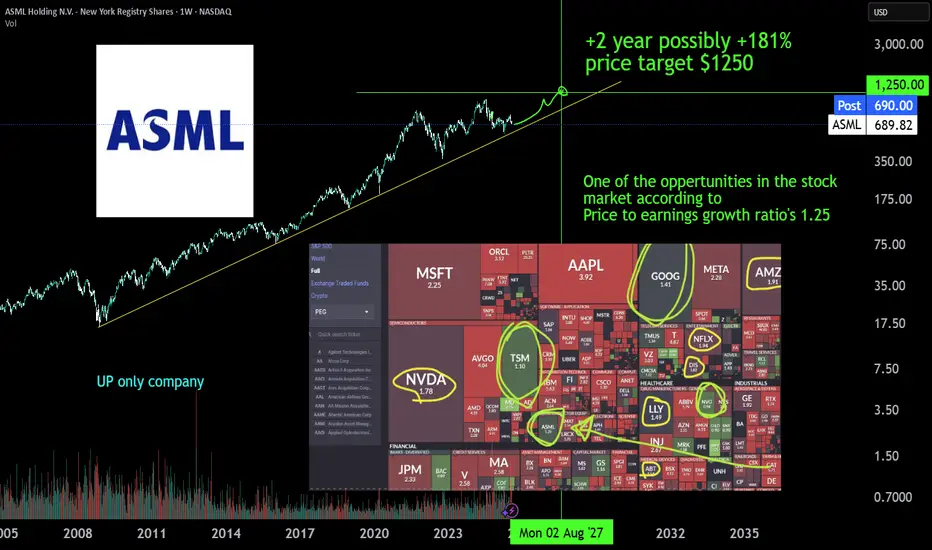
ASML monopolist, AI expanding +181% | 2Y oppertunity ASML is the monopoly Extreme ultra violet machinery company. There is no one close to it's technology or there is no one investing enough to R&D a thing like it. The whole AI datacenter and cloud chip growth depends on EUV machinery of ASML developed in 2013 (>10y of PhD level R&D deveopment). The first new High-NA EUV systems have been deployed at Intel in July 2025 for research purposes and will scale just like the EUV already does to keep pace with moore's law. TSMC has stated it will not yet depoly the machines but has to expand with to 10 year older tech EUV machines just to get the AI chip demand going. AI chip demand at NVIDIA is growing harder than expected comfirmed by latest earnigns of alphabet, microsoft, meta and amazon.
Also don't sleep on BESI a packing machinery wonder due to hydrid bonding technology, which makes 3D chip staking possible.
#GoHighTechNetherlands
SolSolana is currently in a correction phase, and a strong demand is forming near the 151 area.
As per the rules, the market should ideally start buying from here.

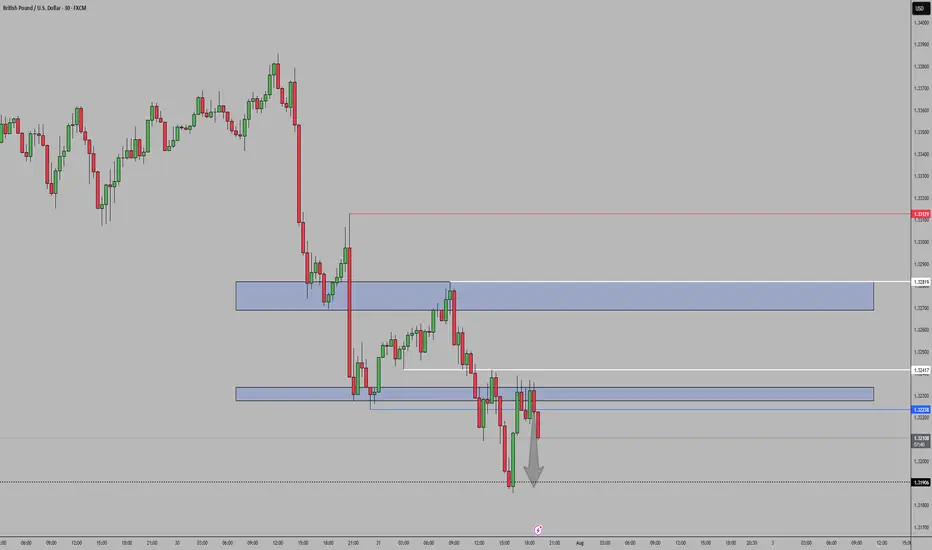
GBPUSDPrice Action: A key support zone has been broken and is now acting as resistance.
Market Structure: Lower highs + lower lows forming → confirms downtrend.
Bias: Bearish while price stays under the broken level.
Reversal from Channel Bottom or a Real Breakdown? Identifying th
🎯 BTCUSDT - Analysis
🔹 Analysis Date: 1 August 2025
📉BTCUSDT:
Price is currently moving inside an ascending channel and has touched the bottom of the channel again, offering a potential buy opportunity.
However, for those seeking a low-risk entry, the zone around 118,000 could be ideal—if price returns to the channel and confirms support.
Although it seems the channel’s lower boundary might break, this could be a fake break to mislead traders before a rebound.
The support at 110,000 is a crucial short-term level; if it fails, a deeper correction toward 98,090 or even 94,000 is likely.
Our targets remain at the upper boundary of the channel.
⚠️ Risk Management Tip: Wait for confirmation near 118,000 if unsure, and always size positions based on overall volatility.

Abbvie, maybe this time...
NYSE:ABBV has been very hard to trade...but with earnings behind us and good beat and guidance, I think this will run..
creating an ascending triangle here with higher highs into equal lows and a close above 197 next week could send this way past 200 IMO
healthcare sector is beaten down as it is, so any rotation into the sector will also help the stock

MARKET UPDATE— August 1st, 2025“Handle before lift-off? Or is the bull year cooling off?”
Let’s address the question everyone is silently asking:
Are we nearing the end of the bull year… or is this just the calm before the next storm?
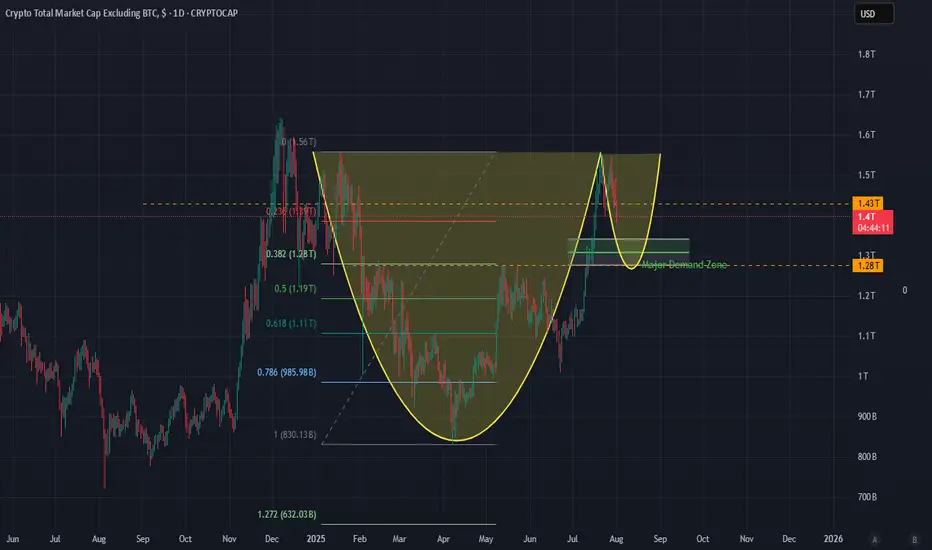
1. Total Market Cap (ALTS): Cup & Handle in Motion
We’ve observed something beautiful forming on the chart a clean cup and handle structure.
But here’s the twist: this isn’t just any setup it’s forming just below the infamous $1.43T ceiling, which has now rejected monthly closes in November, December, January, February, and July.
- High of January : $1.56T
- Low of April (Handle Base) : $0.83T
- High of July : $1.56T
These levels outline a powerful structure… but we haven’t launched yet. Why? Because the handle isn’t done cooking.
Based on Fibonacci retracement levels from the handle’s top to bottom:
- 0.236 sits at $1.32T
- 0.382 sits at $1.24T
- 0.5 sits at $1.195T
We’ve yet to hit those deeper levels, and considering ALT dominance , macro uncertainty (e.g., Trump tariffs ), and repeated monthly rejection below $1.43T , a retrace into $1.28T or deeper is not only possible.....it’s healthy .
This isn't the breakdown. It's the build-up.
2. Bitcoin: The Key That Turns the Lock
Now here’s where it gets intense.
Everyone’s assuming Bitcoin can hold $115K even if ALT dominance retraces to $1.28T .
Let’s be real:
> If ALT dumps, Bitcoin bleeds too.
And here’s what I see:
- There's a fair value gap between $113K and $111K , a probable first target.
- But beneath that lies the demand zone between $109K and $107.5K , loaded with liquidity.
- That liquidity is a magnet $107.5K is where the smart money lurks.
- A move from $115K to $107.5K is a 6–7% drop , and with ALTs faltering, it’s becoming increasingly probable.
This isn't panic territory. It's precision territory .
> We want that drop. That’s the spring before the sprint.
3. So what’s next?
This is how I see it:
- ALTS retrace into the $1.28T–$1.24T range, maybe wick to $1.19T completing the handle.
- BTC fills the FVG to $111K , then dives to $107.5K gathering all that demand before rebounding.
- Once BTC reclaims $113K and ALTS reattempt $1.43T , the stage is set. We’re looking at a clean slate… and clean breakouts .
🎯 What should you do with this?
1. Don’t panic—plan.
Use these drops as entries, not exits. Liquidity hunts aren’t to scare you—they’re to position the sharp ones.
2. Watch the zones like a hawk:
- BTC: $113K, then $107.5K
- ALTS: $1.28T, then $1.24T or $1.19T
3. Stay bullish—but strategic.
The structure is intact. Momentum is coiling. And once this handle completes, the push above $1.43T isn’t a maybe it’s a matter of timing.
💡 Final Word
Are we at the end of the bull year?
No . We're simply testing the patience of tourists… while giving early movers one final entry.
Are we going higher?
Absolutely. But first, we dip.... not because we’re weak… but because that’s what strength looks like before it roars.
Brace for impact. Then brace for ignition.
INDEX:BTCUSD
CRYPTOCAP:TOTAL2
Today's Long in Gold! Perfect setup... Lower level support multiple times, Entry WITH small SL and the news followed... 3299- 3350 🚀

BTC ReaccumulationI'm watching here either for a local model 1 which forms a MTF accumulation model 2 or a model 1 which deviates the range one more time. There is a nice build up of liquidity to the upside but sadly no clear model 2 POI. The technical target if the model gets confirmed will be the range high but i would expect to see a new ATH. Let's see.

MSTR....Free FallingMSTR looks like it is nosediving straight down. When one is bullish on BTC, it is important to also understand that volatility is a big part of the game - a very costly game with many losers! BTC has past several key TAs and we only just started - crossing $300 is in the horizon. Always do your own due diligence, and received ultrabear signal earlier to exit, and cut your losses soon.

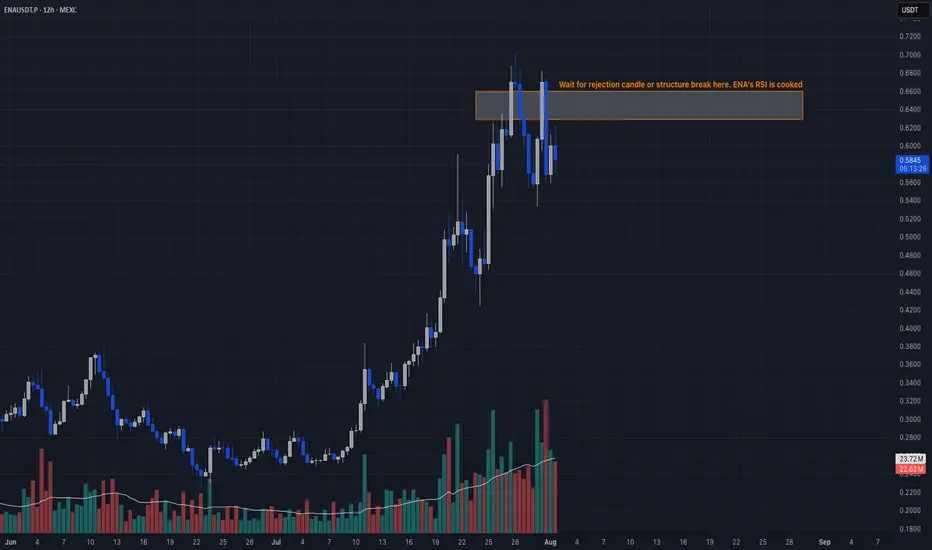
Overbought + Reversal Signal📣 Yo legends!
ENA got jacked on steroids lately, exploding in TVL and open interest like it’s headed to $10. But RSI at 82? Declining OI? That’s not strength, that’s a leverage hangover waiting to happen. Time to fade the party. 🥴
🔥 TRADE SETUP
Bias: Short
Strategy: Overbought + Reversal Signal
Entry: $0.63 – $0.66
SL: $0.71
TPs: $0.5446, $0.50, $0.42
Why?
– RSI 82 on daily = overheated
– Open interest dropping fast after topping $1.35B
– Funding collapsing → longs unwinding
– HTF sweep + LTF CHoCH confirmed.
Candle Craft | Signal. Structure. Execution.