Chart Patterns

USD/JPY: Fifth Wave Target in SightUSD/JPY is painting a textbook five-wave impulse structure from the recent lows, and we're now positioned for what could be the final act of this motive sequence.
Current Wave Count
✅ Waves 1-3 Complete: Clean impulsive structure with wave 3 showing strong extension
✅ Wave 4 in Progress: Currently correcting from the 150.94 high
🎯 Wave 5 Setup: Targeting completion around 151.95 - 152.20
Key Levels to Watch
Support Zone: 150.00 area (ideal wave 4 retracement)
This aligns with wave principle fourth-wave correction parameters
Provides a healthy pullback without threatening wave 1 overlap
Target: 151.95 - 152.20 zone for wave 5 completion
Classic 5 vs 1+3 projection
Trade Strategy
Monitor for supportive price action near 150.00
Look for an impulsive price action to confirm wave 5 beginning
Structure suggests one more leg higher before a larger correction
The beauty of Elliott Wave: when the count is this clean, the roadmap becomes crystal clear. Let's see if USD/JPY delivers this final push to complete the sequence.

Wedge Pattern: A Key to Trend Reversals and Continuations📈 Wedge Pattern: A Key to Trend Reversals and Continuations
A wedge pattern is a technical chart formation that signals a potential reversal or continuation in the market. It’s formed when price moves between two converging trendlines — either sloping upward or downward — creating a narrowing range over time.
There are two main types of wedge patterns:
🔻 Falling Wedge (Bullish)
Formed during a downtrend or as a correction in an uptrend.
Characterized by lower highs and lower lows, with the slope of the support line steeper than the resistance line.
Typically signals a bullish reversal as momentum builds for a breakout to the upside.
✅ Confirmation: Break above the resistance line with volume surge.
🔺 Rising Wedge (Bearish)
Appears during an uptrend or as a correction in a downtrend.
Shows higher highs and higher lows, but the support line is steeper than the resistance line.
Often leads to a bearish reversal, especially when volume declines into the pattern.
⚠️ Confirmation: Break below the support line with increasing volume.
🧠 Key Characteristics
Volume tends to decrease as the pattern forms, indicating a pause in momentum.
The breakout direction (up or down) determines whether it’s a continuation or reversal signal.
Wedges can appear on any time frame and are useful for both day traders and long-term investors.
📊 Trading Tip
Always wait for confirmation of the breakout before entering a trade. False breakouts can be common, especially in low-volume environments

Google in a distributive phase?Could be printing a distribution here. Early signs, so very early on this idea. Would need to see PA evolve like showed in the graph. Alternatively if it makes a HH, it could be printing a UTAD. Either way, I'll be looking for signs whether Wyckoff Distribution does indeed play out.

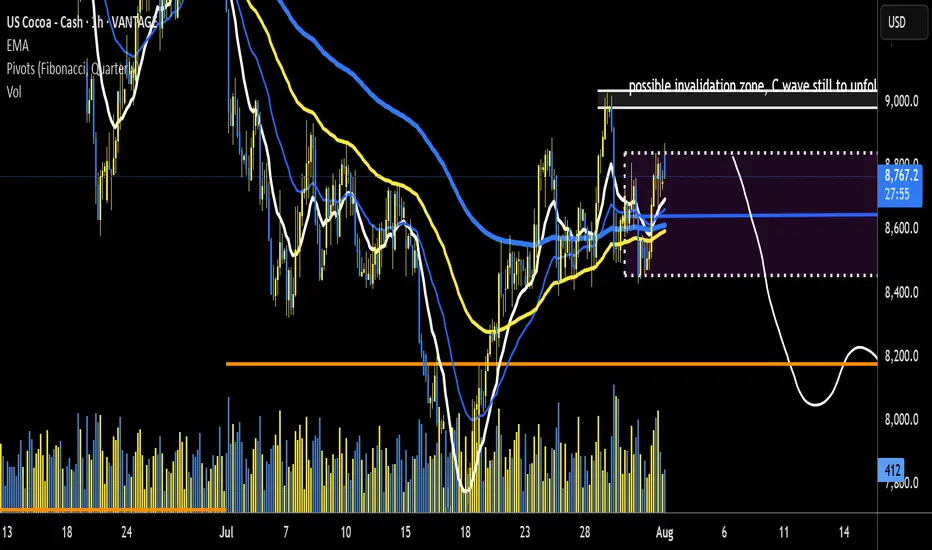
US Coco potential leg downRoad map laid. impulsive wave down - looking for entry signal and SL zone 15 and 5 min chart. a break of recent highs a good zone for SL a break above SL ZONE is possibly C in ABC structure unfolding. could imply even higher on cards. current risk ratio of min 1:5 ROI.
Liquidity sweep to $111,000 then bounce to new ATHBTC must see a liquidity sweep down to the previous resistance level of around $111k wiping out the over leveraged longs before a push to new highs. We are seeing this slowly unfolding now where a push down to $114k has just happened. Soon a momentary push down to $111k hitting old resistance levels and the currently 50 day moving average will occur with a quick bounce back to $114-$115k.
THIS IS WHEN WE WILL SEE NEW ATH’s🚀🚀

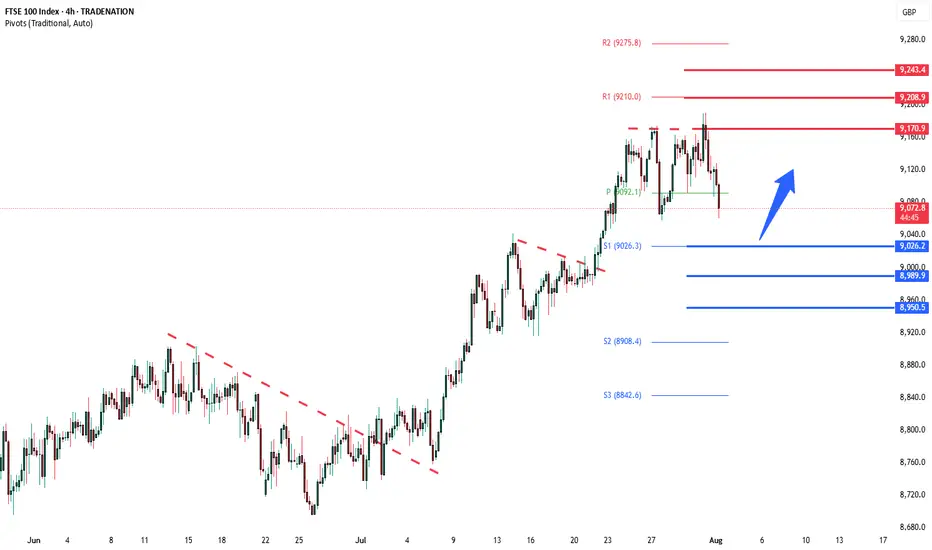
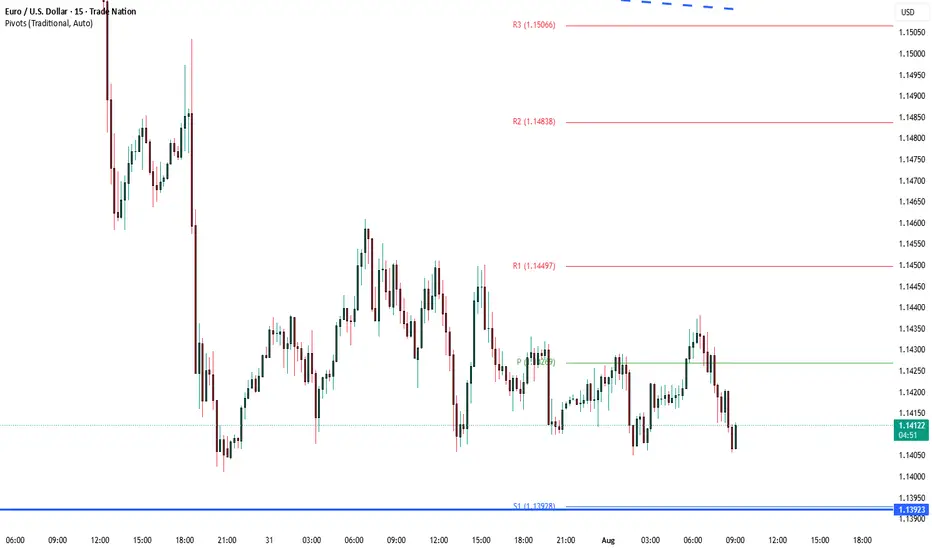
FTSE deeper corrective pullback supported at 9026The FTSE remains in a bullish trend, with recent price action showing signs of a corrective pullback within the broader uptrend.
Support Zone: 9026 – a key level from previous consolidation. Price is currently testing or approaching this level.
A bullish rebound from 9026 would confirm ongoing upside momentum, with potential targets at:
9170 – initial resistance
9208 – psychological and structural level
9245 – extended resistance on the longer-term chart
Bearish Scenario:
A confirmed break and daily close below 9026 would weaken the bullish outlook and suggest deeper downside risk toward:
8990 – minor support
8950 – stronger support and potential demand zone
Outlook:
Bullish bias remains intact while the FTSE holds above 9026. A sustained break below this level could shift momentum to the downside in the short term.
This communication is for informational purposes only and should not be viewed as any form of recommendation as to a particular course of action or as investment advice. It is not intended as an offer or solicitation for the purchase or sale of any financial instrument or as an official confirmation of any transaction. Opinions, estimates and assumptions expressed herein are made as of the date of this communication and are subject to change without notice. This communication has been prepared based upon information, including market prices, data and other information, believed to be reliable; however, Trade Nation does not warrant its completeness or accuracy. All market prices and market data contained in or attached to this communication are indicative and subject to change without notice.
The Day AheadWeekly Summary – Key Data & Earnings (Week Ending August 2, 2025):
Economic Data:
US Jobs Report: Job growth slowed slightly; unemployment ticked up. Supports Fed holding rates steady.
US Manufacturing (ISM): Sector still shrinking, showing weakness.
US Car Sales & Construction: Car sales rose; construction spending up, led by infrastructure.
China Manufacturing: Still contracting due to weak demand.
Japan Jobs Data: Job market remains tight and stable.
Italy: Manufacturing down, car sales slightly up, budget and retail sales steady.
Eurozone Inflation: Inflation slowed, increasing chances of ECB rate cuts.
Canada Manufacturing: Slipped into contraction.
Earnings Highlights:
Exxon & Chevron: Mixed—refining strong, but oil prices hurt results.
Linde: Solid growth from healthcare and clean energy demand.
Nintendo: Strong game and digital sales boosted profits.
AXA: Insurance strong, but investment income dipped.
Regeneron: Beat forecasts, thanks to strong drug sales.
Ares: Private credit demand lifted earnings.
Engie: Renewables helped balance weaker thermal output.
Daimler Truck: Demand steady, but profit margins hit by costs.
LyondellBasell: Missed targets due to weak chemicals demand.
Moderna: COVID sales down; focus now on future drug pipeline.
Takeaway:
The global economy is slowing, but US jobs and spending remain resilient. Companies reported mixed earnings. Central banks are likely to stay cautious, with possible rate cuts ahead if weakness continues.
This communication is for informational purposes only and should not be viewed as any form of recommendation as to a particular course of action or as investment advice. It is not intended as an offer or solicitation for the purchase or sale of any financial instrument or as an official confirmation of any transaction. Opinions, estimates and assumptions expressed herein are made as of the date of this communication and are subject to change without notice. This communication has been prepared based upon information, including market prices, data and other information, believed to be reliable; however, Trade Nation does not warrant its completeness or accuracy. All market prices and market data contained in or attached to this communication are indicative and subject to change without notice.
Vanguard Australian Shares Index ETF (VAS) Vanguard Australian Shares Index ETF (VAS)
EFT Info :
Vanguard Australian Shares Index ETF (VAS) is an investment fund traded on the Australian stock exchange that allows investors to buy shares in approximately 300 of Australia's largest companies with a single purchase.
Chart Analysis
The Monthly zone is promising, entry is at 87.54 however thats the lowest timeframe i could use here.
Conc:
1.As this is monthly timeframe movement is in months and hence the long wait.
2. The zone is risky and would require a confirmation kind of trade to get into
Prop:
The Vanguard is well established and an entry would not require a target as its a wait and hold

AUDNZD still bullish trend expecting
OANDA:AUDNZD last five analysis accurate (attached), here is new view on AUDNZD, still bullish expecting, price is not break strong zone, bouncing - pushing strongly from same, looks like DESCENDING CHANNEL is breaked.
Here still bullish expectations having.
SUP zone: 1.09100
RES zone: 1.10300, 1.10600

POL USDT LONG TRADE SETUPNew Trade Setup: POL-USDT
LONG
Entry: 0.1979 OR CMP
Target: TP1: 0.2049, TP2: 0.2118, TP3: 0.2188, TP4: 0.2257
Stoploss: 0.1891
Leverage: 1X
Technical Analysis: POL/USDT has been facing strong resistance, and a price reversal may occur soon in the short term.

Smart Liquidity in TradingIntroduction: What Is Smart Liquidity in Trading?
Liquidity is the backbone of financial markets—it refers to how easily assets can be bought or sold without causing drastic price changes. But as markets have evolved with the rise of algorithmic trading, decentralized finance (DeFi), and AI, a more sophisticated concept has emerged: Smart Liquidity.
Smart Liquidity isn’t just about having buyers and sellers in a market. It’s about efficient, dynamic, and intelligent liquidity—where technology, data, and algorithms converge to improve how trades are executed, how markets function, and how risks are managed. Whether in traditional stock markets, forex, or blockchain-based platforms, smart liquidity is now central to modern trading strategies.
Chapter 1: Understanding Traditional Liquidity
Before diving into smart liquidity, let's revisit the basics of traditional liquidity:
Bid-Ask Spread: A narrow spread indicates high liquidity; a wide one shows low liquidity.
Market Depth: The volume of orders at different price levels.
Turnover Volume: How frequently assets are traded.
Price Impact: How much a large order moves the price.
In traditional finance, liquidity providers (LPs) include:
Market makers
Banks and financial institutions
High-frequency trading firms
Exchanges
Liquidity ensures:
Stable pricing
Smooth trade execution
Lower transaction costs
Chapter 2: The Evolution Toward Smart Liquidity
What Changed?
Algorithmic Trading: Algorithms can detect, provide, or withdraw liquidity in milliseconds.
Decentralized Finance (DeFi): Smart contracts offer on-chain liquidity pools without intermediaries.
AI & Machine Learning: Predictive models can identify where liquidity is needed or likely to shift.
Smart Order Routing (SOR): Optimizes trade execution by splitting orders across multiple venues.
These technologies gave rise to “smart liquidity,” where liquidity is not static but adaptive, context-aware, and real-time optimized.
Chapter 3: Components of Smart Liquidity
1. Liquidity Intelligence
Advanced analytics track:
Market depth across exchanges
Order flow trends
Latency and slippage statistics
Arbitrage opportunities
This helps institutions dynamically manage their liquidity strategies.
2. Smart Order Routing (SOR)
SOR systems:
Automatically split large orders across venues
Route based on fees, liquidity, latency, and execution quality
Reduce market impact and slippage
SOR is key in both equity and crypto markets.
3. Algorithmic Liquidity Providers
Market-making bots adjust quotes in real-time based on:
Volatility
News sentiment
Volume spikes
Risk exposure
They enhance liquidity without manual intervention.
4. Automated Market Makers (AMMs)
Used in DeFi:
No traditional order book
Prices determined algorithmically via a liquidity pool
Traders interact with pools, not people
Popular AMMs: Uniswap, Curve, Balancer.
Chapter 4: Use Cases of Smart Liquidity
1. HFT Firms and Institutions
Use predictive liquidity models
Deploy SOR to reduce costs and slippage
Balance exposure across markets
2. Retail Traders
Benefit from tighter spreads and faster execution
Use platforms with AI-driven order matching
3. Decentralized Finance (DeFi)
Anyone can provide liquidity and earn fees
Smart liquidity enables 24/7 trading with no intermediaries
New protocols optimize capital allocation via auto-rebalancing
4. Stablecoin & Forex Markets
Smart liquidity ensures 1:1 peg stability
Algorithms prevent arbitrage imbalances
Chapter 5: Key Metrics to Measure Smart Liquidity
Metric Description
Slippage Difference between expected and actual execution price
Spread Efficiency How close bid-ask spreads are to theoretical minimum
Fill Rate How much of an order is filled without delay or rerouting
Market Impact Price movement caused by a trade
Liquidity Utilization How efficiently capital is allocated across pairs/assets
Latency Time taken from order input to execution
These metrics help evaluate the quality of liquidity provided.
Chapter 6: Risks and Challenges of Smart Liquidity
Despite its benefits, smart liquidity isn’t perfect.
1. Flash Crashes
Caused by sudden withdrawal of liquidity bots
Example: 2010 Flash Crash in U.S. equities
2. Manipulation Risks
Predatory algorithms can spoof or bait other traders
"Liquidity mirages" trick algorithms
3. Smart Contract Failures (DeFi)
Vulnerabilities in AMMs can drain entire liquidity pools
Hacks like those on Curve and Poly Network show smart liquidity can be fragile
4. Impermanent Loss (DeFi)
LPs may lose value if asset prices diverge significantly
Complex math and simulations needed to manage it
5. Regulatory Uncertainty
Especially in crypto, regulators still debating on decentralized liquidity protocols
Conclusion
Smart liquidity represents the next evolution of market infrastructure. It's not just about having capital in the market—it's about how that capital moves, adapts, and executes.
From hedge funds deploying intelligent routing systems to DeFi users earning yields through AMMs, smart liquidity touches every corner of modern finance. As technology continues to mature, expect liquidity to become even more predictive, responsive, and intelligent—unlocking a new level of speed, precision, and access for traders around the world.
GBPUSDAs the USD continues to rise, the GBP is expected to drop further, possibly reaching the previous support at 1.31448.

UKX Trending UpUKX bullish continuation.
It could pull back to 8900 and continue with the Head and Sholder pattern on the weekly time scale with a price target of 9975.
Pattern and breakout confirmed.

#DAXDate: 01-08-2025
#DAX Current Price: 23680
Pivot Point: 24193.295 Support: 23822.409 Resistance:24566.692
Upside Targets:
🎯 Target 1: 24882.344
🎯 Target 2: 25197.995
🎯 Target 3: 25574.758
🎯 Target 4: 25951.520
Downside Targets:
🎯 Target 1: 23505.502
🎯 Target 2: 23188.595
🎯 Target 3: 22811.833
🎯 Target 4: 22435.070
#TradingView #Nifty #BankNifty #DJI #NDQ #SENSEX #DAX #USOIL #GOLD #SILVER
#BHEL #HUDCO #LT #LTF #ABB #DIXON #SIEMENS #BALKRISIND #MRF #DIVISLAB
#MARUTI #HAL #SHREECEM #JSWSTEEL #MPHASIS #NATIONALUM #BALRAMCHIN #TRIVENI
#USDINR #EURUSD #USDJPY
#SOLANA #ETHEREUM #BTCUSD #MATICUSDT #XRPUSDT
#Crypto #Bitcoin #BTC #CryptoTA #TradingView #PivotPoints #SupportResistance

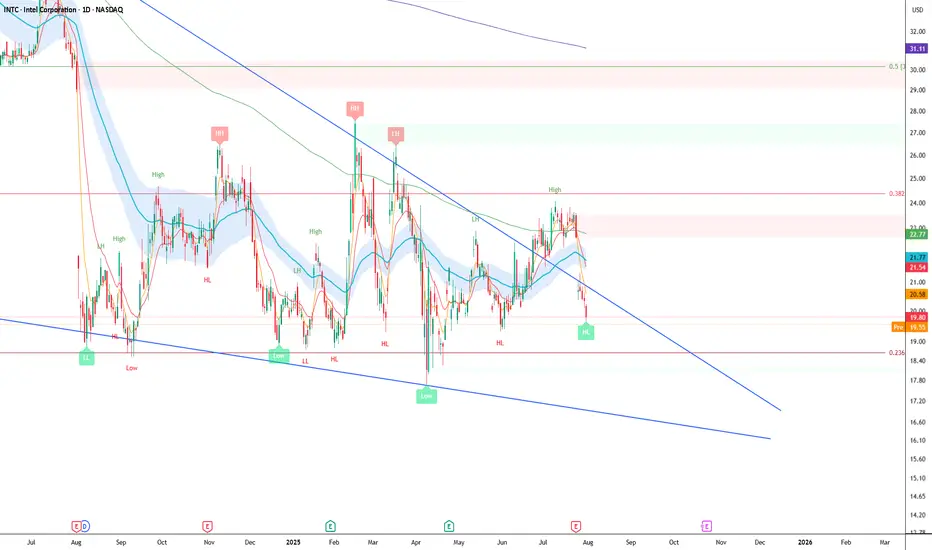
Intel Falling Wedge UpdateIntel Falling Wedge Pattern is not finished and still valid.
Failed to get above 0.382 so we could see $16-18, nice little gap to fill above the falling wedge trendline.
The pattern is valid on the weekly time scale.
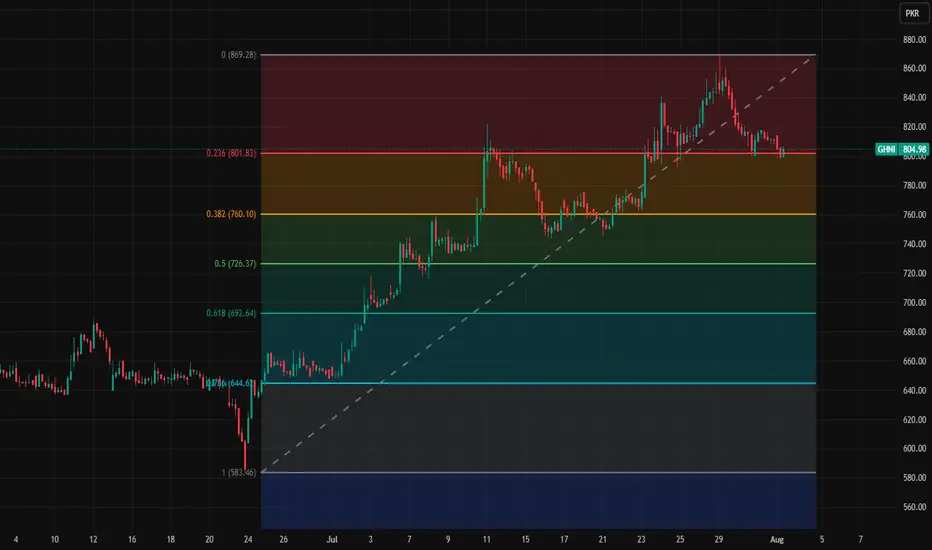
Skipper Ltd Elliot Wave Theory
Looks Great for a Target of 600-620+
Can be added on Dips till 505 Levels

REL Power : Hit the support of 50 as mentioned earlier REL Power : Hit the support of 50 as mentioned in the earlier post
( Not a Buy / Sell Recommendation
Do your own due diligence ,Market is subject to risks, This is my own view and for learning only .)

Gold on NFP : Bearish OutlookGold is moving on fundamentals. Technical also validates the fundamental changes in market.
This week’s Fundamental developments:
• FED kept interest rates un changed: Bearish for Gold
• Trade/tariff war seems to settle Down: Bearish for Gold.
• US GDP Results Positive: Bearish for Gold
• Inflation: Results High inflation in US: Bearish for Gold.
Now today on Friday we have US Nonfarm payroll announcement. If the NFP also comes positive. It will add more fuel in dollar buying and DXY bullish chart will add more bullish candles.
Technicals:
Price structure is bearish with Head and shoulders structure at top.
We are having bearish death cross on Daily chart. Last day daily candle present rejection of 3300 level. Lower chart show multiple rejections near 3300 level.
In such a case I see price testing 3250 & When price breaks it 3200 on horizon.
As of current 100 DMA is defending the Bulls at 3270.
Chart says the rest. Good Luck !

USDJPY Analysis : Key Reversal Zone After Parabolic Rally🧠 Market Psychology & Structure
The USDJPY 4-hour chart reveals a classic parabolic curve pattern signifying an acceleration phase in bullish momentum. This phase typically occurs during the final stages of a bullish move, where price action becomes increasingly steep due to aggressive buyer participation.
The rounded curve drawn on the chart reflects momentum compression—where pullbacks become shallower, and higher highs are formed rapidly. However, this pattern often ends in a blow-off top or a sharp correction, especially when approaching key supply zones.
🧩 Key Technical Highlights
Major Break Zone: The previous resistance around 148.80–149.00 (now flipped to support) was clearly broken with strong bullish candles, confirming trend continuation.
Break Out Demand : Price retested the breakout zone (around 149.80–150.00) before launching higher, validating this level as a new demand zone.
Current Price Action: The pair is currently hovering around 150.50 after a powerful rally, showing early signs of exhaustion with smaller bullish candles and slight upper wicks.
🔍 Target Area – Next Reversal Zone (151.80–152.30)
The green highlighted zone marks a strong supply area / reversal zone, identified from:
Previous price rejections in historical data.
Overbought conditions due to vertical rally.
Completion of the parabolic structure (climax zone).
We can expect price to reach this zone in the coming sessions, where it may:
Face strong selling pressure.
Trigger short positions from institutional sellers.
Lead to distribution or reversal back toward the demand area near 150.00.
🔄 Forecast & Trade Plan
Scenario 1 (High Probability): Price taps into 151.80–152.30, forms bearish engulfing or rejection wick, then pulls back to 150.00 or lower.
Scenario 2 (Invalidation): Strong breakout above 152.30 with momentum—bullish continuation towards 153.00+ possible.
🧠 Trader’s Mindset (MMC Insight)
This chart suggests a matured bullish trend nearing exhaustion. As smart traders, we anticipate rather than react. Wait for the price to reach the supply zone, then observe for confirmation (bearish structure, divergence, candlestick pattern) before shorting.
Avoid chasing longs at these highs—risk-to-reward is no longer favorable. Patience will offer a much cleaner entry if the reversal unfolds as expected.

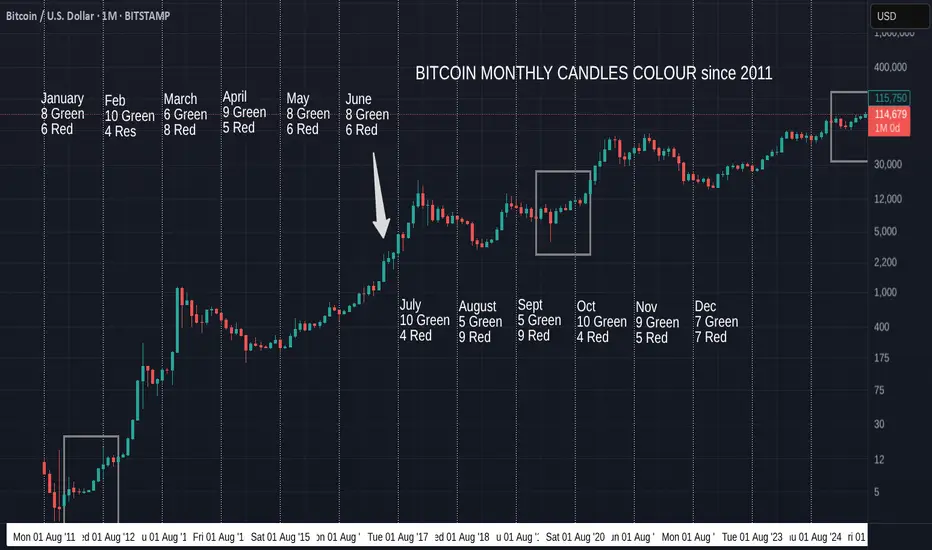
Bitcoin Monthly Candle Colour patterns and Colours since 2011
We got the expected GREEN July and so, amazingly, we continue to repeat the pattern from January to July 2012. ( Left Box )
It is almost the same pattern as 2020, apart from the Red May candle in that Year. (Right box)
The Large Arrow points towards another occasion where we had a series of consecutive Green candles from March to July, though these candles sizes are nothing like the ones we are currently experiencing.
The Boxes show us The only 2 occasions where we have had a Green December, Red January, Red February, Green March, Green April.
Then we had a Green May 2012 and a Red May 2020
Then both repeated a Green June, Green July.
The thing to note here is how all these are en-route to Cycle Highs.
So, August count currently is 5 Green to 9 Red, so the Odds are, while looking at BTC History, that we will get a RED August
HOWEVER, if we continue this run of following previous patterns, we will see a GREEN August.
In fact, 3 of those 5 Green August closes were in these 3 patterns mentioned.
Every single one of the 5 Green previous August followed a Green July, the last time was in 2021.
As mentioned in last months report, the size of the candles currently in this pattern are more like those in 2020 than the other 2 patterns talked about here.
With this in mind, we may expect a smaller Green candle close for August , Followed by a small Red candle in September. This did also happen in 2017 ( Arrow).
This August has opened Red but so far this year, many month opens were red and then changed.
So, My expectation id for a small Green August as markets cool off over the holidays and we wait for the start of Q4 in October.
We will have to wait and see as ever
Stay safe
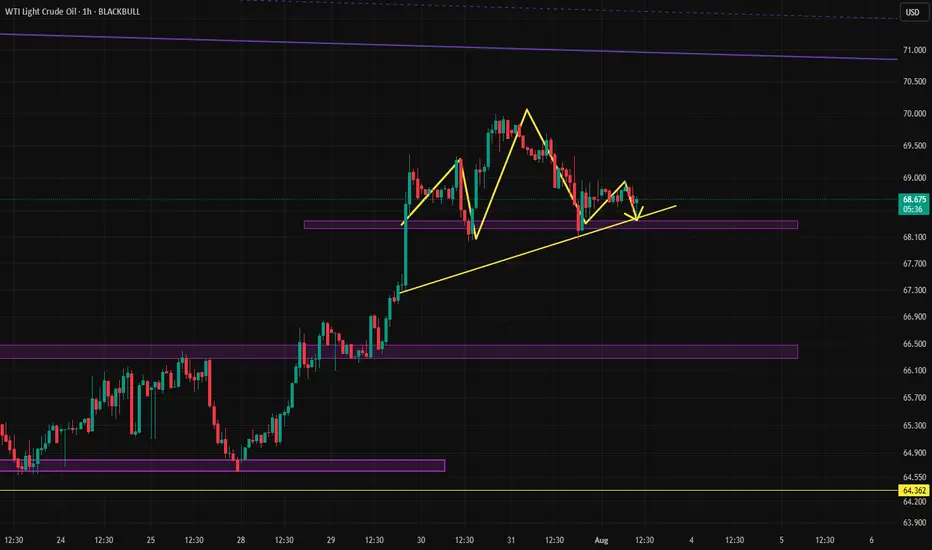
Activation of the head and shoulders pattern?Oil has formed a clean head and shoulders pattern, which, if activated, could lead the price to drop to 67.125. However, if the pattern fails and turns out to be a fakeout, we can expect the price to rise toward the \$71 area.