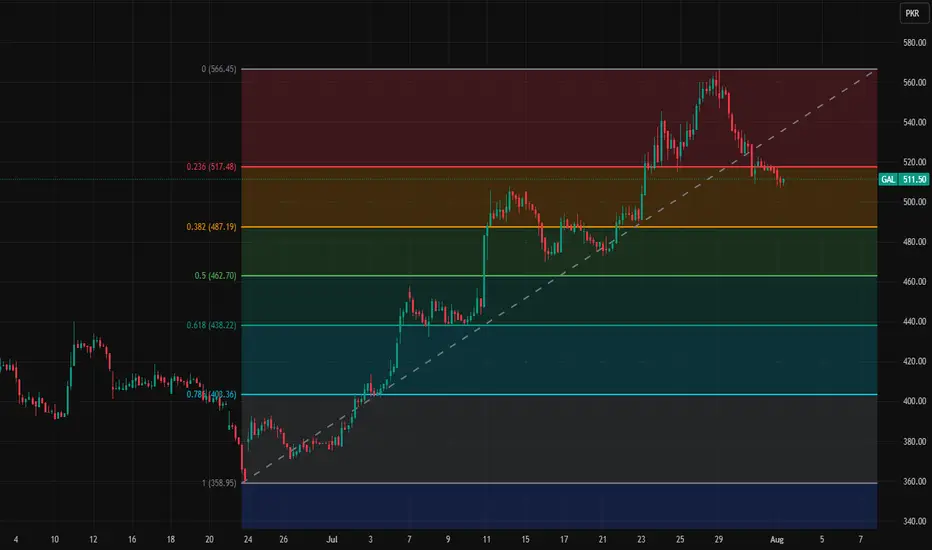
GAL short term key levelsThese are short term key levels on 1h
chart
566.45
517.48
487.19
462.7
438.22
403.36
358.95
Chart Patterns
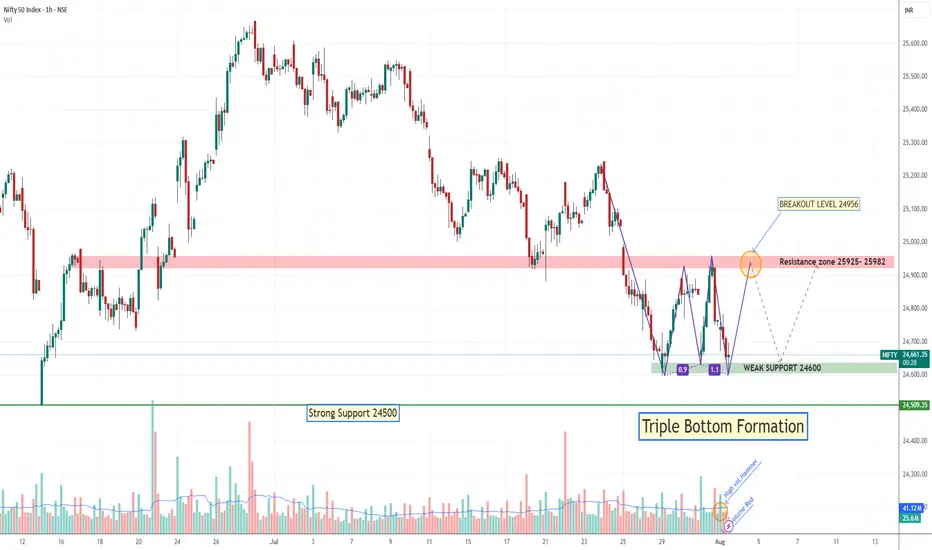
Tripple Bottom Formation if Hold 24600Nifty 3rd Time Tested 24600 level if it Break next Strong support 24500, if hold then may rallied again till 24956. May be Falling red candle is just testing candle of High-volume Hammer.

Ethereum (ETH/USD) Technical InsightsEthereum (ETH/USD) Technical Insights
**Chart Overview**
* **Current Price**: \~\$3,631
* **EMA 7 (Red Line)**: \$3,720.80
* **EMA 21 (Blue Line)**: \$3,522.96
* **Key Support Zone (Pink area)**: \~\$3,600–\$3,650
* **Support 1 (S1)**: \~\$2,950
* **Support 2 (S2)**: \~\$2,500
* **Uptrend Line**: Still intact, but under pressure
**Technical Insights**
* **Price Breakdown**: ETH has dropped below the **EMA 7**, and is now testing a **critical horizontal support zone** around **\$3,600–\$3,650**.
* **Trendline**: Still holds, but ETH is **hovering just above it**, signaling a potential bounce or breakdown.
* **EMA 21** near \$3,522 is the next short-term support if \$3,600 fails.
* **Momentum**: Recent candles show **strong selling**, indicating weakness, but no full breakdown yet.
**Bullish Scenario**
*Conditions**:
* Price **holds above** \$3,600–\$3,620 zone and the **trendline**
* **Bounce** with bullish daily candle from current zone or above \$3,650
**Buy Setup**:
* **Entry**: \$3,620–\$3,650 on confirmation
* **Stop-loss**: Below \$3,520 (just under EMA 21)
* **Targets**:
* TP1: \$3,720 (reclaim EMA 7)
* TP2: \$3,850–\$3,940
* TP3: \$4,100+
**Bearish Scenario**
**Conditions**:
* Price **breaks below** \$3,600 and **the trendline**
* EMA 21 is lost with strong bearish candle
**Sell Setup**:
* **Entry**: Below \$3,580 on breakdown
* **Stop-loss**: Above \$3,650
* **Targets**:
* TP1: \$3,520 (EMA 21)
* TP2: \$2,950 (S1)
* TP3: \$2,500 (S2)
**Bias: Neutral with Bearish Lean**
* **Decision Zone**: ETH is at a key inflection point
* Wait for **confirmation**: bounce or breakdown before entering

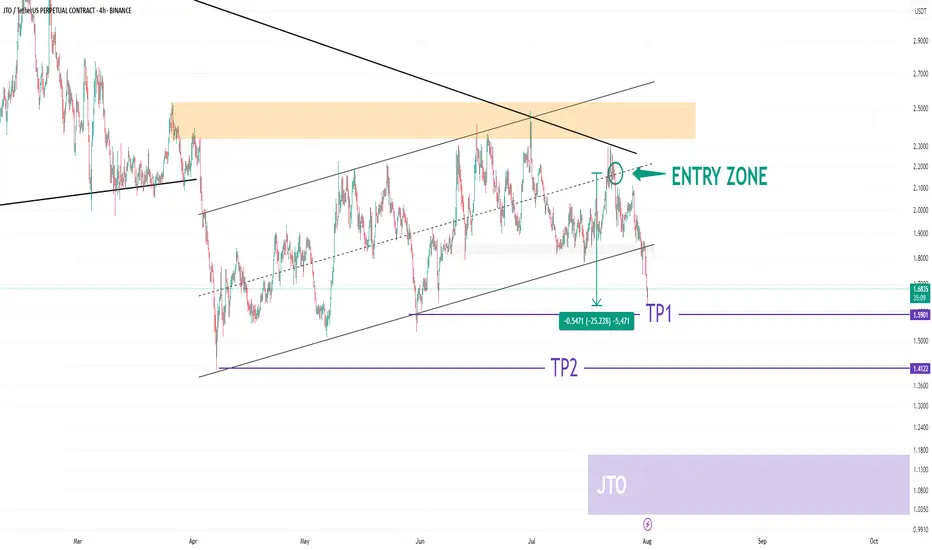
JTO USDT UpdateHELLO 😍
JTO Update
💁♂️ -25% 🔥
I shared this analysis when it was in the entry section. It would be nice to have an update of this analysis.
The JTO cryptocurrency has corrected 25% since the entry zone.
We saw a very good analysis together. What do you think? 😊💖
You can save some profit from the position in this area. 🐱
Please don't forget to like, share, and boost so that I can analyze it for you with more enthusiasm. Thank you. 💖😍
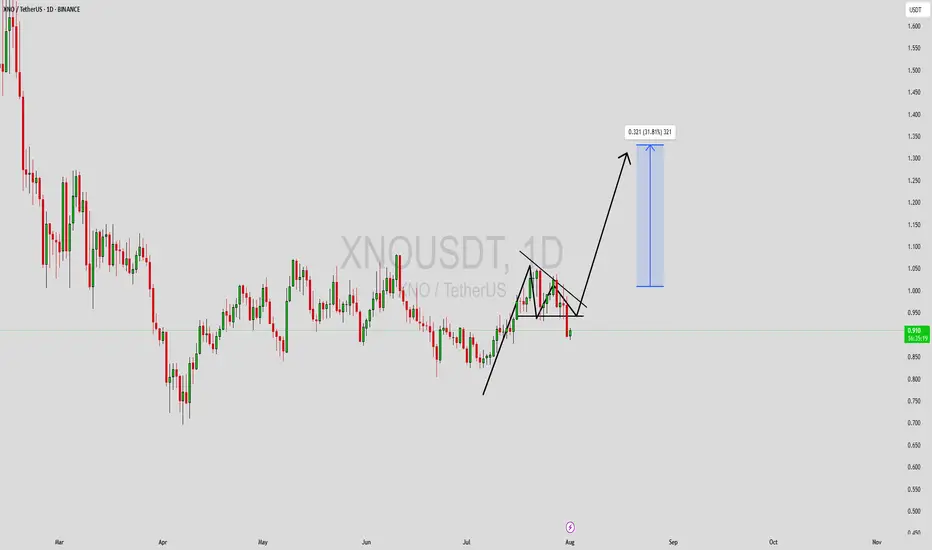
XNOUSDT Forming Bullish PennantXNOUSDT is currently displaying a bullish pennant pattern on the charts, which typically signals a continuation of the prior upward trend after a brief consolidation. This formation is marked by converging trendlines and reduced volatility, often setting the stage for a sharp breakout to the upside. With bullish momentum already in place, traders are closely monitoring this setup for confirmation of the next leg up.
The trading volume remains supportive, maintaining a steady flow that could power a breakout beyond the pennant resistance line. A breakout with a strong volume spike would indicate renewed buying pressure, which could push prices up by 20% to 30% or more. This makes XNO an attractive short-term opportunity for technical traders looking to capitalize on momentum-driven setups.
Investor interest around XNO has been gaining traction, especially as smaller altcoins with solid patterns begin to outperform during market recoveries. The bullish pennant adds to the credibility of this setup, especially in combination with favorable sentiment and increased watchlist mentions across trading communities.
Given the structure and volume dynamics in play, XNOUSDT is positioned for a potential bullish surge if key resistance levels are breached. This pattern, combined with current market conditions, could offer a favorable risk-reward ratio for traders watching for breakout confirmation.
✅ Show your support by hitting the like button and
✅ Leaving a comment below! (What is You opinion about this Coin)
Your feedback and engagement keep me inspired to share more insightful market analysis with you!
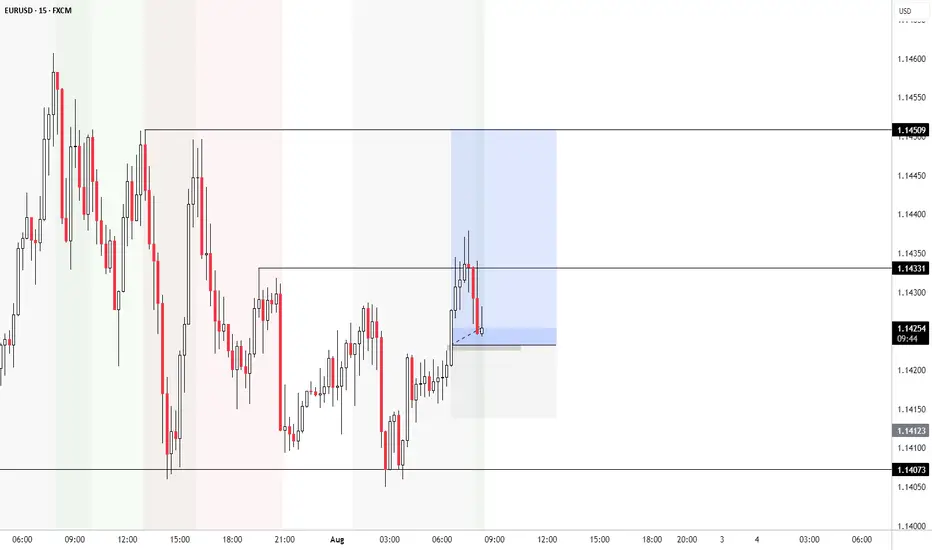
EU LONGCurrently monitoring EUR/USD for potential long opportunities. I’m looking for signs of bullish momentum supported by structure, liquidity sweeps, and alignment with DXY weakness. Waiting for a clean entry confirmation within a key demand or liquidity zone.
gold ranginggold has been raging between 3260-3310
probably gonna be a sideways before confirming directions.

GNSUSDT Forming Bullish ContinuationGNSUSDT is exhibiting a bullish continuation pattern, suggesting that the existing uptrend is poised to extend further. This technical formation often signals market strength and the likelihood of higher highs after a brief consolidation phase. With current price action forming higher lows and tightening within a structure that favors breakout potential, traders are closely watching for a decisive move upward.
The trading volume remains consistently strong, a key confirmation that the breakout, once it occurs, could be supported by sustained market interest. GNS has also demonstrated resilience against broader market fluctuations, which speaks to underlying investor confidence. As long as price remains above the identified support levels and continues to respect trendline structures, a move toward the 60% to 70% gain target appears realistic in the coming weeks.
Investor sentiment around GNS is increasingly positive, with growing social media chatter and technical analysts pointing out the potential for mid-cap altcoins to outperform. The bullish continuation pattern only adds weight to this optimism, particularly if upcoming candles close above the breakout zone on strong volume. This scenario often acts as a catalyst for rapid price movement.
With its solid fundamentals, strong volume profile, and a favorable chart structure, GNSUSDT is well-positioned for bullish continuation. Traders looking for trending assets with potential for solid upside returns should keep this crypto pair on their radar.
✅ Show your support by hitting the like button and
✅ Leaving a comment below! (What is You opinion about this Coin)
Your feedback and engagement keep me inspired to share more insightful market analysis with you!

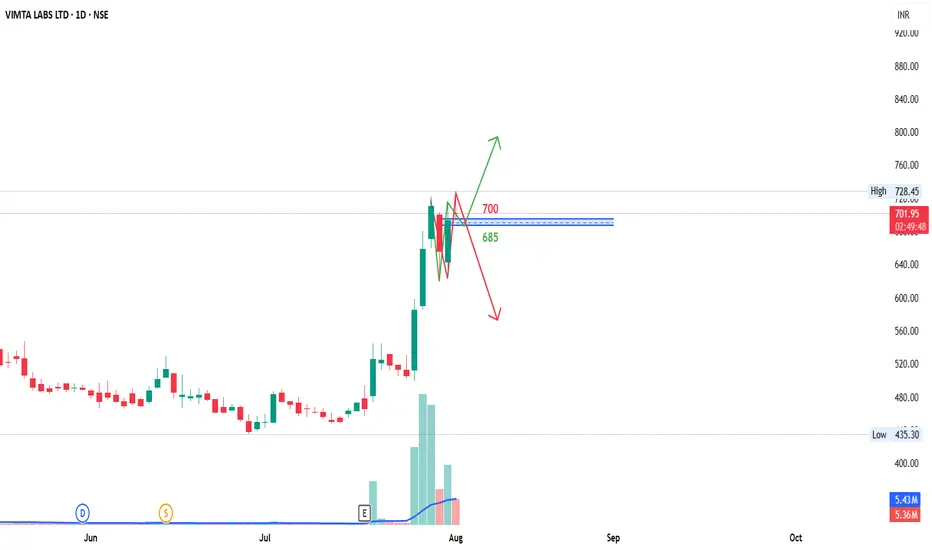
VIMTALABS, 1D, LONG and SHORTVimta Labs if sustains 700 and then it may give an up move of 30-40 points. If it breaks 685 then it may go downwards.
For Bullish Momentum
Entry: 700
Target: 730-740
SL: 685
For Bearish Momentum
Entry: 685
Target: 655-645
SL: 700
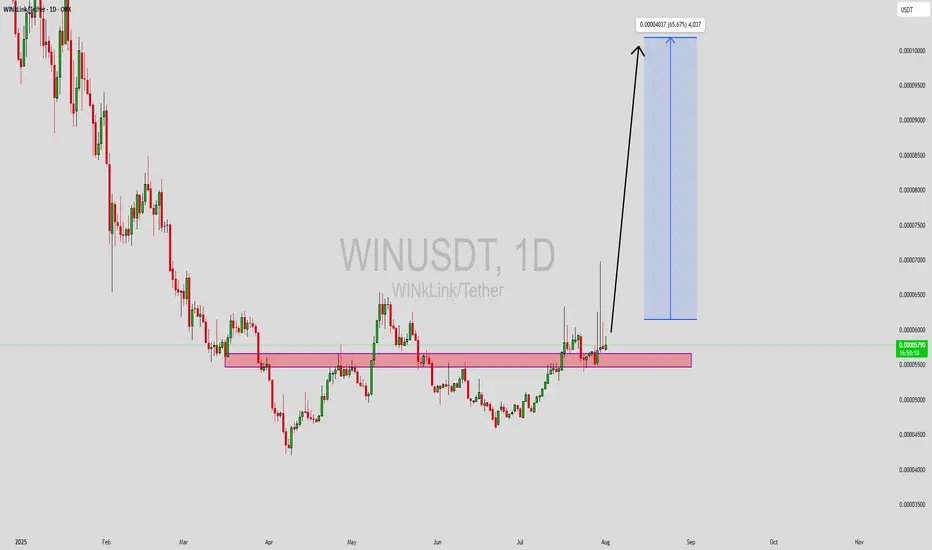
WINUSDT Forming Bullish ReversalWINUSDT is currently showcasing a classic bullish reversal pattern, indicating a potential shift from its recent downtrend toward an upward trajectory. This pattern is typically observed at market bottoms and often serves as a signal for a strong rebound. With solid volume support accompanying the recent candles, market participation is increasing—suggesting that smart money may be accumulating positions ahead of a major breakout.
Technically, WIN has tested and respected key support zones multiple times, strengthening the validity of this reversal formation. The price structure suggests growing momentum, and if it breaks above its immediate resistance level with a confirmed candle close, it could trigger a new bullish wave. Based on the pattern's breakout potential and measured move targets, a 50% to 60% price gain is reasonably anticipated in the short to mid-term.
Moreover, WIN is gaining attention across trading forums and crypto communities due to its low market cap and historical tendency to deliver sharp rallies once momentum shifts. This adds to its speculative appeal and could attract more volume and volatility in the days ahead. Traders seeking early entries into potentially explosive moves should keep a close eye on this coin.
Overall, WINUSDT presents a compelling technical case supported by strong demand zones and a classic bullish setup. If current levels hold and breakout confirmation arrives, the coin could offer lucrative returns for disciplined traders.
✅ Show your support by hitting the like button and
✅ Leaving a comment below! (What is You opinion about this Coin)
Your feedback and engagement keep me inspired to share more insightful market analysis with you!
Lockheed Martin (LMT) Stock in Strong Bullish TrendLockheed Martin (LMT) Stock in Strong Bullish Trend - Key Levels to Watch
Lockheed Martin's (LMT) stock is currently exhibiting a well-defined bullish trend, trading near a recent higher low that may serve as a crucial support level for the next upward move. The defense giant continues to benefit from robust global military spending and a strong contract pipeline, positioning the stock for potential further gains.
Technical Structure & Key Levels
- Higher Low Support: The current price zone represents a critical support area where buyers have previously stepped in, maintaining the upward trajectory
- Upside Targets:
- Near-term: $500 (previous resistance zone)
- Long-term: $610 (potential breakout extension)
- Major Support: $375 would act as strong demand zone if any deeper pullback occurs
Bullish Catalysts Supporting the Trend
1. Defense Sector Strength:
- Record US defense budget allocations for 2024-2025
- Increased NATO military spending amid global tensions
2. Contract Backlog:
- F-35 program continues to drive revenue
- Hypersonic weapons and space systems development
3. Technical Momentum:
- Price trading above key moving averages (50/200 DMA)
- Higher highs and higher lows confirm uptrend structure
Trading Strategy Considerations
- Optimal Entry:
- On bounces from current support level
- On breakout above $460 confirmation
- Risk Management:
- Stop-loss below $375 for longer-term positions
- Partial profit-taking near $490-500 resistance
- Confirmation Signals:
- Volume increase on upside moves
- Sustained closes above $460
Potential Risks to Monitor
- Geopolitical shifts affecting defense budgets
- Program delays (particularly in F-35 production)
- Broader market corrections impacting defense sector
Long-Term Outlook:
The combination of fundamental strength and technical positioning suggests LMT could progress toward 500 near-term, with $610 as a viable long-term target if the bullish structure holds. Traders should watch price action around current levels for continuation signals while remaining mindful of the $375 support as a critical level for the bullish thesis.

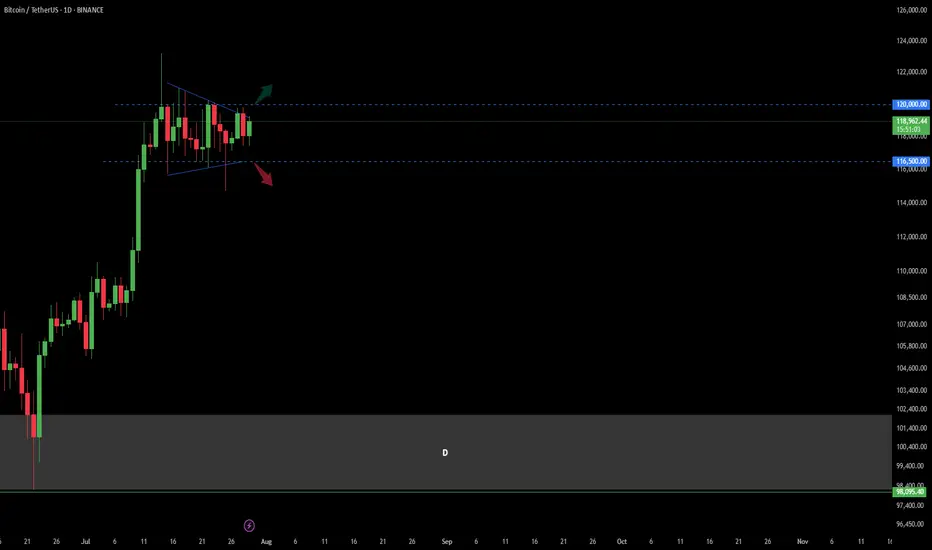
Bitcoin Trend Analaysis UP or DOWN?!Price capped in a wedge in Daily time frame.
There was a fake break from the bottom of this wedge last week and sharply got back to the top of it!
Now : break and confirm above 120 K in Daily would make the market BULLISH
break and confirm under 116.5 K in Daily would make the market BEARISH.
other wise market is still in a range mode...
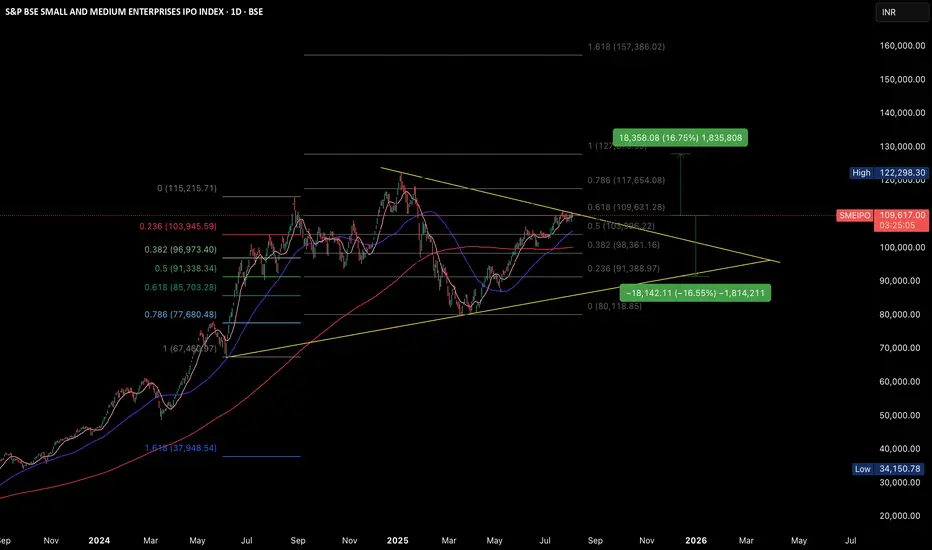
sme ipo make or break position ,be cautious
⸻
🔍 Chart Setup Overview
• Pattern: Symmetrical Triangle (consolidation zone — make-or-break pattern).
• Current Price: ₹109,635 (right at Fibonacci 0.618 level).
• Moving Averages: Clustered, indicating indecision.
• Key Levels (Fibonacci & Triangle) clearly suggest a breakout/breakdown zone.
⸻
📉 Downside Possibility (~60%)
📉 Upside Possibility (~40%)
Based on chart structure and current position near triangle resistance, downside has a higher probability unless a breakout happens soon.
✅ Targets:
1. 1st Downside Target: ₹91,388
• Corresponds to 0.236 Fibonacci level of the entire upmove.
• Drop of ~16.6% → ✔️ Your level is accurate.
2. 2nd Downside Target: ₹85,703
• 0.618 Retracement from the broader previous upmove.
• Drop of ~21.8% → ✔️ Your second target is also valid.
📌 Break below the triangle support would likely trigger both targets.
⸻
📈 Upside Possibility
If it breaks above the triangle resistance, the structure has good momentum potential:
✅ Upside Target:
• ₹127,873 (1.0 Fibonacci extension of previous top)
• Gain of ~16.7% → ✔️ Your upside target is correct.
🚩 But breakout must be confirmed with volume, else it’s a false breakout risk.
⸻
🔺 Conclusion: You are right.
• The risk-reward ratio slightly favors the downside unless there’s a convincing breakout.
• The 60% downside probability estimate is reasonable based on chart pattern, resistance levels, and trend weakening.
What The 3 Step Rocket Booster Strategy Is In Short SellingTrading is not easy at all.
But with practice you will get it.
These past few days have been horrible because
i was so stressed i nearly fainted away not only
my body but also my spirit.
Sleeping is your number one goal.
I dont care if you have money or not.YOU HAVE TO SLEEP.
Because of this personal sleeping campaign am
off coffee and tea.These beverages are high in caffeine.
Speaking of coffee this company NASDAQ:SBUX isn't
doing well in USA.
It looks like Gen- Z are not using coffee spots
to socailise. As a 4% decline in business
transactions was recorded.
Even-though in China this store has an
Increase of
about 6% Has been recorded
thanks to delivery options.
Gen Z Still wants to stay at home.They
dont want to go outside and mingle.
Either way look at this stock price.
The candle stick pattern looks like
the falling three soldiers.
This pattern has been favored by the MACD
crossover above the zero line
It has to be above the zero line because
It indicates that the price is in a selling season.
Another catalyst:
-Negative earnings report.
Also to put the hammer on the nail.
This price is following the rocket booster strategy
from the sell side.
SO what is the rocket booster strategy?
The price has to be below the 50 EMA
The price has to be below the 200 EMA
The price should gap down
Remember to place a limit sell stop order
@$88.34
below the lowest low of the day.
Market orders are too expensive in the long term.
Rocket boost this content to learn more.
Disclaimer:Trading is risky please learn
risk management and profit taking
strategies.Also use a simulation trading account
before before you trade with real money.
