Bitcoin Free Value Gaps getting filled - 109 K target >
If you look back at the last time I posted a chart with Free Value Gaps ( FVG ) you will see an orange bar where PA currently sits...The reason it is no longer there is because it ogt "Filled"
It is much the sameidea as CME Gaps. Thay also get filled very often/
So, we can see 2 more FVG before 107K line and so, in the current market state and with the knowledge that in August, Markets often Dip, we may well see PA retreat to the Gap at 109K
What a superb buying oppertunity
End of post as I am enjoying an evening in the south of France, with wine and Fun..
What it stopping you ?
Chart Patterns

Meme Coin Liquidity Trap📣 Hey CandleCraft fam, remember this one?
We nailed the previous BONK long — while it didn’t tag the absolute top, it delivered us a clean, sharp profit right out of the gate. Now? The story has flipped. Meme energy is fading, funding flipped, and the structure’s screaming reversal. Let’s see how this short idea plays out. 🐶💨
The dog barked loud — BONK went full meme mode with a 203% pump… but now it’s giving off that “walk of shame” energy. 🐶 RSI tanked, funding flipped, and it’s bleeding liquidity. Who let the dogs out? Probably market makers.
🔥 TRADE SETUP
Bias: Short
Strategy: Meme Coin Liquidity Trap
Entry: $0.0000355 – $0.0000370
SL: $0.0000400
TPs: $0.000030, $0.000025, $0.000020
Why?
– Overextended meme coin pullback
– Funding rate negative = longs bleeding
– OI down 35%, RSI from 85 → sub-50
– Price hovering under 20-day EMA support
Candle Craft | Signal. Structure. Execution.

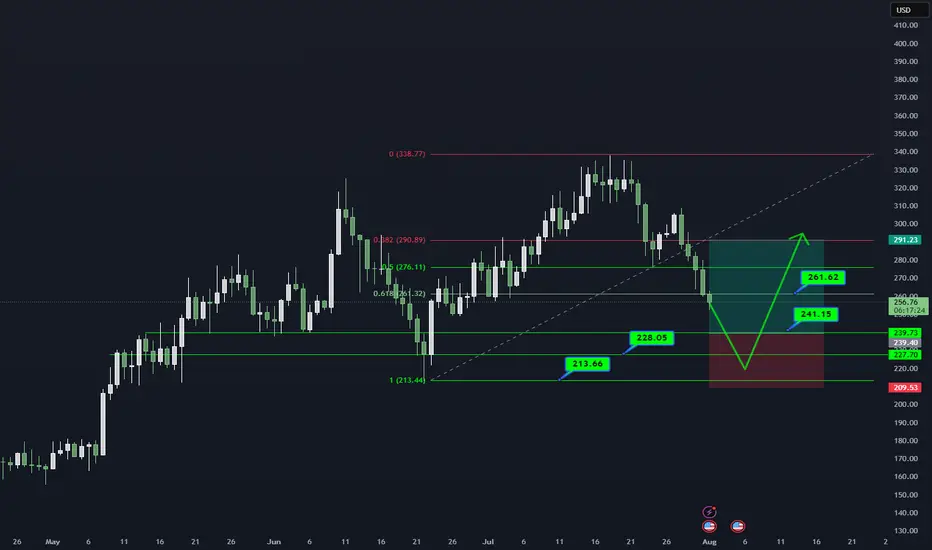
AAVE/USDT DAILY OUTLOOK📊 AAVE/USDT – DAILY TECHNICAL OUTLOOK
🔍 MARKET STRUCTURE
AAVE critical demand zone (241–228) par trade kar raha hai.
Higher timeframe trend bullish jab tak 213 strong base hold karta hai.
📌 KEY LEVELS TO WATCH
Support Zones: 241.15 → 228.05 → 213.66 (Major Base)
Resistance Zones: 261.62 → 291.23
Breakout Confirmation: Daily close above 261 could open path to 291.
🎯 TRADING PLAN (25% SCALING STRATEGY)
Entries ko 25% ke 4 parts me divide karein:
241.15
228.05
220–213 support range
Targets: 261.62 → 291.23
Stop Loss: Daily close below 213
⚠️ RISK MANAGEMENT NOTE
Spot trades safer. Leverage trading = technical gambling.
Capital preservation = long-term survival.
📖 QUOTE
"The big money is made by sitting, not trading." – Reminiscences of a Stock Operator
💬 WHAT’S YOUR VIEW ON AAVE?
Bullish bounce from demand zone or deeper retest ahead?
Share your thoughts in the comments!
#AAVE #CryptoTrading #Altcoins #TradingView #TechnicalAnalysis #CryptoCommunity #RiskManagement #SpotTrading
PUMP/USDT: Whales Buy the Dip as Price Holds Key LevelBINANCE:PUMPUSDT.P price has taken a steep 18% hit in the last 24 hours, but the 2-hour chart shows BINANCE:PUMPUSDT.P price action clinging to a critical Fibonacci support near $0.00259. The token is still trading inside an ascending channel, hinting that the bullish structure hasn’t fully broken yet.
Whales have been scooping up the dip aggressively, adding 5.4 billion PUMP tokens over the past week (a 35.8% jump in their holdings). Despite retail selling pushing netflows positive intraday, big wallets continue to absorb supply. Daily accumulation is also up 3.2% in the last 24 hours, reinforcing the demand floor near current levels.
Meanwhile, long positions dominate the liquidation setup, with $7.88 billion in longs versus just $3.6 billion in shorts. If BINANCE:PUMPUSDT.P price bounces, a cascade of short liquidations could amplify the recovery rally. But failure to defend $0.00259 risks opening the door to $0.00241, putting bulls on the back foot.
For now, the $0.00259–$0.00260 zone is the make-or-break level. Holding above keeps BINANCE:PUMPUSDT.P price inside the bullish channel, setting up a potential retest of $0.00284–$0.00294. A breakdown, however, could flip sentiment sharply bearish.

Bitcoin Bull Flag - will it collapse?Bitcoin is currently in a bull flag.
Will it hold — or collapse?
The weekly close will decide.
🔹 If BTC closes above the bull flag support: Possible continuation of the rally.
🔻 If BTC closes below the flag: Expect a deeper correction.
Stay sharp. The weekly close is key IMO.
No FA. DYOR! For educational purpose only.

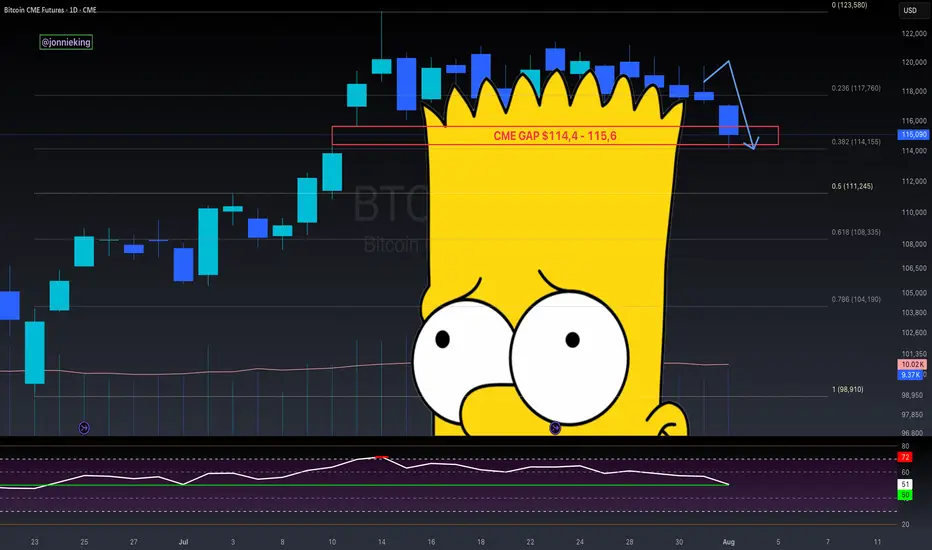
$BTC CME Gap + Bad Bart = Easiest Short EverCME Gap + Bad Bart is like taking candy from a baby 👨🏻🍼
Look at that textbook bounce off the .382 Fib 🤓
Pain ain’t over folks.
RSI still shows room on the downside 📉
Global Liquidity drain on the 4th.
Looking like the 50% Gann Level is next ~$111k
Get those bids in 😎
And never forget the BullTards who were telling you about the “Bollinger Band Squeeze” and UpOnly season 🫠

btc consolidation and downentire bull market has been big impulse move up then consolidation and slightly more down than would be expected with typical bull flag

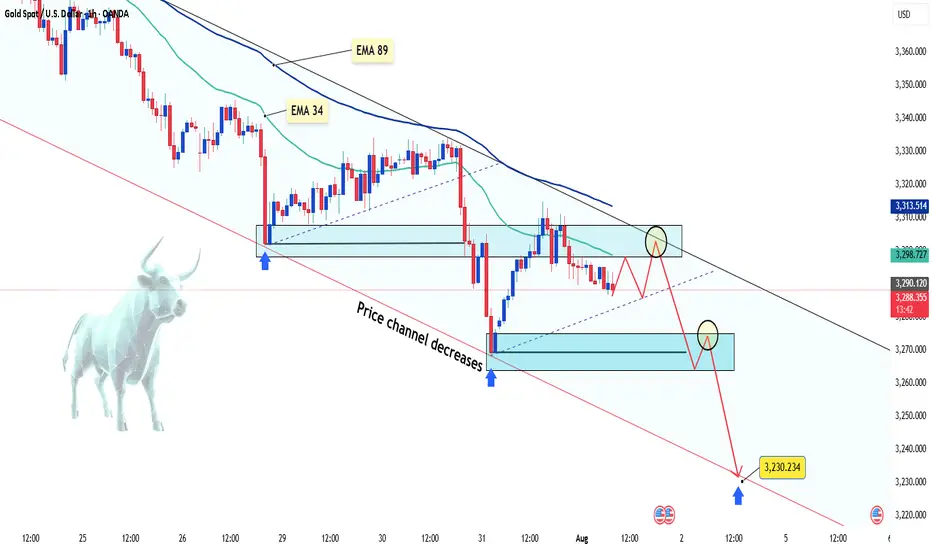
Gold keeps falling – is there more to come?Hello everyone, great to see you again!
Today, gold remains under pressure following a series of strong U.S. economic data releases, which have reinforced expectations that the Federal Reserve will keep interest rates elevated for longer. As a result, the U.S. dollar has strengthened, Treasury yields have climbed, and gold has lost its footing.
On the H1 chart, XAUUSD is clearly trading within a descending price channel. Both the EMA 34 and EMA 89 are acting as dynamic resistance zones. Recent attempts to rally have consistently failed at these levels, mirroring the bearish setup seen before July 29.
Currently, price is retesting a minor resistance area. If this retest fails, the next downside targets lie near 3,270 – and potentially down to 3,230 USD, which aligns with the lower boundary of the price channel.
From my perspective, the bearish momentum is likely to continue.
What about you? How do you think gold will close the day?
Gold Showing Signs of Reversal After Hitting Key ResistanceHello Guys.
Gold has reached a major resistance zone around 3439–3425, which has already acted as a strong ceiling in the past. The price tapped into this area again, forming a clear divergence, and failed to break higher.
Here’s what stands out:
Divergence signals a weakening bullish momentum at the top.
The price rejected the resistance and is now breaking structure to the downside.
A minor pullback may occur before continuation, as shown in the projected moves.
First target: 3259.792
Second target (if support breaks): 3136.869, a deeper zone for potential bounce or further drop.
This setup hints at a bearish trend building up. Stay cautious on longs unless the price structure changes again.

USDCAD - Bullish Triple BottomHello Traders !
The USDCAD price formed a triple bottom pattern.
Currently, The neckline is broken!
So, I expect a bullish move🚀
________________
TARGET: 1.39530🎯

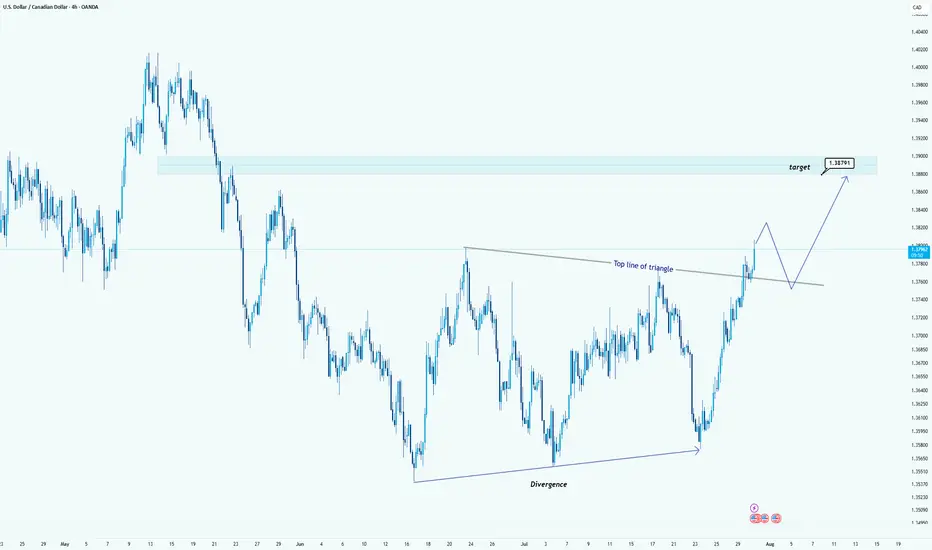
USD/CAD Breaks Triangle: Bullish Target in SightHello guys!
USD/CAD has broken out of a clear triangle formation, signaling strong bullish momentum. The breakout above the top line of the triangle, supported by earlier bullish divergence, confirms that buyers are now in control.
Triangle breakout confirmed
Strong bullish impulse post-breakout
Retest of the broken trendline expected
Target: 1.38791
A clean retest of the breakout level could provide another entry opportunity before price reaches the target zone highlighted in blue.
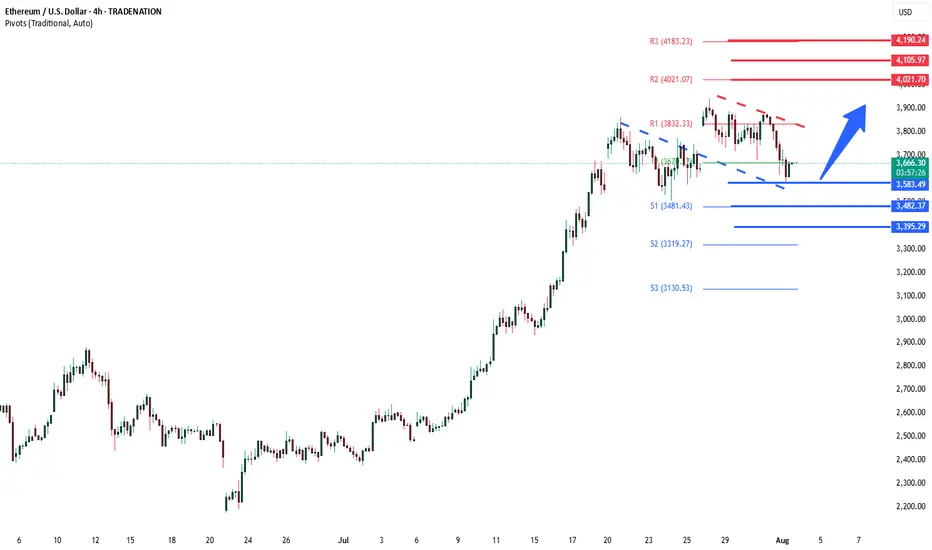
ETHUSD previous resistance new support The ETHSD remains in a bullish trend, with recent price action showing signs of a corrective pullback within the broader uptrend.
Support Zone: 3,667 – a key level from previous consolidation. Price is currently testing or approaching this level.
A bullish rebound from 3,667 would confirm ongoing upside momentum, with potential targets at:
4,020 – initial resistance
4,105 – psychological and structural level
4,190 – extended resistance on the longer-term chart
Bearish Scenario:
A confirmed break and daily close below 3,667 would weaken the bullish outlook and suggest deeper downside risk toward:
3,584 – minor support
3,482 – stronger support and potential demand zone
Outlook:
Bullish bias remains intact while the ETHUSD holds above 3,667. A sustained break below this level could shift momentum to the downside in the short term.
This communication is for informational purposes only and should not be viewed as any form of recommendation as to a particular course of action or as investment advice. It is not intended as an offer or solicitation for the purchase or sale of any financial instrument or as an official confirmation of any transaction. Opinions, estimates and assumptions expressed herein are made as of the date of this communication and are subject to change without notice. This communication has been prepared based upon information, including market prices, data and other information, believed to be reliable; however, Trade Nation does not warrant its completeness or accuracy. All market prices and market data contained in or attached to this communication are indicative and subject to change without notice.
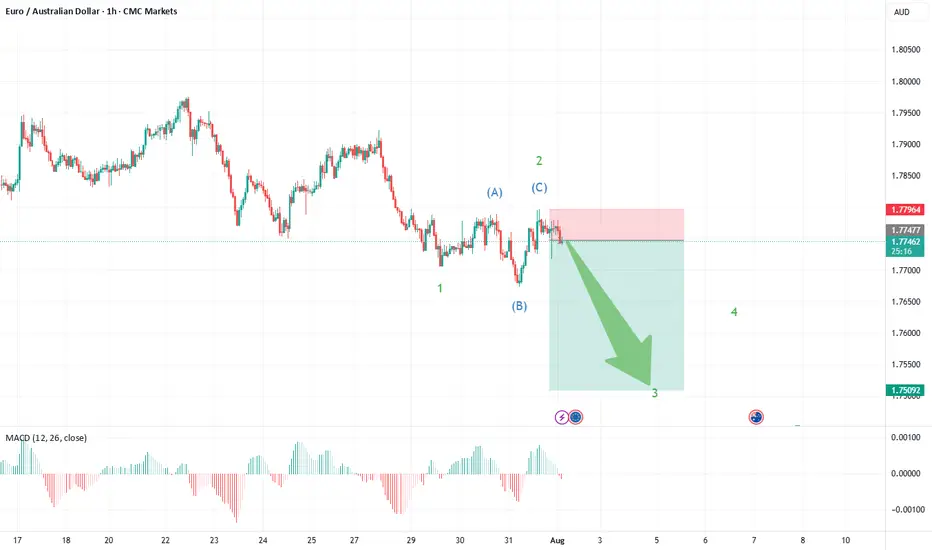
EUR/AUD: Short Setup Forming—Is the Downside Just Beginning?EUR/AUD is flashing the early signs of a new short trading opportunity, with the latest chart pointing toward a fresh move lower as the corrective phase may be wrapping up.
What the Current Structure Shows (Primary Scenario)
Corrective Pattern Complete: The strong advance off the May 14th, 2025 lows at 1.7247 unfolded as a classic double zigzag (WXY), culminating at recent highs. Price action has since reversed and formed an initial impulse down—clear evidence that the correction may be over.
Wave 1 Down, Expanded Flat for Wave 2: The chart now displays a completed wave 1 on the downside, followed by an expanded flat for wave 2—where price retraced upward but failed to break the previous peak, a sign of fading bullish momentum.
The recent structure shows a sharp, impulsive move down (wave 1), fitting Elliott Wave expectations for a new trend immediately after a complex correction.
The expanded flat for wave 2—where the B wave exceeded the start of A and C pushed higher—typically heralds a strong, extended wave 3. This supports a bearish outlook from current levels.
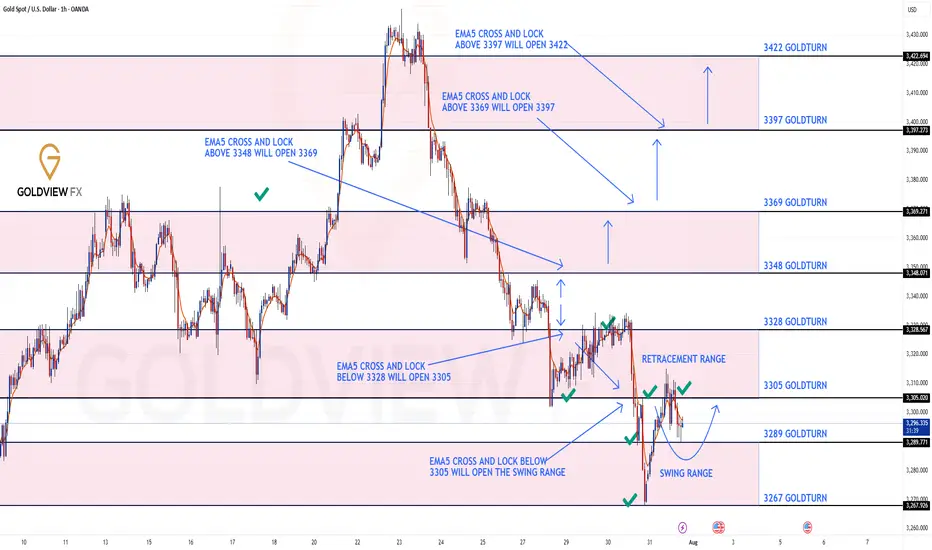
GOLD ROUTE MAP UPDATEHey Everyone,
Quick follow up on our 1H chart route map:
What can I say.....pure perfection on our chart analysis as everything played out exactly as expected.
Yesterday, we identified the first level of the swing range at 3289, which delivered a clean full swing into 3305.
Today, we hit Level 2 of the swing range at 3267, and once again, it played out flawlessly with another full swing up to 3305.
A perfect finish to the day. Great work all around!
We are now looking for support above the swing range and a break above 3305 to track the movement up or further retest and break below the 1st level of the swing range may open the the 2nd level at 3267 again.
We will keep the above in mind when taking buys from dips. Our updated levels and weighted levels will allow us to track the movement down and then catch bounces up.
We will continue to buy dips using our support levels taking 20 to 40 pips. As stated before each of our level structures give 20 to 40 pip bounces, which is enough for a nice entry and exit. If you back test the levels we shared every week for the past 24 months, you can see how effectively they were used to trade with or against short/mid term swings and trends.
The swing range give bigger bounces then our weighted levels that's the difference between weighted levels and swing ranges.
BULLISH TARGET
3348
EMA5 CROSS AND LOCK ABOVE 3348 WILL OPEN THE FOLLOWING BULLISH TARGETS
3369
EMA5 CROSS AND LOCK ABOVE 3369 WILL OPEN THE FOLLOWING BULLISH TARGET
3397
EMA5 CROSS AND LOCK ABOVE 3397 WILL OPEN THE FOLLOWING BULLISH TARGET
3422
BEARISH TARGETS
3328 - DONE
EMA5 CROSS AND LOCK BELOW 3328 WILL OPEN THE FOLLOWING BEARISH TARGET
3305 - DONE
EMA5 CROSS AND LOCK BELOW 3305 WILL OPEN THE SWING RANGE
3289 - DONE
3267 - DONE
As always, we will keep you all updated with regular updates throughout the week and how we manage the active ideas and setups. Thank you all for your likes, comments and follows, we really appreciate it!
Mr Gold
GoldViewFX
DeGRAM | USDJPY fixed above the descending channel📊 Technical Analysis
● Dollar-yen has punched through the 16-month descending channel top and twice retested it as support (false-break tags), carving a rising trend line that now guides price away from 144.90.
● Inside the break zone a smaller pennant is forming; a 4 h close above 147.18 completes the pattern and activates the channel-height target at 150.80 near the November swing cap.
💡 Fundamental Analysis
● US 2-yr yields pushed to a three-month high after hotter CPI core-services and Barkin’s “inflation progress has stalled”, while the BoJ July minutes flagged only “gradual” QT—widening the policy gap and reviving carry demand for yen shorts.
✨ Summary
Long 145.2-146.2; pennant break >147.18 targets 150.80. Bias void on a 4 h close below 142.80.
-------------------
Share your opinion in the comments and support the idea with like. Thanks for your support!

Bullish Channel Intact: BTC Poised for Next Leg Toward 152KBitcoin continues to coil within a bullish consolidation zone above the critical $114.5k–$117.5k Immediate Demand Zone, firmly riding the ascending channel structure that has guided price since the March swing low. The prior wave structure confirms a clean ABC correction, followed by a powerful breakout and a structured range indicative of accumulation, not exhaustion.
The RSI shows persistent bullish divergence, confirming hidden strength, with multiple support bounces confirming demand. The current tight consolidation above former resistance now flipped demand presents a launchpad scenario for a breakout towards major projected upside targets.
Targets to Watch:
🟢 $123,053 – Range breakout threshold, aligns with channel midline and prior local high.
🟢 $134,428 – Measured move from current range and top channel boundary intersection.
🟢 $152,174 – Final leg projection based on macro channel trajectory and bullish wave extension potential.
On the downside, failure to hold $114.5k opens the door to a test of the $105k Strong Support Zone, which aligns with prior structural demand and broader trendline confluence.
💬 Drop your favorite altcoins in the comments for quick analysis , let's catch the next movers before they fly!

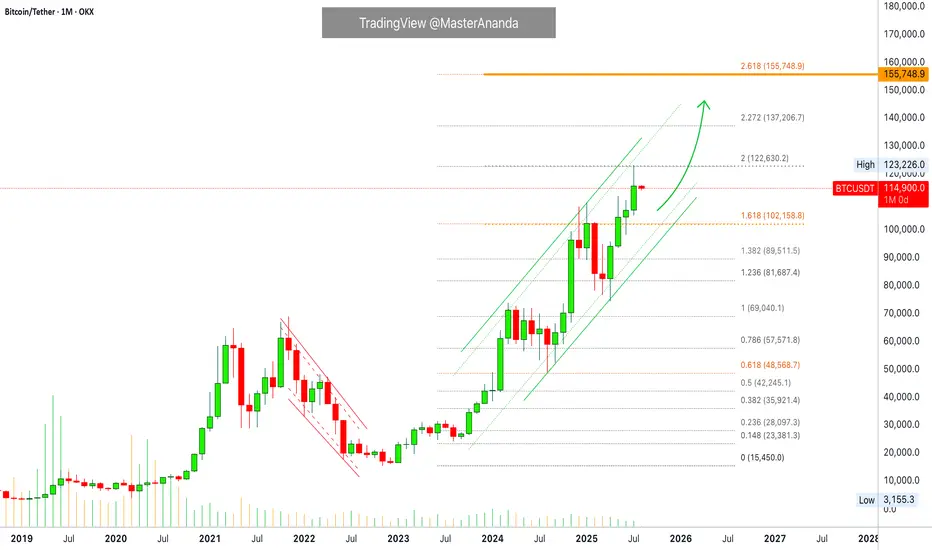
Bitcoin Monthly · Parabolic Rise ContinuesLast month Bitcoin produced its best numbers ever. The highest wick and close, a new all-time high at $123,226.
Bitcoin is not exhausted on the monthly timeframe but there is room for a retrace before the month ends. Think of the first part of the month being mixed, neutral or even bearish while the second half becomes full time bullish.
The levels that are relevant are $122,000 on the bullish side and $102,000 on the low. Right now the action is happening close to the middle so anything goes.
In 2020 Bitcoin produced 7 monthly candles growing and this was repeated again in 2023. In 2025 we have so far four green candles which means that Bitcoin can easily continue to grow. It has been known to produce more than four months green many times but there can be exhaustion at some point.
Bitcoin has been moving within a strong uptrend and is likely to continue rising. Bullish until the chart says otherwise. We are going up. Short-, mid- and long-term.
As Bitcoin consolidates near resistance, the altcoins will continue to build strength in order to grow. Remember, we are still looking at bottom prices across thousands of altcoins. Only a few moved ahead and are trading at all-time highs, the rest will catch up. The time is now, late 2025. The best is yet to come.
Namaste.
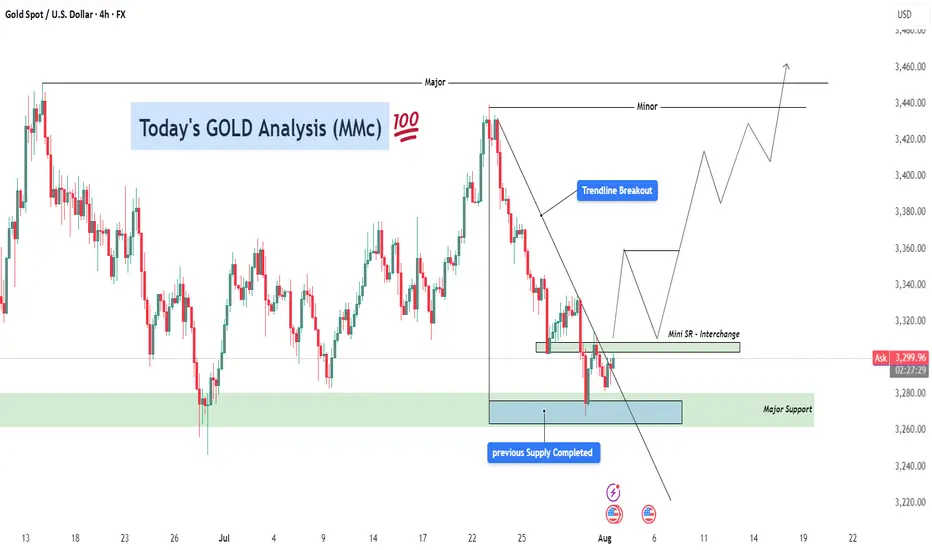
GOLD Analysis – Bullish Recovery Setup After Trendline Breakout ⚙️ Technical Structure Overview
This 4-hour chart of Gold (XAUUSD) illustrates a classic reversal setup developing after a significant correction. Price previously faced strong selling pressure from the 3,470+ zone and declined sharply. However, the recent price action suggests a shift in control from sellers to buyers, signaling a likely medium-term trend reversal or a bullish wave formation.
The key to this setup lies in three confluences:
Completion of a previous supply zone, which no longer holds influence.
Aggressive buyer activity from a major support zone.
A clean break above the descending trendline, which is a common signal that bearish momentum is losing strength.
🔑 Key Levels & Concepts Explained
🟢 1. Major Support Zone (3,260–3,280)
This zone has been tested multiple times and each time, buyers stepped in and prevented further downside. The most recent rejection from this area shows long wicks and bullish engulfing candles, indicating accumulation by institutional players. This is the foundational support that has held the entire corrective structure.
📉 2. Trendline Breakout
The descending trendline connecting swing highs has now been broken to the upside. This is a critical technical signal, especially on the 4H timeframe, as it suggests a potential trend reversal or at least a deep retracement in the opposite direction.
Trendline breakouts typically result in a retest of the trendline or a nearby support-turned-resistance zone (as is the case here with the Mini SR level).
It also implies that supply is weakening, and buyers are ready to push.
🧱 3. Mini Support/Resistance Interchange (~3,300–3,320)
This zone now plays the role of an interchange level—a previous minor resistance that could act as a support after the breakout. This level is crucial for intraday and swing traders because it can offer a low-risk long entry if price retests and confirms it with bullish momentum.
The chart projection suggests a bounce off this mini S/R, followed by successive higher highs and higher lows, forming a new bullish structure.
📈 Forecast Path & Trade Scenario
✅ Bullish Path (Preferred MMC Scenario)
Stage 1: Price retests the 3,300–3,320 zone (Mini S/R).
Stage 2: Buyers step in, leading to a bullish continuation.
Stage 3: Price targets the Minor Resistance (~3,440).
Stage 4: If momentum is sustained, it aims for Major Resistance (~3,470–3,480), completing a clean reversal formation.
This path reflects perfect bullish market structure—a breakout, followed by a retest and rally.
❌ Bearish Invalidation
If the price closes strongly below 3,260, the structure would be invalidated.
This would suggest that the support zone failed, possibly triggering deeper downside toward 3,220–3,200.
🧠 MMC Trader Mindset & Risk Considerations
Don’t Chase: Wait for a confirmed retest of the Mini S/R zone. Let the market come to your entry.
Entry Confirmation: Use candlestick signals like bullish engulfing, pin bars, or inside bars near the Mini S/R.
Volume Consideration: Volume should ideally rise on breakout legs and decline on pullbacks—this confirms healthy bullish structure.
Risk-Reward: With a stop below 3,260 and targets toward 3,470, the RR ratio favors long entries, especially after confirmation.
🔁 Summary Plan for Execution
Entry Zone: 3,300–3,320 (after bullish confirmation)
Stop Loss: Below 3,260 (structure break)
Take Profit 1: 3,440
Take Profit 2: 3,470–3,480
Risk-to-Reward: 1:2+ if planned carefully
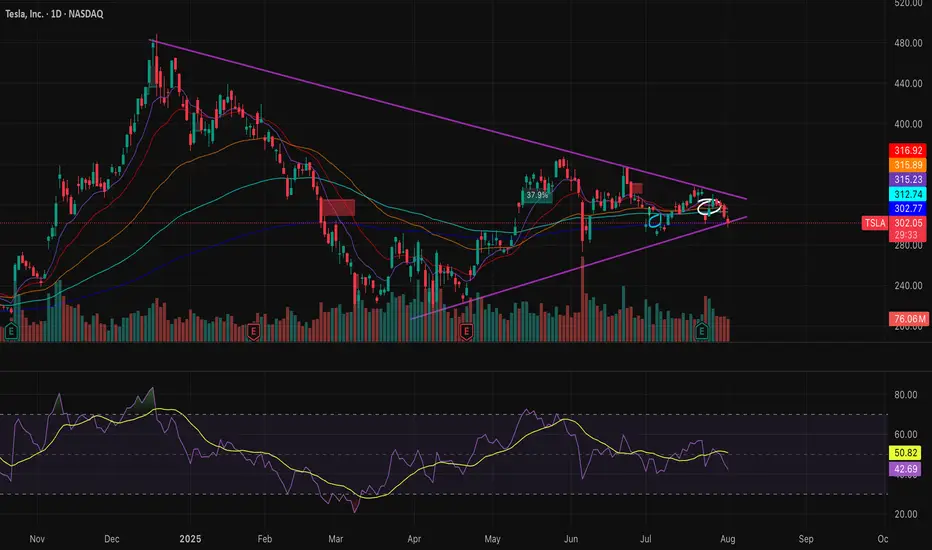
Make or Break point for TSLAlots of bulls and bears for TSLA. Wedging for a bit now. Filled the 296 gap and gap above, now its time to see if TSLA wants up or down. RSI MACD stabilized, volume thinned out, so whatever direction it chooses I think will be explosive. Plenty of Call and Put flow on both sides.
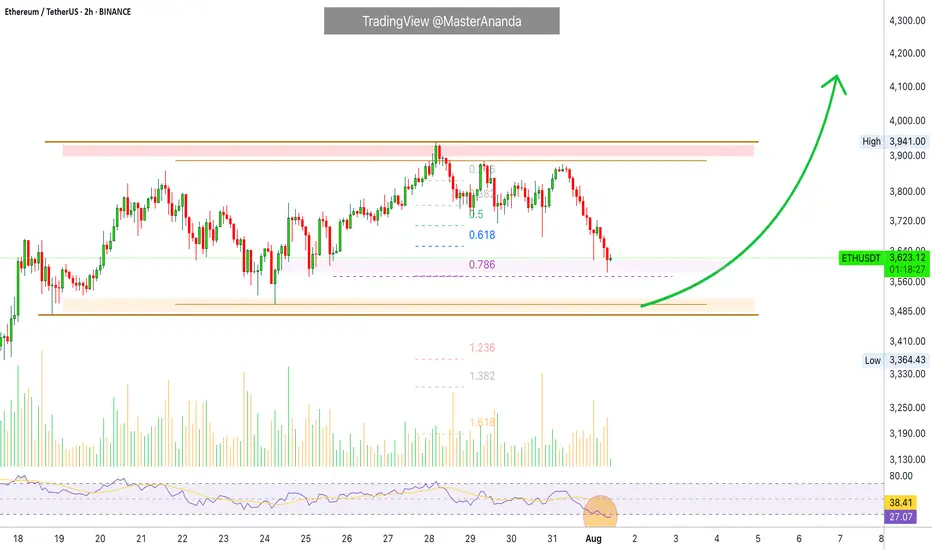
Ethereum Short-Term · Trading within Bullish RangeI am looking at Ethereum short-term using the same timeframe I used for Bitcoin, 2h. We have some interesting signals.
Here ETHUSDT is trading within higher lows. This is interesting because Bitcoin produced a lower low recently. The same volume signal is present here, ETHUSDT has been producing lower bearish volume since last month.
The RSI produced a lower low while ETHUSDT produced a higher low. This is called a hidden bullish divergence. Ethereum's bears did not only fail to take out the last low 24-July but also the previous one, and this clearly reveals bullish support.
The RSI being oversold is also a positive condition and can signal a reversal happening soon. Not truly a reversal because we are not in a downtrend, we are still witnessing a small pause after a strong rise; consolidation near resistance. A continuation reads better.
Ethereum's price continues really strong and the short-term signals are pointing to bullish action being favored in the coming days. We can wait easily and patiently because the best is yet to come. Never SHORT in a bull market, the market will surprise you with how fast things can turn. Better wait for support and go LONG.
Namaste.
Dot/usdtPolkadot (DOT) cryptocurrency is showing potential for growth from around the $3.40 level.
If the price moves upward, it could potentially reach $5.20, $8, and even $12.
This analysis remains valid as long as the support level at $3.10 holds and no lower low is formed.
Please note: This analysis involves risk. Make sure to apply proper risk management.

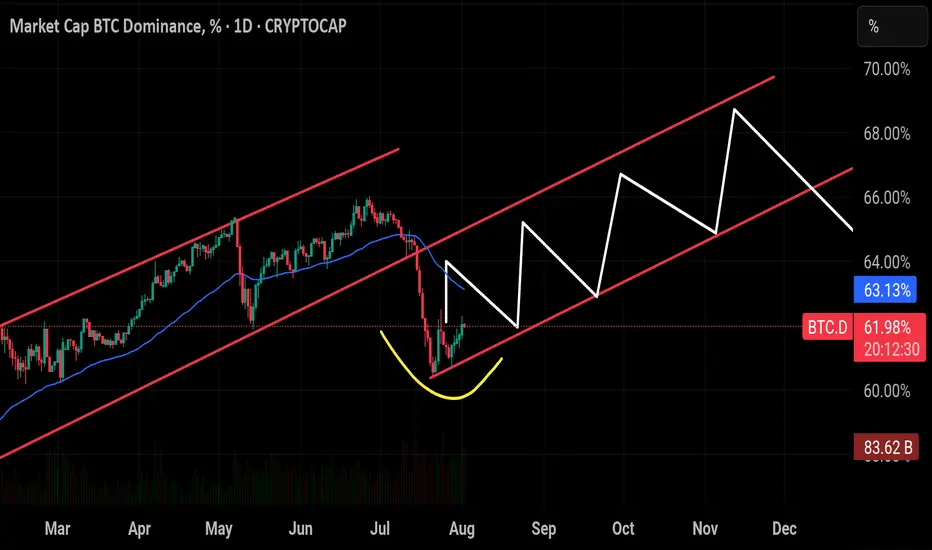
$BTC Dominance seems to be replaying its historical pattern —CRYPTOCAP:BTC Dominance seems to be replaying its historical pattern — after peaking around 66%, it’s now pulling back toward the critical 60% support zone. If the breaks below this level have triggered sharp drops toward 54%, often marking the start of strong altcoin seasons. Unless BTC.D closes back above 65%–66%, history suggests we could see another wave of altcoin outperformance in the weeks ahead. And looking at the chart structure, a breakout in BTC’s price action could align with this cycle, potentially driving Bitcoin toward a new all-time high soon.