Cardano (ADA): Seeing 1:10 Risk & Rewards Trading OpportunityCardano looks strong, still being above the major support area and showing the buy-side dominance on smaller timeframes. The key point here is the 200 EMA on the 1D timeframe!
More in-depth info is in the video—enjoy!
Swallow Academy
Chart Patterns

BITCOIN Will Go Lower! Sell!
Please, check our technical outlook for BITCOIN.
Time Frame: 9h
Current Trend: Bearish
Sentiment: Overbought (based on 7-period RSI)
Forecast: Bearish
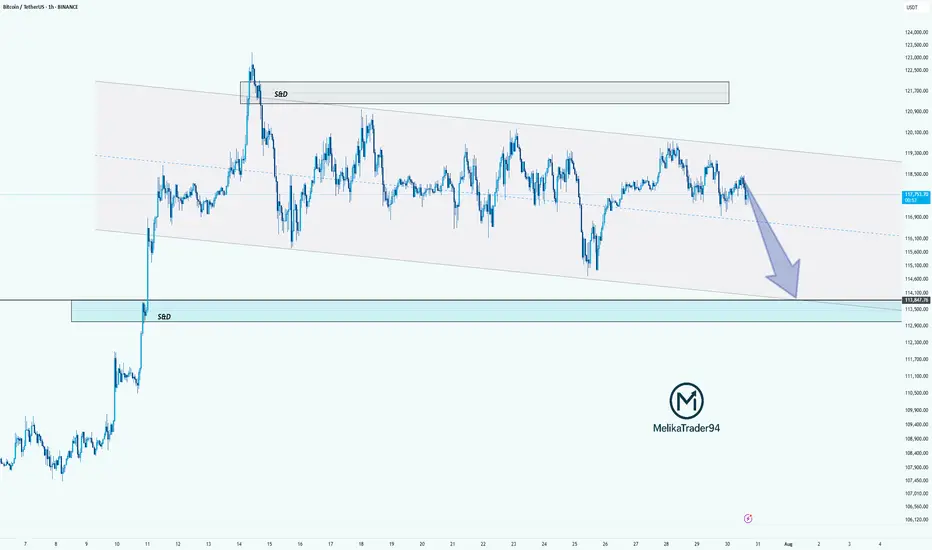
The market is trading around a solid horizontal structure 113,260.21.
The above observations make me that the market will inevitably achieve 107,826.27 level.
P.S
We determine oversold/overbought condition with RSI indicator.
When it drops below 30 - the market is considered to be oversold.
When it bounces above 70 - the market is considered to be overbought.
Disclosure: I am part of Trade Nation's Influencer program and receive a monthly fee for using their TradingView charts in my analysis.
Like and subscribe and comment my ideas if you enjoy them!

Will the Canada-US Trade Tension Continue to Impair CAD?Fundamental approach:
- USDCAD advanced this week, supported by broad US dollar strength and renewed trade tensions as the US announced higher tariffs on Canadian imports.
- The pair was further buoyed after the BoC left rates unchanged and signaled caution amid persistent core inflation and ongoing trade negotiations.
- Meanwhile, US labor data indicated that job openings were moderating growth while tariff-related uncertainty weighed on risk sentiment.
- The BoC’s decision to keep its policy rate at 2.75% cited domestic economic resilience and the unpredictable US trade policy outlook.
- At the same time, negotiations between Canada and the US over trade terms remained in an “intense” phase, with additional tariffs entering effect 1 Aug, adding to downside risks for the Canadian economy.
- USDCAD may remain elevated next week as markets monitor follow-through from new tariffs and assess further data on US jobs and Canadian trade. Potential progress or setbacks in Canada-US trade talks and upcoming economic releases could influence direction, while central bank policy signals and risk appetite will remain key catalysts.
Technical approach:
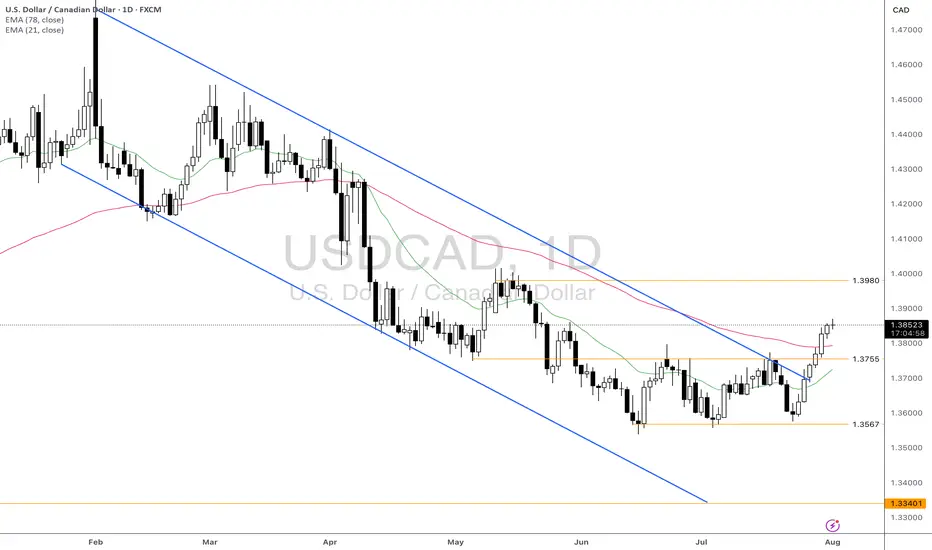
- USDCAD formed a Triple-bottom pattern at around 1.3567 and bounced up to break the neckline at 1.3755. The price also broke the descending trendline and closed higher than both EMAs, indicating a potential trend reversal.
- If USDCAD remains above the support at 1.3755 and both EMAs, the price may retest the resistance at 1.3980.
- On the contrary, closing below the support at 1.3755 and both EMAs may lead USDCAD to retest the key support at 1.3567.
Analysis by: Dat Tong, Senior Financial Markets Strategist at Exness
GOLD → Retest of resistance within a bearish runFX:XAUUSD breaks through the upward trend support amid a rallying dollar. Since the opening of the session, the price has been testing the zone of interest, but bears are quite aggressive...
Gold is partially recovering after falling to $3,268, a monthly low caused by the Fed's hawkish tone. The Central Bank kept its rate at 4.25–4.5% (9 votes to 2), highlighting uncertainty due to Trump's tariffs. Markets now estimate the probability of the rate remaining unchanged in September at 58% (previously 35%). The dollar's rise slowed amid concerns about the extension of the US-China trade truce and profit-taking ahead of key US employment data (after strong ADP and GDP reports). The nearest drivers are labor market statistics and trade news, while the technical picture for gold remains bearish.
Technically, on D1, the price is breaking key support zones, including the trend line, which overall only increases selling pressure on the metals market...
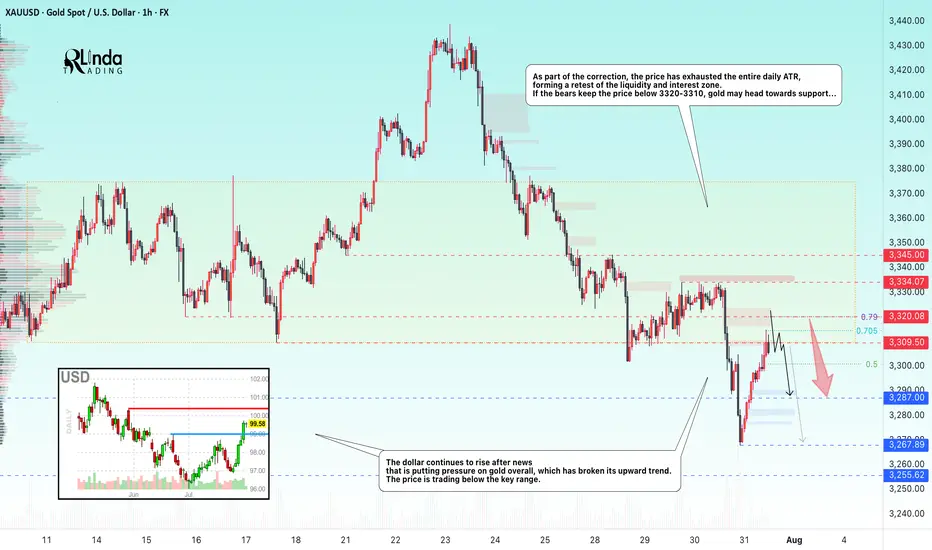
Resistance levels: 3310, 3320, 3334
Support levels: 3287, 3267, 3255
As part of the correction, the price has exhausted the entire daily ATR, forming a retest of the liquidity and interest zone. If the bears keep the price below 3320-3310, gold may head towards support...
Best regards, R. Linda!
SOLANA BULLISH MEGAPHONE PATTERN LOADING! solana continues to move step by step towards higher levels within the bullish megaphone pattern, which will make movements towards ATH and more inevitable in the coming period

BTC SHORT SETUP INTRADAY ( 02 AUG 2025 )If you have doubt on our trades you can test in demo.
Details:
Entry: 113,680 $ - 113,450 $
Target Price: 112,300 $
Stop loss: 114,370 $
Trade Ideas:
Idea is clearly shown on chart + we have some secret psychologies and tools behind this.
What is required to Join VIP?
- Nothing just you have to share 10% of your profit with us at the end of the month which you earned from our signals. Yeah this is just the requirement, trade where ever you like your favorite broker or else you don't need to pay fees first or create account thru our link.
Trade Signal:
I provide trade signals here so follow my account and you can check my previous analysis regarding BITCOIN. So don't miss trade opportunity so follow must.
BINANCE:BTCUSDT BINANCE:BTCUSDT.P BINANCE:BTCUSD

Gold you now totaly buy trend for next 3 to 5 days Gold you now totaly buy trend for next 3 to 5 days
If you want learn more fell free contrect me .

EURGBP Long Swing Trade OANDA:EURGBP Long trade, with my back testing of this strategy, it hits multiple possible take profits, manage your position accordingly.
This is good trade, don't overload your risk like greedy, be disciplined trader, this is good trade.
Use proper risk management
Looks like good trade.
Lets monitor.
Use proper risk management.
Disclaimer: only idea, not advice

BTC - BIG OPPORTUNITY COMING SOON AGAIN!IF BTC does not hold the current low, 95% probability we will go for the green box. biggest support is around $110.000 guys. Once/should backtested we could see massive opportunity again on altcoins!

Rocket Lab Is Up 800%+ in 12 Months. What Does Its Chart Say?Space-services company Rocket Lab NASDAQ:RKLB , which has seen its stock shoot up by more than 75% year to date and 800%+ over the past 12 months, will report its latest quarterly earnings next Thursday. Does RKLB's chart show the company has more altitude to gain ... or will it crash back to Earth?
Let's check things out:
Rocket Lab's Fundamental Analysis
For those of you unfamiliar with RKLB, it's a Long Beach, Calif.-based end-to-end space company. (Full disclosure: I own shares in the name.)
Rocket Lab designs and manufactures its own small- and medium-class rockets in order to provide launch services from its sites, which are primarily in Virginia and New Zealand.
The company has mostly had commercial customers since its founding, but is starting to get some traction providing these services to the U.S. government for national-security purposes. You might say the firm competes with Tesla chief Elon Musk's privately held SpaceX and Amazon founder Jeff Bezos' private Blue Origin firm, just on a smaller scale.
RKLB is set to release Q2 results after the bell on Aug. 7, with the Street looking for a $0.07 adjusted loss per share on $135.3 million of revenue.
That would represent a 27.3% revenue gain from the $106.3 million the company took in during the same period last year, although profitability would have eased from the $0.05 adjusted loss per share RKLB posted in Q2 2024.
Of the seven sell-side analysts that I found that cover the stock, three have increased their earnings estimates since the quarter began, three have cut their estimates and one has sat on his hands.
Notably, Jeff Van Rhee of Craig-Hallum this week initiated Rocket Lab with a "Hold" rating and a $51 target price (vs. the $45.30 the stock was trading at Friday afternoon).
Looking further ahead, analysts expect Rocket Lab's revenues to grow 32% for 2025 as a whole, followed by another 56% for all of 2026.
As for price action, Rocket Lab's shares have traded more volatilely as the firm approaches its earnings release. After spiking into mid-July on an almost parabolic run, RKLB has recently consolidated with a number of days that saw multi-percentage-point drops.
As of Wednesday, options markets were pricing in a 50% likelihood of a move greater than 13%.
Rocket Lab's Technical Analysis
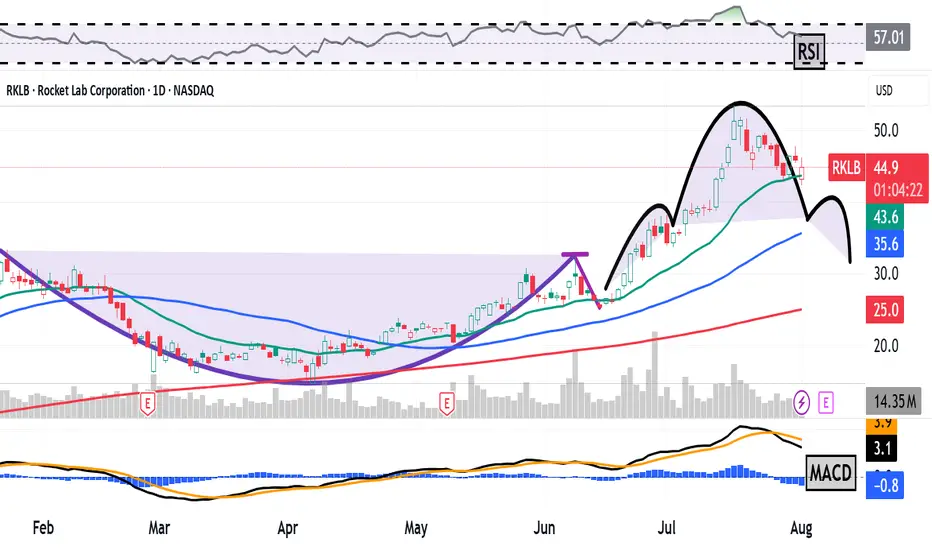
Now let's look at RKLB's chart going back to December:
Readers will note that since Rocket Lab ended its sharp upward run in mid-July, the stock's Relative Strength Index (the gray line at the chart's top) has exited overbought territory -- although the RSI still remains healthy.
Readers will also see that within the daily Moving Average Convergence Divergence indicator (marked "MACD" at the chart's bottom), the histogram of the stock's 9-day Exponential Moving Average (or "EMA," denoted by blue bars) has entered negative territory. That's usually short-term bearish.
Meanwhile, Rocket Lab's 12-day EMA (the black line near the chart's bottom) has also crossed below its 26-day EMA (the gold line). This is also traditionally a bearish signal.
However, one positive for the RKLB is that the stock appears to have found support in recent days at its 21-day EMA (the green line above). This suggests a willingness of swing traders to support the stock at that line.
Still, Rocket Lab's chart is showing what looks like a completed "head-and-shoulders" pattern of bearish reversal at the chart's right (denoted by curving black lines).
Should this pattern foretell a sell-off (as the daily MACD seems set up for), Rocket Lab's downside pivot would likely show up as a neckline at around $37 a share. That's well below the $45.30 that RKLB was trading at Friday afternoon.
What if Rocket Lab fails to hold its 21-day EMA ($45.90 in the chart above)? In that case, both the 50-day Simple Moving Average (or "SMA," marked with a blue line) and 200-day SMA (the red line) would have to come into play for the pattern implied here to become fully realized.
(Moomoo Technologies Inc. Markets Commentator Stephen “Sarge” Guilfoyle was long RKLB the time of writing this column.)
This article discusses technical analysis, other approaches, including fundamental analysis, may offer very different views. The examples provided are for illustrative purposes only and are not intended to be reflective of the results you can expect to achieve. Specific security charts used are for illustrative purposes only and are not a recommendation, offer to sell, or a solicitation of an offer to buy any security. Past investment performance does not indicate or guarantee future success. Returns will vary, and all investments carry risks, including loss of principal. This content is also not a research report and is not intended to serve as the basis for any investment decision. The information contained in this article does not purport to be a complete description of the securities, markets, or developments referred to in this material. Moomoo and its affiliates make no representation or warranty as to the article's adequacy, completeness, accuracy or timeliness for any particular purpose of the above content. Furthermore, there is no guarantee that any statements, estimates, price targets, opinions or forecasts provided herein will prove to be correct.
Moomoo is a financial information and trading app offered by Moomoo Technologies Inc. In the U.S., investment products and services on Moomoo are offered by Moomoo Financial Inc., Member FINRA/SIPC.
TradingView is an independent third party not affiliated with Moomoo Financial Inc., Moomoo Technologies Inc., or its affiliates. Moomoo Financial Inc. and its affiliates do not endorse, represent or warrant the completeness and accuracy of the data and information available on the TradingView platform and are not responsible for any services provided by the third-party platform.
BTC: in a new drop?!Hello guys!
btc is running in a descending channel!
However, the upper level is broken up, but it could reach the upper level after a drop here!
I am not sure about this analysis!
What do you think about it?
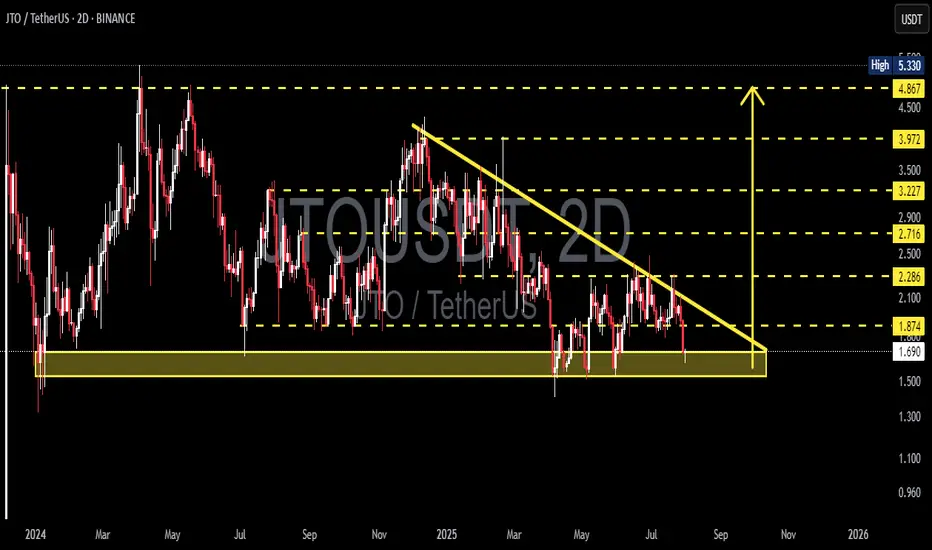
JTO/USDT at the Edge of Pressure – Breakout or Breakdown Ahead?🧠 Detailed Technical Analysis (2D Timeframe):
JTO/USDT is currently consolidating at a critical support zone within a well-defined Descending Triangle pattern that has been forming for over 6 months.
Key observations:
Price has been making lower highs, forming a downward-sloping resistance trendline.
Meanwhile, strong buying interest has held up the support zone between $1.69 and $1.87, suggesting accumulation.
This creates a classic Descending Triangle, often leading to a sharp breakout or breakdown.
---
📌 Key Levels:
Level Description
$1.69–$1.87 Major Demand Zone / Key Support
Descending Trendline Dynamic Resistance (from Lower Highs)
$2.29 First Resistance (Breakout Trigger)
$2.71 Key Mid-Term Resistance
$3.22 – $3.97 Major Upside Targets
$1.50 & $1.30 Breakdown Targets
---
📈 Bullish Scenario (Breakout):
If the price holds the support and successfully breaks the descending trendline, we could see a strong bullish reversal:
Confirmation breakout may lead to a rally toward $2.29 → $2.71 → $3.22 → up to $3.97.
Breakout strength increases if accompanied by volume surge.
Bullish Catalysts:
Positive project fundamentals.
Volume squeeze near triangle apex.
RSI/MACD divergence (if present).
---
📉 Bearish Scenario (Breakdown):
If price closes below the $1.69 zone with conviction:
Descending triangle confirms as a bearish continuation.
Target downside to $1.50 and potentially $1.30.
Could signal distribution phase by larger players.
Bearish Confirmation: Strong 2D candle close below $1.69 with high volume.
---
🧩 Pattern Breakdown – Descending Triangle:
The pattern represents price compression between lower highs and a horizontal support.
Statistically, 70% of descending triangles resolve to the downside.
However, in oversold conditions or with bullish catalysts, it may lead to a powerful short squeeze breakout.
---
🧭 Summary & Strategy Insight:
JTO/USDT is nearing a decision point. At the edge of the triangle’s apex, volatility is likely to spike — with a strong move in either direction.
💡Possible Strategy:
Conservative entry: Wait for breakout confirmation above the trendline with volume.
Aggressive entry: Speculative buy near $1.70 with tight stop loss.
Avoid heavy positions until the breakout or breakdown confirms.
---
🧲 Suggested Post Title:
> "JTO/USDT at a Crossroads – Descending Triangle Set for Explosive Move?"
A breakout is imminent. Will you be ready?
#JTOUSDT #CryptoBreakout #DescendingTriangle #AltcoinSetup #TechnicalAnalysis #CryptoStrategy #ChartPatterns
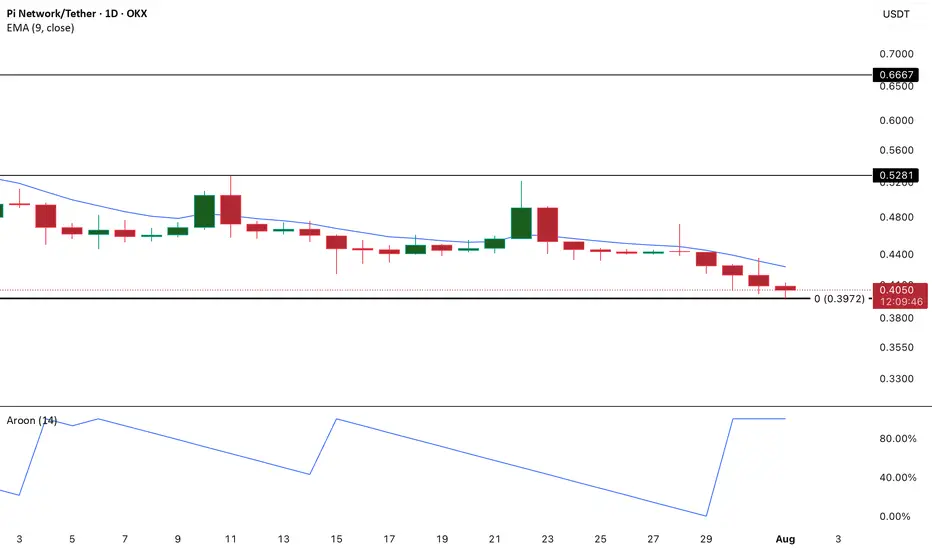
PI in Full Bear Control as Aroon Down Hits 100%PI continues to flash warning signs as technical indicators lean heavily bearish. Most notably, the Aroon Down Line on the daily chart has surged to a reading of 100%.
For context, the Aroon indicator is designed to identify the strength and duration of a trend, and when the Down Line reaches the 100% mark, it typically signals that a recent low was recorded very recently — often within the past day or two.
This kind of reading reflects an aggressive downtrend, where bearish momentum dominates and sellers are in full control.
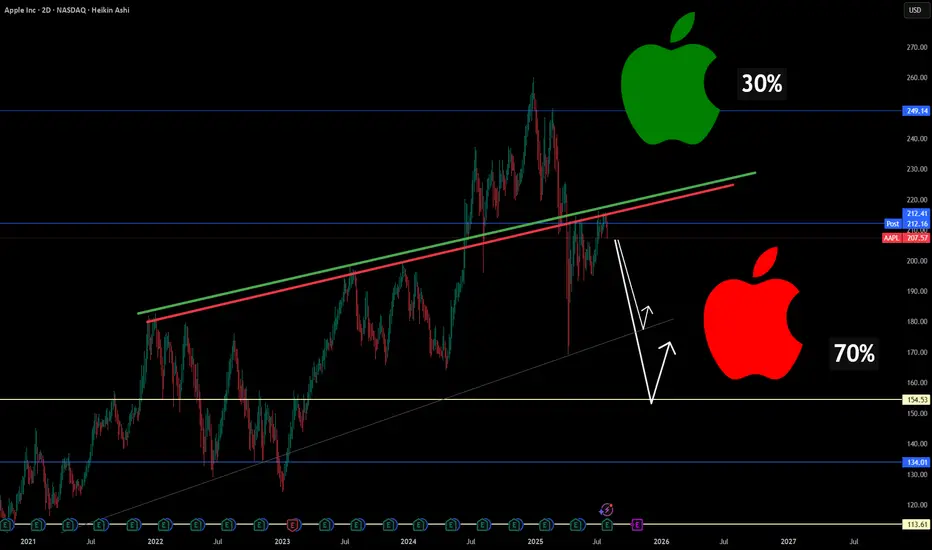
Why Apple Could Be Entering a Structural Correction🍎📉 Why Apple Could Be Entering a Structural Correction ⚠️🔍
After scanning major tech names today, one stock stood out— for all the wrong reasons : NASDAQ:AAPL .
Technically, Apple has broken below long-standing trendline support , and my chart now assigns a 70% probability(roughly guys...roughly and rounded) of further downside vs only 30% upside . But it's not just about the chart...
Here’s the macro storm Apple is walking into:
🧭 1. Trade War Revival
New tariffs on Chinese electronics could cost Apple up to $1.1B/quarter , even as it tries to diversify production. India and Vietnam are promising, but not mature enough to offset risk.
🤖 2. Lagging in the AI Arms Race
While Nvidia, Google, and Microsoft pour $30B+ into AI, Apple is spending less than half that. Analysts weren’t impressed with “Apple Intelligence.” Siri still isn’t leading.
🇨🇳 3. China: Flatlining Growth, Rising Risk
~18% of Apple’s revenue still comes from China. With Huawei resurging and tightening regulations, Apple’s dominance is being chipped away.
🛑 4. Innovation Pipeline: Empty?
There’s no iPhone super-cycle ahead. Vision Pro remains niche. Apple now looks like a mature tech stock without a breakout catalyst —risky when valuation is still premium.
⚖️ 5. Legal Pressure on Both Sides of the Atlantic
The DOJ and EU are targeting Apple’s App Store dominance. If changes are enforced, the service revenue moat weakens.
🔽 Summary: This Isn’t Panic. It’s Repricing.
The market is re-rating Apple based on real structural risks.
Downside levels I’m watching:
📉 177.65 (first support)
📉 154.53 (next key level)
❗️134–113 zone if macro pressure escalates
Chart = structure. Narrative = pressure. Both are aligned.
Let me know your thoughts—still long NASDAQ:AAPL , or hedging this weakness?
One Love,
The FXPROFESSOR 💙
Disclosure: I am happy to be part of the Trade Nation's Influencer program and receive a monthly fee for using their TradingView charts in my analysis. Awesome broker, where the trader really comes first! 🌟🤝📈
xauusd buybuy xauusd
XAUUSD
idea order block active with high volume here
and it back to test it
OANDA:XAUUSD

dYdX Bottom Consolidation Continues, Bullish NextHere you are looking at the formation of a bottom. The formation is a process not a single day event. It can take months for a bottom to fully form.
The way you know this to be true is because there is no downtrend. There are no new lows.
DYDX has been sideways now for 179 days, 6 months. Since early February 2025. In just three months, between December 2024 and March 2025, there is a very strong decline; lower highs and lower lows. A bearish move, a down-wave, a downtrend.
Ever since February the downtrend is no more. Rather than new major lows we have shy lower lows and finally not even that, no new lows. You can see the pattern how the market turned from bearish to sideways. This is the transition period. From sideways it will turn bullish, bullish goes next.
This is the point in time when most people will lose patiently and fold at a loss. Sell at the bottom, near support. This is the most important time to be patient, to accumulate, to even buy more and hold because we are looking at bottom prices. When prices are trading at the bottom and you are a bull, you can't go wrong.
Buy and hold. Continue holding because the market will soon turn.
Namaste.

Bears Target $0.14 DOGE — Is the Trend Your Friend?DOGEUSDT has been in a clear downtrend since late July, printing consistent lower highs and lower lows. The current market structure shows sellers firmly in control, with every bullish bounce quickly fading. The recent rejection near $0.2244 and the inability to sustain above the $0.21 zone highlight persistent selling pressure.
At the moment, DOGE is hovering around $0.2043, just under a short-term resistance band between $0.2067 and $0.2090. This area has acted as a rejection point in the last few sessions, suggesting that unless bulls can break above it with strong volume, the path of least resistance remains downward. Below, the first major support sits at $0.1855. If that breaks, the selling could accelerate toward $0.1680, a level that aligns with a previous consolidation base from June. In an extended decline, $0.1427 comes into view as a long-term support level that previously acted as a strong demand zone.
The chart also shows an active short trade setup in play:
• Entry: $0.2043
• Stop-Loss: $0.2244
• Targets: TP1 at $0.1855, TP2 at $0.1680, and TP3 at $0.1427
From a risk-reward perspective, this setup remains attractive, especially if the price breaks below $0.1855. However, traders should watch for any bullish invalidation signs — a close above $0.2136 could challenge the short bias, while a sustained break above $0.2244 would signal a possible trend shift. Until then, the broader technical picture still favors the bears.

ETH BREAKOUT IMMINENT?Ethereum is currently trading around $3,726, holding just above key support levels, including the 50-day SMA and the psychological $3,700 zone. Despite a minor pullback, ETH continues to show signs of bullish strength and remains in a healthy uptrend.
Momentum indicators like RSI and volume show signs of recovery, and ETH is forming a bullish continuation pattern near resistance. If Ethereum can break above the $3,820–$3,850 zone, we are likely to see a quick push toward higher levels.
Ethereum is showing solid strength after consolidating above $3,700. The breakout attempt toward $3,850 will be critical. If bulls push through this level with volume confirmation, a move toward $3,900 and then $4000 becomes highly probable.
The market structure is constructive, and the presence of ETF-driven institutional demand adds further bullish pressure. While short-term volatility may create minor pullbacks, the medium-term setup favors upward continuation.

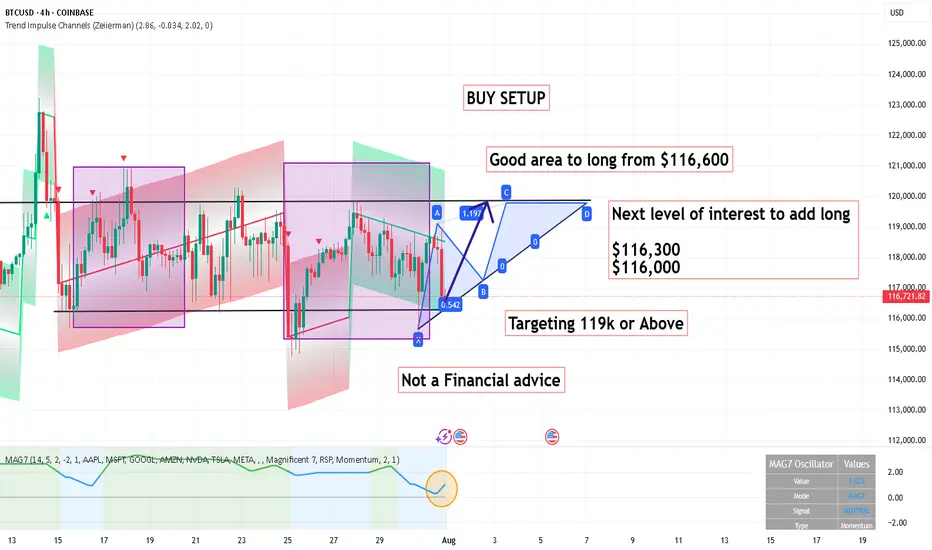
BUY SETUP ,Good area to long from $116,600BUY SETUP
Good area to long from $116,600
Next level of interest to add long
$116,300
$116,000
Targeting 119k or Above
Its not a Financial advice
SPX500 Will Go UP!
HI,Traders !
#SPX500 made a retest
Of the horizontal support
Level of 6277.78 and we
Are already seeing a
Bullish rebound so we are
Locally bullish biased and
We will be expecting a
Further bullish move up !
Comment and subscribe to help us grow !

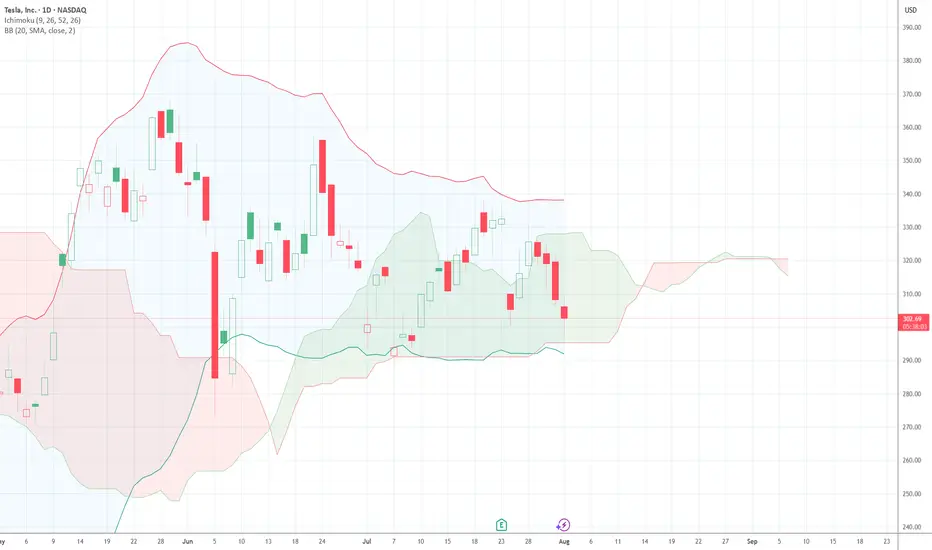
$TSLA 3rd Time's a CharmI bottom called NASDAQ:TSLA twice in a row. About to do it a third time today. 312.5C 8/8 @ 4.47 were just bought for $1.3 million.
Sui - My T2 target just hit As anticipated, target 2 (T2) was hit right on time (as indicated by red arrow set a few days ago)
Sui dumped after taking the liquidity above the high and I
assumed it would swipe the lows as well...before any chance
of a meaningful move towards the upside.
I hope, Sui doesn't hit my bearish T3
The angle I chose for my arrow, is an average angle of attack.
I love it when a plan comes together.
May the trends be with you!

MNMD Weekly consolidation underway. What will earnings do?MNMD has started weekly consolidation by 2c right as ATAI and possibly CMPS end their weekly consolidations. Earnings after hours tonight had no real effect on the charts, so here are the levels I'm looking at into tomorrow. Click to watch the free video for more details
I provider regular chart analysis of the psychedelics sector. Be sure to Like and Follow, and Subscribe to future updates so you don't miss a post!
Support: 8.94, 8.79
Resistance: 9.40, 9.44
