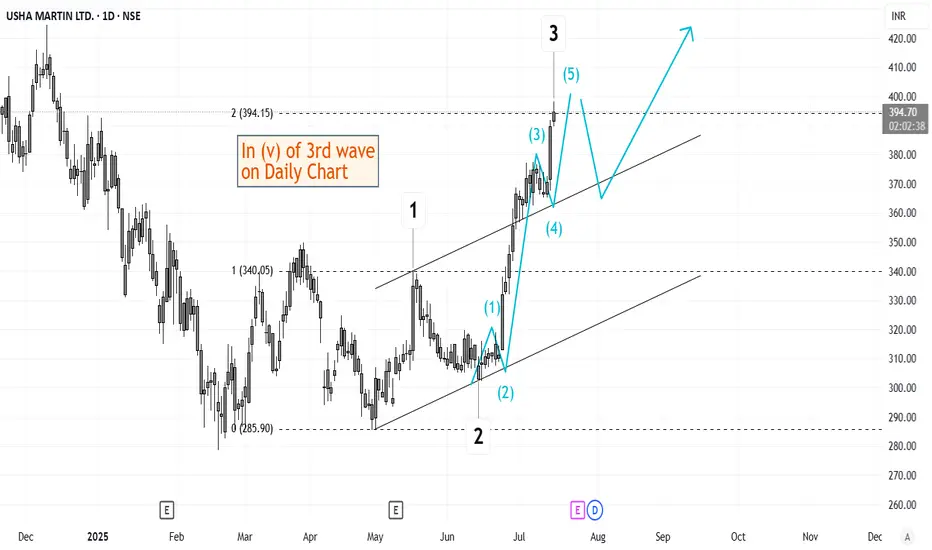
Elliott Wave Analysis of Usha Martin USHAMARTThe script is currently in (v) of 3rd wave on daily time frame. This should be followed by a short retracement and then a 5th wave up. Will keep updating this chart as it progresses.
Chartpatternsanalysis
JPYUSD Technical Breakdown | Inverse Head & Shoulders + Target🔍 Pattern Breakdown: Inverse Head & Shoulders (H&S)
We’ve identified a textbook Inverse Head & Shoulders pattern, a classic bullish reversal formation that often appears at the end of a downtrend. Here's how the structure played out:
Left Shoulder:
The initial drop formed a local low, followed by a short recovery, creating the first "shoulder" on the left.
Head:
A deeper push down formed the lowest point of the pattern, indicating a possible trap for sellers or exhaustion in bearish momentum. This is the "head" and the key anchor of the pattern.
Right Shoulder:
A higher low forms, showing buyers stepping in earlier and with more strength. This symmetry confirms the structure and signals a potential reversal in trend.
Neckline:
Drawn across the highs between the shoulders, this key resistance line was broken decisively, confirming the bullish pattern and triggering an upward breakout.
📌 Trendline + Retest Zone = Confluence Support
After the breakout above the neckline:
Price surged strongly, showing confidence in the reversal.
It pulled back gently to retest the neckline, which now acts as support.
This retest also aligns with the upward trendline, adding confluence — a strong signal in technical trading that increases the probability of a successful continuation move.
This zone is labeled on the chart as:
🟦 “Like a Retesting Zone After Boom” — a perfect description of what’s occurring.
🎯 Target and Resistance Zones
The price is now moving toward a major resistance zone marked between 0.007020 – 0.007060, with a target zone slightly above at 0.007080.
These zones represent historical selling pressure or supply areas. A breakout above this region would open doors to even higher levels, signaling strong bullish continuation.
📈 Why This Setup Matters (MMC Strategy Applied)
Using the Market Mapping Concept (MMC) approach, this trade idea combines:
Market structure (Inverse H&S pattern)
Momentum confirmation (strong bullish move after breakout)
Zone mapping (support/resistance confluence)
Trendline validation (clean structure with pullback respect)
This creates a well-defined trade setup with clear entry and exit logic, excellent risk-to-reward potential, and technical confirmation.
✅ Summary: Bullish Outlook With Managed Risk
Bias: Bullish continuation as long as price holds above the neckline/trendline zone.
Confirmation: Inverse H&S pattern + successful retest.
Target: 0.007060–0.007080 resistance zone.
Invalidation: Break below 0.006980 and close under trendline support.
💬 Minds Post Caption (Extended)
🔥 JPYUSD Ready to Fly? Inverse Head & Shoulders Breakout Spotted!
Clean reversal pattern (H&S) just completed with a strong neckline breakout and a perfect retest at trendline confluence. MMC analysis suggests bullish continuation toward the 0.007060+ resistance zone. Classic "retest after boom" move. Watching price action closely! 🚀📊

LIGHTBRIDGE BREAKING out from a DOUBLE BOTTOMDYOR on the fundamentals.
This idea share is solely based on the chart.
Which exhibits a beautiful double bottom breakout.

EURGBP Bullish Structure Analysis – Channel Breakout + Target🧱 1. Market Structure Breakdown
EURGBP has been trading within a descending channel, forming consistent lower highs and lower lows, which indicates a short-term bearish trend. However, price action recently broke out above the upper boundary of this channel, suggesting a potential bullish reversal or trend correction.
This breakout marks a significant structural shift in market behavior.
🔵 Old Structure: Bearish, confined within the channel
🟢 New Structure: Bullish breakout above trendline + key resistance zone
🧩 Implication: Change in directional bias; potential for long opportunities
📍 2. Breakout Confirmation
The breakout was confirmed by:
A strong bullish impulse candle that closed above the descending trendline
Price sustaining above previous resistance (~0.8405)
Increase in bullish volume at the breakout point (if volume indicator is used)
This suggests that the breakout is genuine, not a false spike or liquidity grab.
🌀 3. Retest Phase – The Critical Zone
After breaking out, the market is now pulling back to retest the previous structure. This is a textbook price action move:
🔄 What’s Being Retested?
✅ Upper boundary of the descending channel
✅ Major horizontal support/resistance zone (~0.8405–0.8415)
✅ Broken trendline from previous lower highs
✅ QFL base (Quasimodo level that was swept)
✅ 50% Fibonacci retracement of the breakout move
This zone forms a multi-level confluence area, making it a strong support for potential long entries.
🔍 4. Key Technical Observations
Element Description
📐 Descending Channel Defined the prior bearish structure. Breakout invalidates this bias.
🧱 Trendline Retest Acts as dynamic support; price currently sitting on it.
🔃 SR Flip Zone Old resistance (~0.8405) turned into support—critical level.
📊 Fib 50% Retracement Provides technical alignment with potential buying interest.
📌 QFL/Order Block Zone Historical demand was swept and now being respected again.
🎯 5. Target Levels & Trade Plan
If the structure holds and the price responds bullishly from the current zone, the next levels of interest are:
✅ Primary Target – 0.8460
A clear supply/liquidity zone from previous structure highs
Also aligns with psychological round number and Fib extension
⚠️ Interim Target – 0.8430
Previous intra-channel resistance level
May serve as a short-term reaction point
❌ Invalidation Level
A clean break and close below 0.8390 would invalidate the breakout structure
This would reintroduce bearish pressure and signal a potential fakeout
🧠 6. Trade Idea (Not Financial Advice)
Entry: Around 0.8405–0.8415 on bullish confirmation (e.g., engulfing candle, pin bar, break of minor downtrend)
Stop-Loss: Below 0.8390 (beneath structure & invalidation point)
Take-Profit 1: 0.8430
Take-Profit 2: 0.8460
This offers a high R:R opportunity if managed with proper confirmation.
🧭 7. Risk Management & Considerations
Avoid entering prematurely without a bullish signal (e.g., pin bar, engulfing, RSI divergence).
Monitor macroeconomic news—especially from BoE or ECB—as they can disrupt technical setups.
Scaling into the position or using a split TP strategy can help protect profits.
✅ Conclusion
This EURGBP setup is a textbook case of market structure trading:
A well-defined channel breakout
Followed by a clean pullback to structure
With confluence across horizontal, diagonal, and Fibonacci levels
If price respects this zone, bulls could drive toward 0.8460, offering a solid opportunity for traders who understand structure-based setups.
📌 Always wait for confirmation—structure gives us context, but entries need price action signals to minimize risk.

BTCUSD Curve Breakout & MMC Structure | Targeting $111KIn this idea, we apply Mirror Market Concepts (MMC), a method of analyzing symmetrical price behavior to forecast key market moves. This BTC/USD 15-minute chart showcases a beautiful execution of MMC principles, blending curved structure analysis, SR interchange, and trendline dynamics to capture a compelling bullish opportunity.
🧩 Chart Structure Analysis (Detailed Breakdown):
🔸 1. Curve Line Formation & Mirror Market Concepts (MMC):
The centerpiece of this analysis is the curved market structure, which resembles a cup-like formation. Using MMC, the market is seen as reacting in mirrored patterns — left side = right side. In this context, the curve mimics the balance of supply and demand over time, providing a visual roadmap of potential price behavior.
Curve Line Resistance: The upper black arc served as dynamic resistance.
Curve Line Support: The lower arc acted as dynamic support.
Once price broke above the curved resistance, it confirmed a bullish market structure shift, triggering a key breakout signal.
🔸 2. Breakout & Retest Pattern:
Following the curve line resistance breakout, price pulled back for a retest, validating the structure. This is a high-probability continuation setup where:
The breakout confirms bullish interest.
The retest confirms that former resistance is now support.
This retest occurred exactly near the intersection of:
Curve Line Support
SR Interchange Zone (gray shaded area)
Trendline Support
This confluence adds strength to the bullish outlook.
🔸 3. SR Interchange Zone (Support/Resistance Flip):
The horizontal SR Interchange area is a key pivot zone, where price previously faced resistance. After the breakout, price came back to this level and found strong buying interest, flipping it into support.
This acts as a reaccumulation zone.
Price rejected from this zone with a clean bullish impulse.
🔸 4. Trendline Support Validation:
After the retest, price formed a new ascending trendline, respected multiple times by price. This ascending trendline acts as a guide for trailing stop placements or re-entry zones. Price remained above this trendline, reinforcing bullish structure integrity.
🔸 5. Central Zone & Liquidity Sweep:
The Central Zone marked a midpoint in the curve, which:
Acts as a balance point between the mirrored halves.
Is often used as a liquidity grab area before direction continuation.
Price dipped into this zone, likely collecting stop orders or liquidity before reversing higher — a classic MMC behavior.
🔸 6. 50% Retracement Level:
A horizontal marker near the 50% retracement level serves as a psychological and technical barrier. As of the last candle:
Price is hovering around this midpoint.
A breakout above this level would trigger further bullish movement toward the target zone.
Traders often look for volume expansion at this point to confirm conviction.
🔸 7. Target Zone (Projected via Curve Symmetry & Range Extension):
The target zone is marked near $111,600, based on:
Mirror projection of the curve's depth (height symmetry).
Range extension from the curve’s breakout.
Potential measured move based on pre- and post-breakout range.
This level represents a logical exit or partial TP zone for long positions.
📈 Trading Plan Summary:
Entry Zone: After breakout and retest around the SR Interchange/Curve Support/Trendline Confluence.
Support Confirmation: Trendline holding and bullish structure above central zone.
Mid-Target: 50% retracement breakout ($110,400).
Main Target: $111,600+ target zone based on curve projection.
Invalidation: Clear break below trendline and loss of SR flip zone.
🔍 Educational Takeaways:
Mirror Market Concepts (MMC) are highly effective in anticipating symmetrical price behavior.
Confluence of curved breakout, SR flip, and trendline validation provides high confidence in trade setups.
Market symmetry helps define logical targets, entries, and risk zones.
Always look for a pullback to structure — the best trades often come after the breakout and confirmation.
🚨 Risk Management Reminder:
As always, proper risk management is crucial. Wait for confirmation before entering, and use stop-losses below structural levels (such as the trendline or SR Interchange zone) to limit downside risk.

EUR/GBP Bullish Breakout Forming – Falling Wedge & Retest SetupEUR/GBP has been in a prolonged downtrend over the past several weeks, characterized by lower highs and lower lows. However, the recent price action shows signs of exhaustion in selling pressure, as the candles begin to compress into a Falling Wedge pattern — a classic bullish reversal formation.
The wedge is defined by two descending, converging trendlines. As price moves closer to the apex of this wedge, volatility contracts and volume typically dries up (not shown here, but conceptually expected). This signals that market participants are preparing for a directional breakout, most likely to the upside in this context.
🔍 Key Technical Elements:
🔸 1. Falling Wedge Pattern:
The Falling Wedge is a bullish setup that forms during a downtrend and signals a potential reversal when confirmed. Price here has followed a steady decline, but the slowing momentum and structure of the wedge suggest the sellers are losing control.
The wedge acts as a compression zone, where bearish moves are becoming less impactful.
Price touches both upper and lower wedge boundaries multiple times, increasing pattern validity.
A breakout has already occurred, and the pair is now undergoing a textbook retest of the broken wedge resistance (now acting as support).
🔸 2. Retest at Key Support Zone (SR Interchange):
The retest is happening precisely at a former support/resistance flip zone, labeled SR – Interchange on the chart. This is a historically significant area where price has reacted multiple times, adding confluence to the setup.
If this level holds during the retest, it may invite strong buying interest, fueling the bullish breakout move.
🔸 3. Resistance Zones & Targets:
Inner Resistance (~0.8460): First hurdle for bulls; breaching this will signal strong momentum.
Minor Resistance (~0.85618): This is the primary target of the setup, based on previous structure and wedge height projection.
Major Resistance (~0.8740): A longer-term bullish objective if momentum sustains beyond the first two targets.
These zones serve as logical areas for profit-taking and reassessment.
📐 Measured Move & Target Projection:
The projected breakout target of 0.85618 is derived using a combination of:
The vertical height of the wedge at its thickest point.
Previous market structure resistance zones.
Fibonacci and price symmetry (if analyzed further).
This target also aligns with a previous supply zone, making it a strong magnet for price if bullish momentum kicks in.
💡 Trading Plan (Not Financial Advice):
This setup provides a good risk-to-reward opportunity if executed with patience and proper confirmation:
Entry Zone: After bullish confirmation at the retest (e.g., bullish engulfing candle, pin bar, or break of minor lower high).
Stop Loss: Below the SR Interchange zone or recent swing low (~0.8350–0.8360).
Target 1: Inner Resistance (~0.8460)
Target 2: Minor Resistance (~0.85618)
Target 3 (extended): Major Resistance (~0.8740)
🔄 Market Psychology:
This chart setup reflects a shift in momentum and sentiment:
Sellers have driven the price down consistently but have failed to create new significant lows with force.
Buyers are stepping in at key demand zones, creating higher lows within the wedge.
The breakout suggests smart money accumulation, and the current retest offers one of the last low-risk entries before a broader move.
🔔 Confirmation to Watch:
Bullish reversal candlestick patterns at the retest zone.
Break above local lower highs near 0.8440–0.8460.
Momentum indicators (if used) showing divergence or crossover confirmation.
📉 Bias:
Short-Term Bullish
Valid if support at 0.8390–0.8400 holds and price confirms breakout continuation.
🧠 Minds Post (Expanded Explanation)
Title: EUR/GBP Bullish Reversal Developing – Falling Wedge Breakout Retest
EUR/GBP has broken out of a textbook falling wedge on the 4H chart, which often signals the end of a downtrend and beginning of a new bullish phase. The price is currently pulling back, testing the breakout zone — a crucial step in confirming the validity of the breakout.
If this retest holds, we may see a sharp move toward the 0.8460 and 0.8560 levels — both key resistances based on past price action.
This pattern reflects a deeper market psychology shift — from consistent bearish dominance to a potential bullish takeover. Smart money may already be positioning here.
I’m watching for confirmation at the support zone around 0.8390. If price holds and breaks above local highs, a continuation toward the upper resistance is likely.
Let the market come to you. Don’t chase. Wait for structure, then trade with confidence.

EUR/USD Breakdown Imminent – Rising Wedge at Major ResistanceOn the 1H chart, EUR/USD has developed a Rising Wedge pattern, a classical bearish reversal formation. The pair has been moving higher within a tightening structure, marked by converging trendlines—indicating weakening bullish momentum.
What makes this pattern more compelling is that it’s occurring just below a well-defined Major Resistance Zone around 1.1380–1.1400, where previous attempts to break higher have failed. This area has historically acted as a strong supply zone, increasing the probability of a reversal.
🔍 Key Technical Components:
Rising Wedge Pattern: The wedge reflects a temporary uptrend with weakening strength. Bullish candles are getting smaller, and volume appears to be fading (not shown here but typically expected in this setup).
Black Mind Curve Support: A custom support curve illustrating the underlying parabolic trend. Once this is broken, it often leads to a steeper selloff.
Change of Character (CHOCH): Around the 1.1260 level, there's a possible shift from bullish to bearish structure. If price breaks and closes below this level, it will likely confirm a momentum reversal.
Target Projection: The measured move and previous structural support suggest a drop toward 1.11479, which coincides with a prior demand zone. This also aligns with a potential liquidity sweep beneath recent lows.
🔔 Price Action Signals to Watch:
Bearish engulfing candles or strong rejections from the wedge’s upper boundary.
Breakdown below the lower wedge line and the curved support.
CHOCH confirmation – market structure shift from bullish to bearish around 1.1260.
Retest of the wedge breakout level, followed by continuation to the downside.
📌 Trading Plan (Not Financial Advice):
Entry: On break and retest of wedge support.
Stop Loss: Above the wedge high or resistance (~1.1400).
Target: 1.11479 for first take-profit level; partials can be taken at 1.1260 if needed.
📉 Bias:
Short-Term Bearish – Only upon wedge breakdown and confirmation.
🧠 Minds Section (Expanded for Traders' Perspective)
EUR/USD is approaching a critical technical juncture. We are seeing a textbook rising wedge formation into a major resistance zone, signaling exhaustion of bullish strength. While the pair has enjoyed upward momentum, price action is showing signs of slowing, and the structure is no longer sustainable.
This pattern often traps late buyers before reversing. We are closely watching the lower wedge boundary and curved support—a breakdown here will likely trigger bearish momentum, especially with the CHOCH area near 1.1260 acting as a structure-defining level.
If sellers gain control and the breakdown confirms, there’s high probability for a fall to 1.11479, targeting prior demand zones and potential liquidity pockets.
Now is the time to be cautious if long, or begin planning short setups. Wait for confirmation—no need to rush the trade.

EURAUD – Bullish Breakout from Inverse Head & Shoulders + Target🔍 Pattern Insight: Inverse Head & Shoulders – A Powerful Reversal Formation
On the weekly timeframe, EURAUD has completed and broken out of a textbook Inverse Head & Shoulders (IHS) pattern — a highly regarded bullish reversal setup that often signals the end of a downtrend and the beginning of a sustainable uptrend.
Let’s break it down:
Left Shoulder: Formed in mid-2021 after a strong downtrend, price found support and rebounded, forming the initial shoulder low.
Head: A lower low was established around early 2022, marking the deepest point of the pattern. This represents the last dominant push by sellers before exhaustion.
Right Shoulder: In late 2022 to early 2023, bulls stepped in earlier than before, establishing a higher low — a strong sign of decreasing bearish momentum and accumulation.
Neckline : A descending resistance trendline connecting the peaks between the shoulders and the head. Once broken, it confirms the IHS breakout and trend reversal.
This multi-year formation reflects a major psychological shift: sellers lost control at the head, and buyers gradually regained dominance at the right shoulder, eventually breaking resistance.
📉 Retest in Progress – High Probability Entry Zone
Post-breakout, price action has pulled back for a technical retest of the neckline and curve line support — a dynamic trendline representing growing bullish momentum. This retest is essential for validating the breakout and building the base for a continuation rally.
The convergence of support zones (neckline + curve line) around the 1.70–1.72 area provides a strong confluence zone where buyers may step in again. This is often viewed as a second-chance entry for traders who missed the breakout.
🎯 Measured Target Projection & Resistance Levels
The IHS pattern gives us a clear measured move:
Measured Move Target: Distance from the head to neckline (~2,800+ pips) projected from the breakout point.
Target Zone: 1.92 – 1.95, just above the major resistance zone.
Resistance Zone: 1.85 – 1.87 is a historically significant supply area and may act as interim resistance.
Break and close above the resistance zone would further validate the bullish trajectory and open the door for higher targets.
📌 Risk Management – Defined Parameters
To manage risk effectively, consider:
Stop Loss: Below the recent retest low and curve line support, ideally placed at 1.63848, protecting against a false breakout.
Entry Idea: If bullish confirmation (e.g., bullish engulfing candle, higher low on lower timeframe) appears at retest zone, initiate a long position.
Risk-to-Reward (RR): Targeting 1.92 from an entry around 1.72 offers a 4:1 RR or better — highly attractive for swing and position traders.
🧠 Psychological and Structural Significance
This pattern is not just technical — it represents behavioral change in the market:
The head shows capitulation — a final wave of bearish pressure.
The right shoulder indicates growing confidence in bulls and waning selling interest.
The neckline breakout is where sentiment flips — traders recognize the change and enter long positions, fueling the breakout.
The current retest phase is crucial. Many professional traders wait for this moment to confirm that support holds before fully committing.
🔎 Final Thoughts & Strategy
Trend has shifted bullish on the weekly chart after years of consolidation and decline.
We’re seeing a classic breakout–retest–continuation setup.
A breakout above 1.85 would likely trigger momentum traders and institutions, driving price swiftly toward the 1.92–1.95 range.
Invalidation: Break below 1.63848 would invalidate the pattern and shift sentiment back to neutral or bearish.
📈 Trade Plan Summary:
Pattern: Inverse Head & Shoulders (weekly)
Bias: Bullish
Entry Zone: 1.70 – 1.73 (retest area)
Target: 1.92+
Stop Loss: Below 1.63848
Risk Level: Medium (weekly setup, but long-term play)

EUR/JPY Technical Breakdown: Rising Wedge Breakdown + Target🔺 1. Rising Wedge Pattern Explained
A Rising Wedge is formed when:
Price action creates higher highs and higher lows, but
The slope of the support line is steeper than the resistance line.
This signals that buyers are losing strength, and momentum is fading.
In this chart:
The wedge began forming around mid-February 2025.
Price was compressing within converging trendlines.
After multiple failed breakouts near resistance (~165.50), the pair finally broke below the lower trendline, confirming a bearish breakout.
This pattern is considered reliable because it traps late buyers and shifts sentiment from bullish to bearish quickly once the lower boundary is breached.
🔻 2. Key Technical Zones
📌 Major Resistance Zone (~165.00 – 166.00)
Strong supply area; price has rejected here multiple times since late 2023.
Resistance was confirmed again during the wedge formation.
High volume spike noted near this level, followed by a steep drop—evidence of distribution and smart money exiting long positions.
📌 Major Support Zone (~156.00 – 157.00)
Historically held as a demand zone.
Previous bounces suggest it is structurally significant.
However, repeated tests can weaken the zone, increasing the likelihood of a breakdown.
🎯 Target Price: 153.433
Measured by taking the height of the wedge and projecting it from the breakout point.
Coincides with a previously tested level (support turned target).
Bears could aim for this level as a swing target.
📉 3. Market Psychology Behind the Pattern
As price climbs inside a rising wedge, volume often declines, showing buyer exhaustion.
False breakouts near the top of the wedge trap breakout traders, adding fuel to the downside move once price breaks the lower boundary.
The sharp selloff post-breakout is often driven by stop-loss cascades and aggressive short positioning.
🔁 4. Potential Price Path & Trade Plan
Retest in Progress: Price may retest the broken wedge support (now resistance) near 163.00–164.00 before further decline. This retest zone offers a high-probability short entry opportunity with tight risk management.
Immediate Downside Levels: 160.00 (psychological level), 157.00 (support zone), and final target at 153.43.
Bearish Continuation Scenario: If the pair maintains below the wedge and forms lower highs, it confirms ongoing bearish sentiment.
🛑 5. Risk Factors to Monitor
ECB or BOJ monetary policy shifts (rate cuts/hikes, yield curve control updates).
Risk-on vs risk-off flows, especially in times of geopolitical or macroeconomic shocks.
Intervention by the Bank of Japan to protect JPY from excessive weakening.
✅ Conclusion: A Tactical Short Opportunity
The EUR/JPY chart is setting up for a potential medium-term short swing trade following a confirmed rising wedge breakdown. With clear rejection from a long-standing resistance zone and fading bullish momentum, the technicals align for a move toward 153.43 over the coming weeks.
Traders should watch for clean retests and structure-based entries, managing risk around 164.50 with profit-taking at key support zones along the path.

Rising Wedge Breakdown – Bearish Setup on Silver (XAGUSD)Silver (XAG/USD) is currently trading within a bearish rising wedge formation on the 8-hour timeframe, and the market structure is hinting at a potential reversal to the downside. The confluence of resistance zones, pattern anatomy, and historical price action all point to a high-probability short setup, especially if key support levels are breached.
📈 Pattern Analysis: Rising Wedge
A rising wedge is typically a bearish chart pattern that forms when price consolidates between two upward sloping trendlines. However, the upper trendline rises at a slower pace than the lower one—indicating decelerating bullish strength. It often precedes a bearish breakout, especially if volume decreases near the apex.
In this case, the wedge is forming just below a major resistance zone around the $34.00 area, adding weight to the bearish scenario.
🔹 Key Technical Levels :
🟥 Resistance Zone ($33.80–$34.80): Price has tested and rejected this area multiple times in recent weeks. It marks a clear liquidity zone where sellers are in control.
🟩 Support Zone ($29.50–$30.30): This zone has provided strong support in previous retracements. If broken, it may flip into resistance upon retest.
🟦 Retest Zone (~$31.00–$31.50): If the wedge breaks downward, price may retest this area—creating an opportunity for traders to enter short with better risk-reward.
🎯 Final Bearish Target : $26.85: This level is derived from the height of the wedge and prior demand zones, making it a strong target area in a fully played-out bearish move.
🧠 Market Structure & Sentiment:
Volume Analysis – Volume has been tapering off as the price squeezes within the wedge, which is a typical trait of rising wedges. A volume spike on breakdown would serve as confirmation.
Trend Analysis – While the overall trend in the medium term has been bullish, the weakening upward momentum suggests that buyers are losing strength, and sellers may regain control soon.
Rejection Candle s – Several recent candle wicks above the $33.50 zone show clear rejection and failure to close above, reinforcing the resistance level.
📊 Trade Plan (Educational Purposes Only):
Criteria Details
Bias Bearish (Rising Wedge Breakdown)
Entry Option 1 On breakdown of wedge + retest
Entry Option 2 Aggressive entry on breakdown candle close below $31.50
Stop Loss Above $33.80 (last resistance)
Take Profit 1 $30.00 (support zone)
Take Profit 2 $28.00 (partial exit)
Take Profit 3 $26.85 (final target)
📌 Trading Psychology Note:
Traders should remain patient and avoid entering prematurely. Let the pattern confirm itself with a clean break and retest. Risk management is critical—wedge patterns can also fake out before reversing hard.
🧾 Summary:
Silver is nearing the end of a rising wedge pattern, right under a heavy resistance zone. Historical behavior, weakening momentum, and classic wedge structure suggest a potential bearish reversal. A break below the wedge support and a retest around $31.00 could present a high-probability short trade setup targeting the $26.85 area.
Keep this chart on watch. A decisive move is likely coming soon.

BTC/USD: Structural Breakout of Curved Resistance – Eyes on $116Technical Overview:
Bitcoin (BTC) has successfully completed a significant technical breakout after months of accumulation and resistance interaction. The chart highlights a precise market structure where price has moved from a phase of consolidation into a confirmed bullish breakout, with a clearly defined target and invalidation level.
1. SR Interchange Zone (Support-turned-Resistance):
From May to October 2024, BTC price action was trapped in a sideways range, marked by an extended accumulation phase between approximately $60,000 to $73,000. This zone acted as a historical resistance level during the downtrend, but was later flipped into support, forming a classic SR Interchange — a foundational concept in market structure analysis.
This area provided a strong base from which BTC launched its late 2024 rally.
2. Consolidation Below Curved Resistance (Dec 2024 – Apr 2025):
Following a steep bullish impulse, BTC entered a multi-month consolidation phase, forming a rounded top pattern — shown on the chart as the Black Mind Curve Resistance. This curved resistance represented a psychological and structural ceiling, suppressing bullish momentum and trapping liquidity.
Price action was tightly compressed under this dynamic resistance curve, with multiple failed breakout attempts. This period was marked by range-bound volatility and low directional commitment — classic behavior during a re-accumulation phase.
3. Breakout of Black Mind Curve Resistance (May 2025):
A major technical event occurred as BTC broke decisively above the Black Mind Curve Resistance, accompanied by a surge in bullish momentum. This move not only invalidated the prior rounding top structure but also confirmed a trend continuation breakout.
The breakout was clean, with strong follow-through volume and a higher high structure above the Major Horizontal Resistance Zone (~$105,000–$109,000) — now confirmed as flipped support.
4. Bullish Continuation & Price Target:
Following the breakout, BTC has established a higher low and continued its upward trajectory toward the marked target zone at $116,065. This zone coincides with:
Previous untested supply levels
Technical Fibonacci extension (1.272–1.618 zone)
Measured move from the curve structure base
With current momentum and structure intact, BTC remains bullishly biased until it either reaches the target zone or breaks below the invalidation level.
5. Invalidation & Risk Management:
A close below $102,005 — the defined SI (Support-Invalidation) level — would be considered structurally bearish. This level represents:
The most recent higher low
Base of the breakout structure
Re-entry into previous consolidation range
A breakdown below this level would invalidate the bullish thesis and may open the door for a deeper pullback toward $95,000 or even $88,000.
✅ Conclusion:
The breakout of the Black Mind Curve Resistance marks a significant technical shift in Bitcoin’s trend. With momentum in favor of the bulls and market structure supporting higher prices, BTC appears poised to test the $116,000 target zone in the short to mid-term — barring a breakdown below key support.
📌 Key Levels Recap:
Level Type Price
Target Zone $116,065
Current Price $110,902
Support / Invalidation (SI) $102,005
📈 Strategy Outlook:
Bias: Bullish
Entry Area: Retest of $107,000–$109,000 (if offered)
Target: $116,065
Stop-Loss: Below $102,005 (structural invalidation)
💬 Stay focused on structure, not emotions. The best trades are born from patience, not prediction.
Let me know if you'd like a summary version for use on social media or a custom signature block for your TradingView profile.

EUR/JPY 1H: Bullish Falling Wedge Breakout + Target 🧠 Overview of the Setup
The EUR/JPY currency pair has recently completed a Falling Wedge pattern, a classic and powerful bullish reversal formation. This chart structure typically signals the end of a downtrend and the potential beginning of a strong upward impulse.
In this setup, multiple confluences point toward a bullish move, including pattern breakout, structure shift, retest of a dynamic support level, and alignment with major supply/resistance zones.
🔍 Pattern Analysis: Falling Wedge
Definition: A falling wedge is a technical pattern formed by two downward-sloping trendlines — one representing resistance and the other support — that converge. It signals a slowdown in bearish momentum, often preceding a bullish reversal.
Chart Observation: The wedge is well-defined, spanning several trading sessions. As price action tightened toward the apex, bearish momentum began to weaken.
Breakout Trigger: Price broke convincingly above the upper wedge boundary, suggesting the start of a bullish reversal.
✅ Implication: The breakout confirms that buyers have taken control, especially as this move is supported by a structural Change of Character (CHOCH).
📈 Price Action Structure & Key Zones
1. Minor Resistance (Broken)
After the breakout, price encountered a minor resistance zone just above the wedge. This area is now likely to flip into support (a classic breakout retest).
2. Major CHOCH (Change of Character)
A CHOCH indicates a break in market structure — from lower highs and lower lows to higher highs and higher lows.
The break above this level confirms a shift from bearish to bullish sentiment.
3. Curved Support (Black Min Curve)
A rising curved trendline has formed below current price, acting as a parabolic support structure.
This suggests not just a trend reversal, but increasing bullish momentum, as buyers step in at higher levels with each correction.
4. Major Resistance Zone (Target Area)
Price Target: ~164.50 – 165.50
This zone has historically acted as strong supply and is marked for potential take-profit or observation for reversal signals.
The target is derived from both horizontal resistance and the projected height of the wedge pattern.
🎯 Trading Strategy
Component Details
Entry Zone 162.50 – 162.60 (retest of minor resistance + curve support)
Stop Loss Below 162.00 (beneath wedge and curve)
Take Profit 164.50 – 165.50 (major resistance)
Risk/Reward Approx. 1:2.5 to 1:3
🔸 Conservative Entry: Wait for bullish confirmation (bullish engulfing candle or pin bar) on the support retest.
🔸 Aggressive Entry: Market buy after confirmation of curve bounce or on lower timeframe bullish signals.
📊 Volume & Momentum Consideration
Although volume isn’t shown on this chart, volume confirmation on the breakout would significantly strengthen the bullish bias. Look for:
Increasing buy volume on breakout
Lower sell volume on pullbacks
Bullish divergence (if using RSI or MACD)
⚠️ Risk Management & Event Awareness
Be cautious of unexpected JPY-related economic releases (e.g., BOJ announcements, inflation data) that may cause volatility.
If the curved support is broken decisively, this could invalidate the setup, suggesting further consolidation or downside risk.
🧠 Psychological Perspective
The Falling Wedge reflects a market where sellers are gradually losing control — pushing price lower, but with less conviction. As the wedge tightens, bulls prepare to step in. The breakout confirms that sentiment has shifted, and many traders use such setups as entry points for swing or momentum trades.
The curved support line suggests a transition from accumulation to markup phase, which typically leads to faster price expansion as confidence in the uptrend grows.
✅ Summary
✅ Pattern: Falling Wedge (Bullish)
✅ Breakout: Confirmed with CHOCH
✅ Support: Curve trendline acting as dynamic support
✅ Target: 164.50 – 165.50 major resistance
✅ Bias: Bullish (until curve support is broken)
📣 Final Thoughts
This is a high-probability bullish continuation setup backed by price structure, pattern breakout, and support alignment. The risk is well-defined, and reward potential is strong — making this a favorable setup for swing traders or short-term position traders.
💬 Let me know what you think in the comments — are you going long EUR/JPY?
👍 Like and Follow for more setups and breakdowns.

EUR/USD Short Opportunity – Rising Wedge + Retest + TargetThis technical setup on EUR/USD (1H timeframe) highlights a potential high-probability short opportunity based on a combination of price action, chart patterns, and key structural levels. The pair is showing signs of weakening bullish momentum and preparing for a bearish continuation.
🔎 1. Pattern Analysis: Rising Wedge Formation
The primary pattern visible is a Rising Wedge, which is traditionally a bearish reversal formation. It’s defined by:
Higher highs and higher lows, but both trendlines are converging, suggesting weakening bullish control.
Volume (not shown here) typically decreases within a rising wedge, further confirming a potential breakout.
This wedge formed after a previous sharp bullish recovery, acting as a continuation structure that often reverses.
In this case, the price formed multiple touches on both wedge boundaries, enhancing the reliability of the pattern.
🧱 2. Key Structural Zones:
Minor Resistance Zone (~1.1270–1.1285):
Clearly marked on the chart with a blue shaded zone.
Price has reacted from this level multiple times, validating it as a supply area.
The most recent attempt to break above this level failed, further confirming seller dominance.
Consolidation Zone (highlighted in yellow):
Prior to the wedge’s formation, price entered a consolidation phase.
Consolidation often precedes a breakout or a trend reversal. In this case, it provided a base for the rally that formed the wedge.
🔁 3. Breakout and Retest:
Price has broken below the lower support line of the rising wedge.
This breakout is a bearish signal and suggests the pair may now be ready for a stronger downside move.
The price appears to be retesting the broken wedge support, which is a classic confirmation move before continuation.
Retests of broken structures often offer low-risk, high-reward entry opportunities.
🎯 4. Trade Plan and Setup:
Entry Zone: Watch for bearish rejection or candle confirmation on the retest of the wedge support turned resistance.
Stop Loss (SL): Positioned just above the resistance zone, at 1.12887, protecting the trade against false breakouts or reversals.
Take Profit Levels:
TP1 – 1.10649: This level is a strong support zone based on previous price action and structural significance.
TP2 – 1.09670: The full measured move from the height of the wedge. This also aligns with historical support and psychological round number proximity (1.10).
🧠 5. Confluence Factors:
Technical Pattern: Rising wedge = bearish.
Support/Resistance: Multiple reactions to both the resistance zone and wedge trendlines confirm market memory.
Price Action: Break + retest = ideal entry confirmation.
Risk-Reward Ratio: Favorable, especially with conservative TP1 and aggressive TP2 levels.
Macro Context (optional): If posted during news week – potential USD strength based on rate expectations, NFP, or inflation.
⚠️ 6. Risk Management Tips:
Use a position size that aligns with your account risk tolerance (1–2% rule).
Wait for confirmation (bearish engulfing candle or rejection wick) before entering.
Always be prepared for invalidation. If price closes above the resistance zone, this idea is voided.

EUR/USD – Symmetrical Triangle Breakout & Bullish Continuation🔍 Overview
The EUR/USD pair has presented a classic and high-probability trading setup based on a symmetrical triangle formation, which recently experienced a bullish breakout. This pattern has formed after a period of compression and consolidation, creating a coiled spring scenario. Technical traders often watch for such breakouts as they signal the resumption of momentum with clear entry, stop-loss, and target zones.
This chart combines pattern recognition, key price action levels, psychological curve mapping, and structured trade planning. Let’s dive deeper into each component.
🧱 1. Chart Structure and Pattern Analysis
🔷 Symmetrical Triangle Formation
A symmetrical triangle is a continuation pattern formed when price action contracts between two converging trendlines.
This represents market indecision — both buyers and sellers are cautious, gradually narrowing the price range.
In this setup, the triangle has been forming since May 11, 2025, with a visible tightening of price action.
The chart shows well-respected upper and lower trendlines, confirmed with multiple touches on both sides.
🔼 Breakout Confirmation
A breakout occurred from the triangle's upper boundary around May 19, with a strong bullish candle closing above the structure.
Breakouts from symmetrical triangles often lead to sharp movements due to built-up pressure during the consolidation phase.
The volume typically expands at breakout zones (although volume is not displayed, price behavior implies it).
🔁 Retesting Area
Price may revisit the broken trendline (previous resistance → now support) for a retest before continuing higher.
This "retesting area" provides an ideal entry for those who missed the initial breakout.
Retests validate the breakout and confirm buyer strength.
🧱 2. Key Levels and Market Dynamics
🔻 Minor Resistance Zone (~1.13700–1.14100)
This zone has previously acted as a supply area where sellers pushed price down multiple times.
Price may hesitate or range within this area before breaking higher.
If bulls maintain control, breaking through this resistance zone will add confirmation to the bullish momentum.
📈 Target Projection: 1.14662
The target is derived by measuring the height of the triangle and projecting it from the breakout point.
It also aligns with a previous horizontal resistance level and psychological round number area.
This zone could act as a medium-term profit-taking level for swing traders.
🧠 3. Black Mind Curve – Market Psychology in Play
The "Black Mind Curve" is a representation of anticipated market sentiment and price flow.
It reflects a wave-like journey post-breakout — early breakout, pullback, bullish continuation, minor consolidation, and final push toward the target.
Such curves are used to forecast crowd behavior patterns, capturing how traders typically react post-breakout:
📌 Initial breakout ➜ Profit taking ➜ Retest ➜ Re-entry ➜ Final impulsive move.
🧮 4. Trading Strategy & Execution Plan
✅ Trade Setup
Entry:
Breakout Entry (already active)
OR Retest Entry near the triangle’s upper boundary for conservative traders.
Stop-Loss (SL) :
Placed just below the triangle’s lower boundary at 1.11726.
This level invalidates the breakout and prevents deeper drawdowns.
Take-Profit (TP):
Final target at 1.14662, offering excellent risk-to-reward potential.
📊 Risk-to-Reward Ratio:
Depending on the entry (breakout or retest), the RR can range from 1:2.5 to 1:3.5, which is ideal for swing or short-term position traders.
📚 5. Educational Insight
This pattern illustrates the importance of:
Price compression zones (triangles and wedges) as precursors to momentum trades.
Confirmation via breakout candles before entering high-conviction setups.
Patience during retests, which allow re-entries with defined risk and improved pricing.
Blending technical structure with psychological forecasting to stay aligned with market sentiment.
🔚 Conclusion
EUR/USD is showing a technically sound and psychologically supportive setup for bullish continuation. The symmetrical triangle has broken with strength, and price is heading toward key resistance with momentum.
If you're already long — consider holding until the target is hit or trailing stops to protect profits. If you're not in yet — watch for a retest to join the move with precision.
🔔 Always remember to manage risk effectively. No setup is guaranteed, but trading based on structure, confluence, and price behavior improves your edge

BTCUSD Rectangle Pattern Breakout + Bearish Retest & Target🧩 Chart Overview
This chart captures a well-defined rectangle continuation pattern forming within a rising channel on the 1-hour timeframe. This setup is a classic combination of horizontal and diagonal price structure interaction, offering valuable insights into potential market behavior and trade opportunities.
🧱 Structure Breakdown
Rectangle Pattern: Price action was trapped in a sideways consolidation phase between the resistance zone (~104,800 - 105,400) and the support zone (~101,200 - 101,800).
This rectangle followed a strong bullish rally, which often implies a continuation pattern. However, the lack of follow-through from bulls near the resistance led to repeated failures to break out, suggesting weakening momentum.
Rising Channel: Within this rectangle, price respected a rising trendline support and resistance structure, forming a parallel ascending channel.
Bearish Breakout: The significant event occurred when BTC broke down below both the horizontal support of the rectangle and the lower boundary of the rising channel, triggering a structural shift from bullish to bearish.
🔁 Retesting Phase – What’s Happening Now
After the breakdown:
Price pulled back toward the prior support zone, which is now acting as resistance (a classic example of the support-turns-resistance principle).
This is commonly referred to as a retest, which validates the breakout and offers a lower-risk entry point for traders looking to short.
The retest area (around 101,500 - 102,000) is crucial. If price fails to reclaim this level and prints bearish confirmation (e.g., rejection wick, bearish engulfing candle), it increases the probability of downward continuation.
🎯 Trade Setup (Short Bias)
Entry Zone: 101,500 – 102,000 (on retest rejection confirmation)
Stop Loss: Above 103,000 (above prior highs and invalidation point)
Target 1 (TP1): 99,347 – key psychological and horizontal support level from prior structure
Target 2 (TP2): 97,277 – measured move of the rectangle height projected downward, aligning with previous demand area
This setup offers an attractive risk-to-reward ratio, assuming proper trade management and confirmation-based entry.
📊 Additional Technical Confluences
Bearish Momentum: The aggressive breakdown candle shows strong seller interest and increased volatility.
Volume: If confirmed with high selling volume during the breakdown and low buying volume during the retest, the move gains more credibility.
Trend Reversal Signals: The break of the channel and the rectangle support indicates potential trend reversal from short-term bullish to bearish.
RSI & Momentum Indicators (optional): Traders may use tools like RSI or MACD to confirm momentum shifts during retest.
📉 Psychological and Price-Level Significance
101,500 was a strong intraday support zone throughout the consolidation phase. Once broken, it flips polarity and acts as resistance.
The round-number level of 100,000 is always a psychological magnet for BTC. It often acts as a bounce or breakout zone, so traders should watch price behavior near this area closely.
Deeper demand may emerge around 97,000 – 96,500, which can serve as an extended target or reaccumulation zone depending on broader market conditions.
⚠️ Risk Management & Final Thoughts
This setup is high-probability only if the retest confirms rejection. Avoid early entries or assumptions before confirmation.
Always use proper stop-loss placement to avoid whipsaws or fake-outs.
Manage position sizing based on account size and risk tolerance.
News events or macro data can override technicals, so be aware of upcoming economic releases or sentiment shifts.
🧵 Conclusion
Bitcoin is showing clear signs of short-term weakness following the breakdown of a long-standing consolidation range within a rising channel. The ongoing retest provides an ideal area for short positioning, with clearly defined invalidation and profit targets.
✅ If bears defend the retest zone, expect downside continuation toward 99.3K and possibly 97.2K.

BTCUSD - Bullish Breakout from Falling Wedge Pattern | Target Bitcoin has broken out of a Falling Wedge Pattern on the daily timeframe, signaling a bullish reversal that aligns with the broader market sentiment. Let’s examine this setup in detail, from pattern recognition to key support/resistance levels and trade planning.
🧠 Pattern Analysis – Falling Wedge Formation
The chart displays a textbook Falling Wedge, which is a bullish chart pattern that typically forms after a downtrend. It’s characterized by converging trendlines sloping downward, showing a slowdown in bearish momentum and a potential reversal point.
Formation Period: This wedge developed over a multi-week period (Feb–April 2025).
Structure: Each swing high and swing low forms lower highs and lower lows inside the wedge.
Breakout Confirmation: Price has decisively broken above the upper trendline of the wedge, validating a potential bullish continuation.
👉 Falling Wedge patterns are often seen near the end of a corrective move and suggest accumulation before a rally.
🔎 Key Technical Zones
🔸 Resistance Zone (~$103K–$105K)
This area has historically acted as a strong resistance zone.
Price is currently consolidating just below this region, indicating a possible breakout retest or a temporary pause before the next leg up.
🔸 Trendline Support
A new rising trendline has emerged post-breakout, acting as dynamic support.
Price has respected this trendline multiple times, forming higher highs and higher lows — a strong bullish signal.
🔸 SR Interchange Zone (~ GETTEX:92K –$94K)
Previously acted as resistance; now flipped to support.
This makes it a critical level where bulls may defend positions, and a good place for a stop-loss.
🔸 Support Zone (~$75K–$78K)
Major historical support area where the wedge bottom formed.
Buyers stepped in aggressively in this zone during the final leg of the wedge.
🎯 Trade Plan
This setup offers a clearly defined risk-reward profile based on breakout trading principles.
📌 Entry Idea:
Current consolidation near resistance offers two entry strategies:
Aggressive Entry: Near current price, anticipating breakout continuation.
Conservative Entry: On a confirmed breakout above $105K or a pullback to trendline support around GETTEX:98K –$100K.
✅ Target: $112,116
Measured by projecting the height of the wedge from the breakout point.
Also aligns with a previous key structural high, adding confluence to the target.
⛔ Stop Loss: $93,294
Strategically placed just below the SR interchange zone and rising trendline.
Protects against potential fakeouts or trendline breaks.
📉 Risk Management
Risk/Reward Ratio: ~2:1 or higher depending on entry point.
Always use proper position sizing.
Be prepared to cut the trade if price closes below trendline and SR zone on high volume.
🔮 Outlook and Strategy
This breakout suggests Bitcoin may be entering a renewed bullish phase. If macro conditions remain favorable and price sustains above key support zones, we could see continuation toward the $112K region.
However, it’s important to monitor:
Volume: Watch for rising volume on any breakout above the resistance zone.
Market Sentiment: External factors (e.g., news, ETF flows, regulatory updates) may influence the move.
Trendline behavior: A break and close below the rising support line may invalidate the setup.
💬 Final Thoughts
This is a technically clean setup combining a bullish pattern breakout, supportive structure (trendline & SR zones), and a logical target based on classical charting. If Bitcoin maintains current momentum, traders may see significant upside in the coming weeks.

BTC Bullish Pennant Breakout – Eyeing $107K TargetBitcoin (BTC/USD) has recently demonstrated strong bullish structure following an extended consolidation phase. The current price action suggests a textbook bullish pennant breakout, which often indicates trend continuation in strong markets. This technical setup follows a period of accumulation and consolidation between March and April, with a well-defined pennant formation leading into the breakout in early May.
Technical Analysis:
Historical Context & Structure:
From mid-February to March, BTC experienced significant downward pressure, eventually finding major support in the $76,000–$78,000 zone, which is clearly outlined on the chart as a key support level.
This support zone initiated a reversal, forming the base of a new bullish leg that marked the beginning of the next trending phase.
Consolidation Phase – The Ellipse Region:
The price action within the elliptical region (mid-March to late April) reflects accumulation behavior, with multiple rejections on both upper and lower bounds, indicating balance between buyers and sellers.
This phase formed a foundational structure, setting up the stage for a breakout pattern.
Pennant Formation (Late April – Early May):
The price sharply rallied in late April, breaking out of the consolidation and moving into a tight triangular pennant pattern — a classic continuation formation.
This bullish pennant features converging trendlines, lower volume, and diminishing volatility as price consolidates — all typical characteristics.
Breakout and Retest:
The breakout from the pennant occurred on high momentum with strong bullish candles.
Post-breakout, the price approached the resistance zone (~$103,000–$105,000) and is currently attempting to establish support at this level.
This retest adds validity to the breakout and opens the door for further upside continuation.
Trade Parameters:
Entry Zone: Breakout above the pennant (~$99,000–$100,000), confirmed by momentum.
Resistance Zone: $103,000–$105,000 (currently being retested).
Target (Measured Move):
Using the height of the pennant pole (~$20,000 move from $80K to $100K), the projected target lies near $107,307, aligning with horizontal resistance.
Stop Loss:
Set at $93,344, just below the pennant’s lower boundary. This level also aligns with recent structural support and invalidation of the pattern.
Risk/Reward Ratio:
Approx. 1:2.5+, offering a favorable setup assuming trend continuation.
Additional Notes:
Volume:
Although not shown, breakouts from pennants are ideally confirmed by an increase in volume, indicating market conviction. Volume confirmation is highly recommended for trade confirmation.
Market Context:
This setup aligns with broader bullish sentiment in the crypto space and may be reinforced by macroeconomic or ETF-related developments. However, risk management remains key, especially around psychological levels and news-driven volatility.
Conclusion :
Bitcoin is currently in a strong technical position. The breakout from the bullish pennant pattern following prolonged consolidation signals continuation of the prevailing uptrend. Traders should watch for sustained price action above $103K for confirmation. A pullback or retest toward this level can present re-entry opportunities before a potential move toward $107K. Tight risk management is advised with stops below $93K.

USD remains weak across the board. EUR, GBP & JPY Bullish.Not much action due to the extended market break and Easter weekend but I expect more USD selling across the board in the coming weeks ahead.
Long positions are sitting tight but two areas I am keeping an eye on are 1.1200 as a base support and 1.1500 as the resistance hurdle we need to clear in order to open up the gates to 1.2000+
GBP/USD is still a bullish case for me as the short term resistance may be cracking and I'm still expecting for the JPY to advance against the USD.
It's good to get a break from the market volatility but I surely expect it to resume in the coming week!
Good Luck & Trade Safe!

EUR/JPY Falling Wedge Breakout | Bullish Potential Ahead🔍 Chart Overview: EUR/JPY – Daily Timeframe
This chart illustrates the price action of the Euro against the Japanese Yen and highlights a Falling Wedge Pattern developing over several months. This is a classic bullish continuation/reversal setup, supported by key technical levels.
📐 1. Chart Pattern: Falling Wedge
A falling wedge is a bullish chart pattern that occurs when the market consolidates between two downward-sloping trendlines.
Characteristics Seen in the Chart:
Converging Trendlines: The upper (resistance) and lower (support) boundaries are both sloping downward, indicating a narrowing price range.
Volume (not shown) usually decreases during the formation, followed by a surge on breakout.
Multiple Touch Points: The price action respects both boundaries multiple times, confirming the pattern's validity.
🏛️ 2. Key Levels
✅ Support Level (Demand Zone):
Marked around 156.000 – 158.000
Multiple bounces from this area, indicating strong buying interest.
Aligned with the lower wedge trendline and historical price reaction zones.
🚫 Resistance Level (Supply Zone / Breakout Zone):
Around 164.500 – 166.000
Price repeatedly failed to break this level, confirming it as a strong supply area.
Confluence of horizontal resistance and the upper wedge boundary.
📊 3. Trade Setup
💼 Entry Strategy:
Confirmation Buy: Enter a long position upon a daily candle close above the wedge resistance (around 166.000).
Aggressive traders may consider an earlier entry near the wedge’s support with a tight stop.
🎯 Target:
The projected target is 172.962, calculated based on the height of the wedge pattern added to the breakout point.
This aligns with a previous swing high area, serving as a logical profit-taking zone.
🛑 Stop Loss:
Positioned at 155.576, just below the key support zone.
This allows the trade room to breathe while protecting against a full pattern failure.
⚖️ 4. Risk Management
Risk-to-Reward Ratio (RRR): Target around 172.962 and Stop Loss at 155.576 offer a favorable RRR of approximately 2.5:1 or more, depending on entry.
Position Sizing: Use appropriate lot size based on your account risk tolerance (e.g., 1-2% of equity per trade).
📅 5. Timeframe Outlook
Medium to Long-Term Setup: Since this is a daily chart, the trade may take weeks to months to fully play out.
Patience and proper trade management are essential.
🔎 6. Additional Notes
Retest Opportunity: If price breaks out, look for a retest of the resistance zone as new support before continuation to the upside.
Fundamental Factors: Keep an eye on EUR and JPY economic data, ECB and BoJ policy announcements, and global risk sentiment, which can influence the pair.
🧭 Professional Takeaway
This is a textbook bullish falling wedge pattern within a well-defined technical structure. The chart provides:
A clear pattern breakout level,
Strong historical support/resistance zones,
A defined risk management plan,
And a realistic price target based on technical projection.
If you are a swing trader or position trader, this setup offers a high-probability opportunity with favorable risk-reward dynamics—provided a breakout is confirmed.

JPY/USD Daily Chart – Falling Wedge Breakout & Bullish Target🔍 Full Technical Analysis of JPY/USD (Daily Timeframe)
🧭 Overview
The chart shows a sophisticated price structure unfolding over several months. A falling wedge reversal pattern formed during a sustained downtrend, which later transitioned into a bullish breakout and continuation. This analysis provides insights into market behavior, price psychology, and a high-probability trading opportunity supported by classical technical analysis principles.
🔶 1. Market Context & Structure
Before diving into the pattern, it’s essential to understand the macro structure of the chart:
The pair experienced a strong bearish move from around August to December 2024, marked by lower highs and lower lows.
During this decline, volatility gradually decreased, which often indicates seller exhaustion.
A reversal zone emerged near a major support region — historically significant and previously tested.
🔷 2. The Falling Wedge Pattern (Reversal Signal)
A falling wedge is a bullish reversal pattern that forms when price is in a downtrend but begins to consolidate within converging trendlines. This pattern typically signals that the downtrend is losing momentum and a breakout to the upside is imminent.
📌 Characteristics of This Wedge:
Downward Convergence: The highs and lows begin to narrow over time, indicating reduced selling pressure.
Volume Decline (Implied): Though not displayed, falling wedges usually see volume dry up before breakout.
Duration: This wedge developed over several months (October 2024 – January 2025), lending strength to the pattern.
False Break Attempts: Several lower spikes failed to break the support, showing buying interest building.
✅ Bullish Breakout:
The breakout occurred decisively in late January 2025, with a large bullish candlestick closing above the upper wedge boundary — a confirmed breakout.
Post-breakout, the price rallied strongly, indicating that buyers were firmly in control.
🔷 3. Support & Resistance Zones
🔽 Support Zone (Demand Area):
Range: 0.006300 – 0.006400
Historical pivot zone where price previously reversed, now serving as a demand base.
The lower wick rejections near this zone reinforce it as a high liquidity zone for buyers.
🔼 Resistance Zone (Supply Area):
Range: 0.006850 – 0.006950
This area capped price during several prior rally attempts, making it a key breakout point.
Once price broke above this zone, it became a support flip zone, indicating trend reversal confirmation.
🎯 Target Level:
Marked at 0.007126, derived from a measured move:
Measure the height of the wedge at its widest point.
Project this vertically from the breakout level.
This target aligns with psychological round numbers and prior resistance, adding confluence.
🔶 4. Post-Breakout Price Action: Bullish Retest
A breakout is only the first part of a trade; the retest phase confirms the move and offers an optimal entry.
🔁 Retest Details:
After reaching the resistance zone, price pulled back, testing both:
The broken wedge trendline (now acting as dynamic support).
The horizontal structure support zone near 0.006650–0.006700.
A bullish engulfing candle or similar reversal pattern formed at this level — a classic retest entry.
📌 Trendline Respect:
A rising dotted trendline was drawn from the breakout low through higher lows.
This line acted as price memory and was respected multiple times, reinforcing the uptrend.
🔷 5. Trade Setup Breakdown
This is a swing trade setup based on pattern breakout, structural confluence, and trend continuation. Here's how it’s structured:
Component Details
Pattern Falling Wedge (Reversal)
Trade Bias Long (Buy)
Entry Price ~0.006700
Stop Loss 0.006614 (below trendline)
Target Price 0.007126 (measured wedge move)
R/R Ratio Approx. 3:1
Timeframe Daily (Medium-term swing)
🧠 6. Market Psychology & Behavior
Understanding the sentiment behind the candles is critical:
❗ Before the Breakout:
Sellers dominated but with weakening momentum.
Each push down was met with buying strength, seen in long wicks and smaller-bodied candles.
✅ At the Breakout:
Buyers overwhelmed sellers, often with a volume spike and wide-bodied green candle.
This is usually driven by institutional positioning and stop-loss triggering from short-sellers.
🔁 During the Retest:
Some retail traders exited prematurely, fearing a fakeout.
Smart money used the dip to accumulate positions, confirmed by the bounce from trendline.
🔼 Continuation Rally:
Strong continuation candle signals momentum traders entering.
Break above resistance signals a shift in sentiment and structure.
🛠️ 7. Strategy Notes & Professional Tips
📌 Risk Management:
Never risk more than 1–2% of capital.
Use dynamic trailing stop if price breaks above target zone.
📌 Trade Confirmation Ideas:
Look for volume spikes on breakout candles.
Use RSI or MACD divergence to confirm reversal (optional).
Look for candlestick patterns (engulfing, pin bar) on retests.
📌 Exit Plan:
Partial exit at key resistance.
Full exit at projected target or if price forms reversal signs (e.g., doji at resistance).
✅ Final Summary
This JPY/USD chart demonstrates an exemplary price action-based trading setup rooted in:
A well-formed falling wedge (bullish reversal).
Clean breakout + retest + continuation structure.
Multiple confluence factors: trendline, horizontal S/R, pattern projection.
Professional-grade risk/reward profile with a logical entry, stop, and target.
This kind of setup is highly favored among swing traders, price action purists, and institutional-level strategists due to its clarity and predictability.

XAGUSD Weekly Analysis – Double Top Formation & Breakdown🧱 Chart Pattern Identified: Double Top Formation
The chart displays a classic Double Top pattern, a bearish reversal structure typically found at the end of an uptrend. This pattern forms when price reaches a resistance level twice, fails to break above it both times, and eventually breaks the neckline/support level, confirming a shift in market sentiment.
🔍 Key Components of the Chart:
1. Resistance Level (Tops) – ~$34.25
The market formed two significant peaks around the same level — labeled Top 1 and Top 2.
This level has proven strong resistance, as price was rejected both times after testing this zone.
This zone is marked with a light orange rectangle and a horizontal blue line labeled "Resistance Level".
2. Support Level (Neckline) – ~$28.80
This level served as the neckline of the Double Top.
After the second top, the price sharply declined and is currently approaching this key support zone, highlighted again in light orange.
A clean break and close below this zone on the weekly timeframe will be a strong confirmation of the bearish reversal.
3. Trendline Break – Bearish Shift in Momentum
A rising black dashed trendline supported the prior uptrend.
Price action has now broken below this trendline with strong bearish momentum, indicating that buyers have lost control.
This trendline break adds confluence to the bearish setup, supporting the validity of the pattern.
4. Bearish Projection Target – ~$22.47
The target is projected using the height of the Double Top pattern.
Measured from the resistance level ($34.25) to the support ($28.80), the vertical distance is ~5.45 USD.
Subtracting this from the neckline gives us a projected target:
28.80 - 5.45 = ~23.35 (rounded down to ~22.47 for technical cluster support).
This target area is marked with a blue arrow and labeled "Target" near the horizontal support at $22.47.
5. Stop Loss – ~$34.25
The logical invalidation point is placed just above the resistance zone and the second top.
A move above this level would invalidate the double top pattern, signaling that bulls have regained control.
📈 Price Action and Candlestick Behavior
The strong bearish weekly candle that broke below the trendline shows a decisive shift in sentiment.
The candle's large body and long range confirm institutional selling interest.
Volume (if shown) would likely support the move, but even price structure alone is highly telling here.
🎯 Trading Strategy & Setup
Component Details
Entry On a confirmed break and retest of $28.80 support (neckline)
Stop Loss Above $34.25 (Top 2)
Target $22.47
Risk/Reward ~1:2 or better
Timeframe Weekly (Swing Trade)
Bias Bearish
🧠 Concluding Notes
This chart provides a high-probability bearish setup rooted in classical charting principles. The Double Top is one of the most reliable reversal patterns, especially when:
Formed after a prolonged uptrend (as seen here),
Confirmed with a trendline break,
Followed by strong bearish momentum toward the neckline.
Traders should monitor the support zone around $28.80 closely for a potential breakdown. If confirmed, the target near $22.47 becomes a realistic medium-term objective.

Bitcoin (BTC/USD) – Bearish Breakdown & Key Levels to WatchMarket Overview:
Bitcoin is trading at $84,185, showing a +1.63% increase. The price action suggests a potential breakout towards the upside.
🔹 Chart Structure:
BTC has been consolidating in a range-bound structure after a sharp upward move.
Previous rising wedge patterns led to corrections, but the price is holding key support levels.
A breakout setup is forming with a target towards $88,500 – $90,000.
🔹 Key Levels to Watch:
✅ Resistance: $85,249, $86,934, $88,500, $90,000
✅ Support: $82,000, $81,400
🔹 Potential Trade Setup:
📈 Bullish Scenario:
If BTC holds above $84,000, a push towards $86,500 – $88,500 is likely.
A breakout above $88,500 could lead to $90,000+.
📉 Bearish Scenario:
If BTC rejects $85,000, a pullback to $82,000 – $81,400 may occur before another move up.
🔹 Conclusion:
Bias: Bullish above $84,000
Target: $88,500 – $90,000
Invalidation: Below $81,400
Would you like a more detailed trade plan with stop-loss and entry points? 🚀

EUR/USD – Bullish Flag Pattern & Trade SetupTechnical Analysis & Trade Plan for TradingView Idea
This chart illustrates a Bullish Flag Pattern on the EUR/USD 1-hour timeframe, suggesting a potential continuation of the prevailing uptrend. Below is a detailed breakdown of the market structure, key levels, and a professional trading strategy.
📌 Chart Pattern: Bullish Flag Formation
The Bullish Flag is a continuation pattern that forms after a strong upward price movement, followed by a short period of consolidation within a downward-sloping channel. It signals a brief pause before the trend resumes.
Flagpole: The sharp price increase before the consolidation.
Flag: The corrective downward movement forming a small parallel channel.
Breakout Potential: A confirmed breakout above resistance could lead to a further bullish rally.
🔍 Key Technical Levels & Market Structure
🔵 Resistance Level (Supply Zone)
The upper boundary of the flag pattern acts as resistance.
A breakout above this level could trigger a strong buying opportunity.
🟢 Support Level (Demand Zone)
The lower boundary of the flag provides support.
Price is currently testing this zone, which is a critical decision point.
🎯 Target Price: 1.14544 (Projected Move)
The price target is calculated based on the height of the flagpole added to the breakout point.
This aligns with a previous significant resistance area.
📈 Trading Strategy & Execution Plan
✅ Entry Criteria:
A confirmed breakout above the flag's resistance level with a strong bullish candlestick.
Increased trading volume supporting the breakout.
🚨 Risk Management:
Stop Loss: Placed below the support zone of the flag to manage risk in case of a false breakout.
Take Profit Target: At 1.14544, aligning with the measured move of the flag pattern.
📊 Trade Confirmation Indicators:
RSI (Relative Strength Index): A reading above 50 confirms bullish momentum.
Moving Averages (50 EMA/200 EMA): A bullish crossover would strengthen the buying signal.
Volume Analysis: A breakout should be accompanied by high trading volume for confirmation.
⚠️ Potential Risks & Alternative Scenarios
Fake Breakout: If the price breaks out but lacks volume, it could be a false signal.
Bearish Reversal: If price breaks below the support zone, the bullish flag setup becomes invalid.
Market Sentiment Shift: Unexpected news events can impact price movement.
📝 Summary
The EUR/USD pair has formed a Bullish Flag Pattern, signaling a possible continuation of the uptrend.
A breakout above the resistance level would confirm the pattern and provide a strong buying opportunity.
Risk management is essential, with a stop loss placed below the support level.
Final Target: 1.14544, based on the flagpole’s measured move.
💡 Conclusion: A well-structured breakout above resistance could lead to a bullish rally toward 1.14544. However, patience and confirmation are key before entering the trade.
