GALAXYSURF - FLAG AND POLLFlag and Poll Pattern Formation in Galaxy Surfactant
Entry - 3070
SL - 10%
Target - As highlighted in chart
Chartpatterntrading

XAUUSD NEXT BIG MOVeseeing Gold break all time high is a positive indication that we could see possible further moves to the upside, also the current range between 2488 and 2527 is like a warm up to the upside. i will be waiting for a last drop to the trendline for a buy opportunity to 30000.

#NIFTY Intraday Support and Resistance Levels - 21/08/2024🔔 Nifty Update for Today:
📈 Gap-Up Opening Expected:
Expected Opening Level: Near 24700
Key Level: 24700
Potential Upside Target: 24850
Nifty is expected to open with a gap up near the 24700 level today. If the index sustains above this level after opening, we could witness a strong upside rally, potentially reaching up to 24850 during the session.
📉 Watch for Downside Risks:
Critical Reversal Level: 24650
Support Level: 24500
However, if Nifty starts trading below 24650, downside movement may occur. The 24500 level will serve as an important support in today’s session.

Gold will Bounce Today!For tomorrow, the resistance areas are: 2509 and 2510.The buying level expected for today are 2512 or 2513. And also could from the resistance area. These levels will perform tomorrow, and we should also keep an eye on geopolitical events. Additionally, tomorrow we have Unemployment Claims news affecting us.

BTC Technical analysisThis 2-hour CRYPTOCAP:BTC chart is showing a classic inverse head and shoulders pattern, which typically signals a bullish reversal. We can see that the right shoulder is currently forming, and if the pattern plays out, the price target could be around $64,000. The RSI has dipped below the midline, indicating a brief pullback, but it’s still in a healthy range. The MACD is in a bearish phase, but it could be signaling a potential bottom. Keep an eye on the neckline around $59,000; if BTC can break above that, it could confirm the bullish move.

Oil slips again and Geopolitical tensions rise In my last post about Oil, I said that "Oil has a good possibility to get back to the range of 83.50 and 84.50", but also "Oil had broken 3 LH's that were created between July 22nd, 2024 and August 1st, 2024". I also mentioned that "we can see a pullback in the ranges of 78.84 and 77.12". In my outlook at the top of the week, I said that I was on the buyer's side until price showed otherwise. Now, price is showing signs of not continuing buys but settling into seller's territory.
In this latest out look, I'm going to give you my insight on where the market can possibly go going into next week. Around early 6AM, price broke the HL from last Friday that shot Oil up all the way to the 77.89 area on this past Monday. On Tuesday, price created the "M" formation signaling that sellers were now starting to step in that sent the market selling for the rest of the week. On today Friday, August 16th, Price hit a demand area that sent price shooting past the HL that i stated early in my typing. This could potentially mean that we are now in seller's territory for a minute depending on how the markets may move going into next week. We did leave a gap above after yesterday's sell movement that can send price back that way from Monday going into Tuesday depending on market conditions. I believe if price goes back that way it can be just to create a LH, IF price doesn't make buying structure. Right now my current outlook is bias until the market finds its footing from Monday-Tuesday.
Amid Oil selling from the technical side, Oil is facing rocky streets from fear of the United States economy as investors are getting ready to brace for interest rate cuts and other things going on in different countries. From Fed Powell, to Iran retaliation, and to China's weak economy, Oil is in some unpredictable territory especially with a lot of geopolitical tensions rising. Next week news combined with technicals will give a greater outlook on Oil.

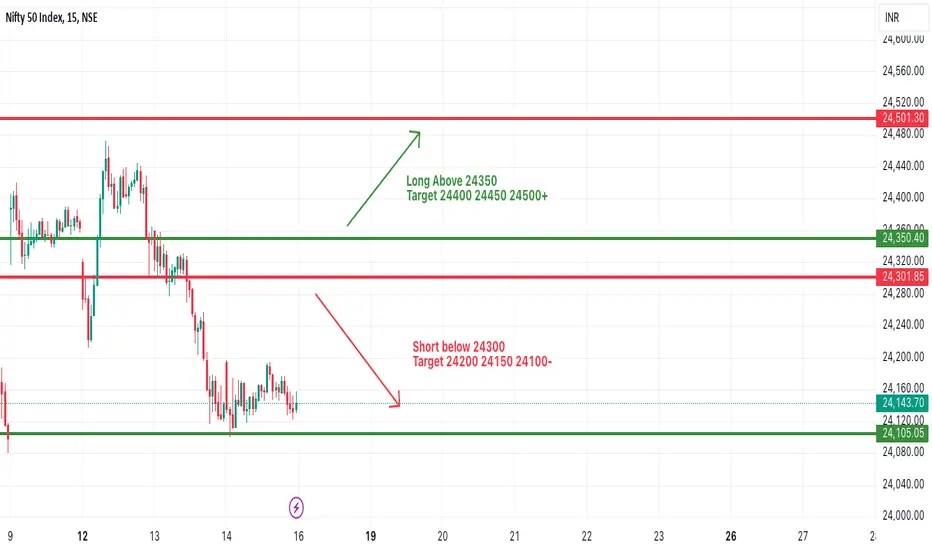
#NIFTY Intraday Support and Resistance Levels - 16/08/2024Today expected gap up opening in nifty near 24350 level. After opening if nifty starts trading above 24350 level then expected upside rally upto 24500 level. Downside possible upto 24100 if nifty starts trading below 24300 level. This can be expected for more 100-200 points if give breakdown of 24100 level in today's session.
Buy ITC aggressively CMP 492, Target-580 within a month.Technically we see a formation and breakout of Bullish Pennant chart pattern. Also we can confirm its strength from being continuously above all the short term averages even in market downside. ITC is a star performer and our last buy call at the bottom price of 425 worked very well. At higher levels also, surprisingly again it is in buy radar after formation and breakout of a beautiful chart pattern.
Last month Quant Mutual Fund bought ITC shares worth 3,669 crores. This is a big plus news as Quant MF are trending in MF industry due to their good buying decision and consistently outperforming the market benchmark returns. All the big institutions and Brokerage house already gave the target of 550 plus and technically it is confirming the same.
We feel that still there is a lot of value unlocking left in this counter due to their multiple businesses working so well as compared to the peers in the respective industry and still it is just valued majorly on based of Tobacco business. Demerger going ahead is the key to value unlocking and this share can quote even value of 750-800 soon and this is not hypothetical figure but based on real possible valuation in near term as well. So, buy this stock aggressively and you might think that the stock in last month already gone up and you might wait for the dips which might cost you a good opportunity as the big hand may not give you the dips unless there is a big fall in nifty itself. With regards to Nifty, it can give strong positive contribution to nifty movement and support nifty if other nifty stocks correct.

#GER30 bearish continuation moveAfter an impulsive bearish move in the GER30 last week, the price is now forming a bullish corrective move and a rising wedge pattern, which typically has a bearish bias.
Additionally, the price has reached the 1-hour 200 EMA, which could act as dynamic resistance. There's also a bearish divergence between the price and the momentum oscillator on this timeframe.
These factors together suggest a bearish outlook.

NZDCAD 4 Hours Technical Analysis ProjectionWe have just spotted a good selling opportunities on NZDCAD 4 Hours Chart as price printed a double top formation at a structural level. This is one of the setups we don't want to miss out on.
1 Hour chart also shows a bearish corrective formation which may give room for sellers to jump onboard.

#Coffee beginning of another rallyPrice recently managed to break above the bearish trendline that previously kept it lower during the recent bearish corrective move.
Now that the price has broken above this counter-trend trendline and formed a bullish impulsive move, we can wait for wave 4 to complete and try to benefit from the fifth wave.
Let me know if you would like me to publish an analysis in a lower timeframe on this chart to take advantage of this rally.

#WHEAT chart pattern analysisAs can be seen, price managed to break above an ending diagonal and established a bullish structure in 1H and 4H timeframe.
Therefor, I would be looking to buy a bearish corrections unless the way of evidence show or prove to me otherwise.
Let me know if you would like me to publish an analysis in a lower timeframe on this chart to take advantage of this rally.

EUR/USD Trade Setup on 4-Hour TimeframeEUR/USD has formed a descending channel on the 4-hour timeframe, characterized by lower lows and lower highs following a strong breakout.
currently waiting for a retest of the broken lower high structure level, which is also aligning with the Fibonacci retracement level.
Once price has reached this level we will scale down to the lower timeframe of 30 mins to find our entry based on candlesticks patterns

Descending Channel on USD/CHF @ D1This descending channel pattern has formed on the daily chart of the USD/CHF pair following a rising trend that lasted from the start of the year till May 1. The pattern's borders are marked with the yellow lines. The potential entry level is at the cyan line. The potential take-profit level is at the green line. The stop-loss can be set to the low of the candle preceding the breakout candle. It's not shown SL isn't shown on the chart. I will ignore bearish breakouts from this descending channel formation.

GOLD Breakout Imminent? Key Levels & Patterns to Watch Now!Technical Breakdown of XAUUSD
Overview
The chart depicts the price movement of Gold Spot (XAUUSD) against the US Dollar on the 1-hour timeframe, highlighting key technical patterns and support/resistance levels. The analysis aims to provide insights into potential price actions based on historical movements and current market conditions.
Key Patterns and Levels
Descending Channel:
The price has been moving within a descending channel, characterized by lower highs (LH) and lower lows (LL). The channel is defined by two parallel trendlines (in white) that indicate a downtrend.
The descending channel suggests bearish momentum as the price continues to make lower highs and lower lows.
Support/Resistance Levels:
Support/Resistance Inside Channel: A notable level within the channel where the price has repeatedly found support or resistance, marked by dashed horizontal lines.
4HR LQZ (Liquidity Zones): Two critical liquidity zones at 2447.5 and 2432.4, acting as major support and resistance levels. These zones are crucial as they represent areas where significant buying or selling activity has occurred.
Highs and Lows:
Higher High (HH): The highest point reached before the price entered the descending channel, indicating a peak in bullish momentum.
Lower High (LH): The lower high within the descending channel, showing the continuation of the bearish trend.
Daily Bull Flag:
The price is approaching the upper boundary of a daily bull flag pattern (marked in yellow), suggesting a potential bullish breakout if the price can sustain above this level.
Current Market Conditions:
Support/Resistance Retest: The price recently tested the resistance level at 2474.9 within the 4HR LQZ and pulled back slightly, indicating the presence of sellers at this level.
Potential Breakout: The price is attempting to break above the descending channel and the 4HR LQZ, which could signal a reversal of the downtrend if confirmed by sustained buying pressure.
Additional Insights:
Dollar Interaction: The inset chart shows the US Dollar index coming into a support/resistance level within its own channel, providing additional context to the gold movement.
Market Sentiment: The overall market sentiment and external factors such as economic data releases and geopolitical events can also influence the price movement of gold.
Conclusion:
The XAUUSD is currently at a critical juncture, testing key resistance levels within a descending channel. A successful breakout above the 4HR LQZ and the descending channel could signal a bullish reversal, while failure to break these levels may result in continued bearish pressure.

BTC As shown in the 4-hour time frame, a strong trendlineAs shown in the 4-hour time frame, a strong trendline can be seen underneath, and at the current position, the trendline and the 0.236 fib level indicate that the price may rise to 70K from this limit. If this limit is breached and the price falls, the price may also fall to the 63k level.🌈✨
BINANCE:BTCUSDT.P

#gold cup and handle chart patternAs seen in the chart, there is a strong resemblance between the textbook cup and handle chart pattern formation and the pattern we are observing in the 4H timeframe gold chart.
As a result, there is a possibility that after the current bearish corrective move finishes, we might witness another rally to the upside.
The only drawback to the chart pattern formation in gold, compared to the textbook example, is that the bearish move has formed a 5-wave impulse rather than a 3-wave corrective abc formation. We could interpret this as an abc zigzag formation, but for this pattern to complete, we need a 3-wave bullish up move followed by another bearish move to complete leg c of an abc corrective bearish move, as illustrated in the chart with an arrow.
Let me know if you would like me to publish an analysis in a lower timeframe on this chart to take advantage of this rally.

GOLD - expensive area, what's next??#GOLD.. well guys as you can see market hold his trinangle for 5th time and now again at his neck line, keep close it and if market hold it then again bounce expected from here,
but keep in mind that below that CUT N REVERSE keep in hand.
good luck
trade wisely

LONGING $NVDAWhy I am bullish on NASDAQ:NVDA
On the 4 hour timeframe:
- Retesting support zone
- Bottom of bullish pennant chart pattern
- Wick-to-body forecast is bullish
My personal trade:
Stop Loss / Take Profits:
- Entry: $118.00
- Take Profit: $136.16
- Stop Loss: $114.97

NIFTY - high are placed? what's next??#NIFTY.. well as you can see guys everytime market make a channel and then broke and place another high. and now gain market were trade in a channel and then boke it.
now we have 24060 at downside and upside we have 24600 around.
so now keep close it market hold 24600 then drop expected and downside areas are mentioned on chart.
good luck
trade wisely

GRT ready for breakoutGRT looks bullish and now we need to wait for a breakout. We can see that GRT is forming an ascending triangle pattern.
Expecting atleast 15% up to 0.259/ 0.26
If we can stay above the prices above we can go higher to 0.36 expecting a 60%+ profit.
Watch carefully, what are your thoughts about GRT?
This is no financial advice, always DYOR.

IFCI Giving a Strong BreakOutIFCI Ltd. operates as a non-banking finance company, which engages financing activities that cover various projects. It supports projects such as airports, roads, telecom, power, real estate, manufacturing, services sector and such other allied industries.The company was founded on July 1, 1948 and is headquartered in New Delhi, India.
Stop-Loss: 65
Target: 85
Consider exiting half your position after a 10-12% gain and hold the rest to capture the trend.
Disclaimer: This information is for educational purposes only and should not be construed as financial advice. Always conduct your own research or consult with a professional advisor before making any investment decisions.

ENGINERSIN giving a good BreakoutEngineers India Ltd. engages in providing engineering, technical, and consultancy services. The firm operates through the following segments: Consultancy & Engineering Projects and Turnkey Projects. The company was founded on March 15, 1965 and is headquartered in New Delhi, India.
Stop-Loss: 268
Target: 350
Consider exiting half your position after a 10-12% gain and hold the rest to capture the trend.
Disclaimer: This information is for educational purposes only and should not be construed as financial advice. Always conduct your own research or consult with a professional advisor before making any investment decisions.
