DXY SELL TRADEFrom technical analysis we can see a huge expansion to the upside after the release of the NFP data .
what i would like to see is the candle reaching 105.550 level liquidity void on daily chart to consider a short
MY TRADE
SELL 105.550
TAKE PROFIT 97.000
SL 106.550
TERMS AND CONDITIONS APPLY
USE PROPER RISK MANAGEMENT
Chartpatterntrading

XAUUSD Again Buy now !!!!!Discover an enticing Buying opportunity in GOLD as it undergoes a critical retest of a key resistance area. With market analysis, technical indicators, and price action as your allies, evaluate the potential upside move. Stay vigilant and informed to capitalize on this precious metal's market dynamics.

YGG/USDT NEW Set Up 29/03/2024YGG/USDT G-Money's short version analysis based purely on technical analysis only, no nonsense or "BS":
Stop Loss (SL): @ 1.3685 USDT
Entry Point: @ 1.1887 USDT
Take Profit (TP): 0.8232 USDT
PS: ( 1 ) Remember: recommended re-enter area is between Stop Loss (ST) & Entry Point.
( 2 ) If price went half way between Entry Point & Take Profit (TP), be patient please & wait for price retracement to ( 1 )- EP-SL area or for the next new set up ;)

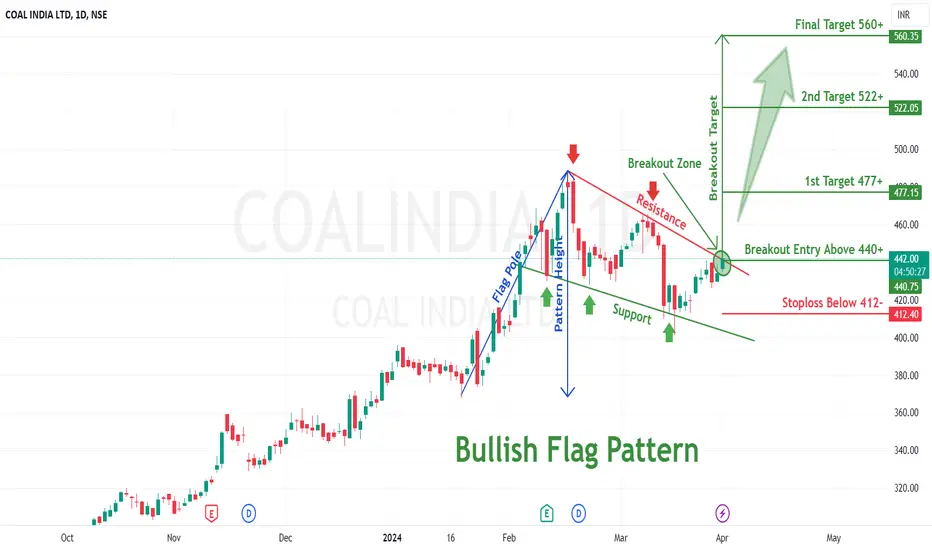
Bullish Flag pattern breakout in COALINDIACOAL INDIA LTD
Key highlights: 💡⚡
✅On 1 Day Time Frame Stock Showing Breakout of Bullish Flag Pattern.
✅Strong Bullish Candlestick Form on this timeframe.
✅It can give movement up to the Breakout target of 560+.
✅Can Go Long in this Stock by placing a stop loss below 412-.
MYRO/USDT Hit TP @ 0.035060, Update 30/03/2024MYRO/USDT nicely hit TP @ 0.035060 & brought for us a nice profits! ;)
G-Money's short version analysis based purely on technical analysis only, no nonsense or "BS":
Stop Loss (SL): @ 0.19858 USDT
Entry Point: @ 0.24852 USDT
Take Profit (TP): @ 0.035060 USDT
PS: ( 1 ) Remember: recommended re-enter area is between Stop Loss (ST) & Entry Point.
( 2 ) If price went half way between Entry Point & Take Profit (TP), be patient please & wait for price retracement to ( 1 )- EP-SL area or for the next new set up ;)
Congratulations to all traders with healthy profits again! ;)

AAVE - USDT Update 29/03/2024G-Money's short version analysis based purely on technical analysis only, no nonsense "BS":
AAVE/USDT - low volume pair,
Stop Loss (SL): @ 107.11 USDT
Entry Point: @ 117.40 USDT
Take Profit (TP): @ 138.51 USDT
PS: ( 1 ) Remember: recommended re-enter area is between Stop Loss (ST) & Entry Point.
( 2 ) If price went half way between Entry Point & Take Profit (TP), be patient please & wait for price retracement to ( 1 )- EP-SL area or for the next new set up ;)

ALCX - USDT Update 29/03/2024G-Money's short version analysis based purely on technical analysis only, no nonsense "BS":
Stop Loss (SL): @ 28.22 USDT
Entry Point: @ 31.61 USDT
Take Profit (TP): @ 38.61 USDT
PS: ( 1 ) Remember: recommended re-enter area is between Stop Loss (ST) & Entry Point.
( 2 ) If price went half way between Entry Point & Take Profit (TP), be patient please & wait for price retracement to ( 1 )- EP-SL area or for the next new set up ;)
it is a bit "sluggish", but it is not really a big surprise with a low average volume around 80k

KDA-USDT SELL Update 29/03/2024G-Money's short version analysis based purely on technical analysis only, no nonsense "BS":
Stop Loss (SL): -1.626 USDT
Entry Point: -1.528 USDT
Take Profit (TP): 1.332 USDT
PS: ( 1 ) Remember: recommended re-enter area is between Stop Loss (ST) & Entry Point.
( 2 ) If price went half way between Entry Point & Take Profit (TP), be patient please & wait for price retracement to ( 1 )- EP-SL area or for the next new set up ;)
General extended version of analysis, just for a general education:
Let’s analyse the KDA/USDT crypto pair for a potential sell order. We’ll consider both technical and fundamental aspects.
Technical Analysis:
Price Chart Overview:
The KDA/USDT pair is currently trading at 1.457 USDT.
Over the past month, it has seen a 27.22% increase in price.
However, in the last week, it experienced a 11.38% decline.
Key Technical Points:
RSI Divergence: The RSI indicator shows divergence, which could signal a potential reversal or continuation pattern.
Price Action Resistance Breakout: The pair broke out of resistance levels in both USD and BTC pairs.
Ascending Channel: The price is stable above the 100-period moving average, indicating strong upward momentum.
Long -Term Target:
Based on an expanding wedge pattern, the minimum target for KDA/USDT is around $6.65.
Fundamental Analysis:
Kadena (KDA):
Kadena is a blockchain platform designed for scalability and security.
It aims to provide high throughput and low transaction costs.
Keep an eye on any upcoming news or developments related to Kadena, as they can significantly impact its price.
Trade Parameters:
Sell Order:
Entry Point: -1.528 USDT
Stop Loss (SL): -1.626 USDT
Take Profit (TP): 1.332 USDT
Remember that trading cryptocurrencies involves risks, and it’s essential to stay informed and manage your risk accordingly. Always perform your due diligence and consider your risk tolerance before executing any trades. Good luck!

TRX- USDT...HINT- Ticking Bomb! 💣🔥 23/03/24With ENTRY area @ 0.12050 or around it is not too late to "jump in".
TP @ 0.13634 or around...
WARNING ⚠️: TREAT COUTIOUS, COS IT IS A "TICKING BOMB"!
It can make a "crazy" dance all over chart before going to hit TP! Don't gamble & properly trade only....!
It was done using purely technical analysis only... & only...😁
PS: not able to post many more trades, which one in the progress or just endup in profit , cos of lack spare time , sorry....over incoming weekend I will try to share majority of them ..
Live Long & Prosper!🖖

ATOM - USDT Achieved TP LVL 🔥 27/03/24Absolutely smashing results! 🔥🔥🔥
Trade took over 6 days & in the final "push" did hit TP @ 12.601. With Entry @11.470 it left us with a nice profits!
It was achieved using purely technical analysis only...
PS: not able to post many more trades, which one in the progress or just endup in profit , cos of lack spare time , sorry....over incoming weekend I will try to share majority of them ..
Live Long & Prosper!🖖

GBPJPY Intraday setupFound Divergence & Double Top on M30
Price is near Supply Zone
190.50 Is possible TP
But still long term bullish
*Not A Financial advice just for education please take measures before taking any trade and consult your finance advisor

#BTC/USDT A bullish flag pattern can be seen in the 1H A bullish flag pattern can be seen in the 1H time frame and if the above trendline breaks it, it can go up between 72K and 73K. If you can't do that, if you break below the trendline, you can go down to 64k again!👀🌟
BINANCE:BTCUSDT

SYN-USD, TP LVL ACHIEVED 26/03/24SYN/USD did "arrived" to the TP LVL @ 1.5552 with ENTRY @ 1.1913.
Trade too around 2 days & analysis was based on purely technical analysis only.
Congratulations all with another profitable trade! 🎉

NITIN SPINNINER DAILY TIME FRAME The Structure looks good to us, waiting for this instrument to correct and then give us these opportunities as shown on this instrument (Price Chart).
Note: Its my view only and its for educational purpose only. Only who has got knowledge about this strategy, will understand what to be done on this setup. its purely based on my technical analysis only (strategies). we don't focus on the short term moves, we look for only for Bullish or Bearish Impulsive moves on the setups after a good price action is formed as per the strategy. we never get into corrective moves. because it will test our patience and also it will be a bullish or a bearish trap. and try trade the big moves.
we do not get into bullish or bearish traps. We anticipate and get into only big bullish or bearish moves (Impulsive Moves). Just ride the Bullish or Bearish Impulsive Move. Learn & Know the Complete Market Cycle.
Buy Low and Sell High Concept. Buy at Cheaper Price and Sell at Expensive Price.
Keep it simple, keep it Unique.
please keep your comments useful & respectful.
Thanks for your support.....
Tradelikemee Academy
Sanjay K G

EUR JPY TRADE SET UP EUR JPY has formed a double top at the weekly resistance level
The market has broken out of the neckline, we need to see a retest before looking for entry short.

[INTRADAY] #BANKNIFTY PE & CE Levels(22/03/2024) Today will be gap up opening in BANKNIFTY. After opening if banknifty sustain above 46550 level then possible upside rally of 400-500 points upto 46950 level & this rally can extend another points if market gives breakout 47050 level in todays session.Any Major downside only expected in case banknifty starts trading below 46450 level to 46050 level.also possible reversal downside 46950 level.

GBP JPY TRADE SET UP GBP JPY TRADE SET UP.
GBP JPY has broken out of a bullish rectangle pattern.
waiting for a retest to enter for long position

Gold price should buy again?Hello, dear freinds
Discover an enticing Buying opportunity in GOLD as it undergoes a critical retest of a key support area. With market analysis, technical indicators, and price action as your allies, evaluate the potential upside move. Stay vigilant and informed to capitalize on this precious metal's market dynamics.

Broadening wedge pattern breakout in OBEROIRLTYOBEROI RELTY LTD
Key highlights: 💡⚡
✅On 1 Hour Time Frame Stock Showing Breakout of Broadening Wedge Pattern.
✅Strong Bullish Candlestick Form on this timeframe.
✅It can give movement up to the Breakout target of 1489+.
✅Can Go Long in this Stock by placing a stop loss below 1371-.

ID ENTERING NEW IMPORTANT LEVELID shows a new increase in volume, which could be confirmed in the coming time frames.
We will follow the coin to see if it's able to confirm.
The reason for the volume is the trend data that this coin shows.
This coin is at basic choice on daily trends.

#AUDUSD inverted Head & Shoulder patternNot only price managed to break above long term bearish daily channel but also seems like price completed a reverse head & shoulder pattern by breaking above the neckline as you can see in the chart.
As a result we can expect to have a bullish continuation move at least towards the bearish trendline on red.
Pull back to the broken neckline would be most favorable setup to go long in this pair.
If you've found this analysis helpful, please take a moment to like, comment, or share your thoughts with me.

#USDCAD rising wedge pattern breakoutIn case of bearish breakout of a rising wedge pattern base on technical analysis text book, we could expect more bearish move in price.
Also we can see in the last bullish move price formed a bearish divergence.
Also price managed to shift market structure to bearish in lower timeframe which add to the possibility of bearish move.
If you've found this analysis helpful, please take a moment to like, comment, or share your thoughts with me.

#US500 maybe we are dealing with topThe US500 index has been rising within a rising wedge pattern since January 17th. However, this strong bullish trend has begun to show signs of losing momentum as overlapping waves develop.
Overlapping waves are a key indicator of a potential reversal, signaling a loss of momentum. Additionally, the rising wedge pattern itself is a powerful reversal pattern.
The combination of diminishing momentum and the breakout below the rising wedge suggests that the bullish trend may be coming to an end, at least temporarily, and we could anticipate a bearish correction.
If you've found this analysis helpful, please take a moment to like, comment, or share your thoughts with me.
