Exide Industries Ready for the Next Bull Run !! Powering Up !!there are two chart of Exide Industries.
In a first chart: EXIDEIND is moving in a well defined parallel channel and currently trading near at support 365-375 range
In the second chart,EXIDEIND is respecting support at both the monthly pivot and the supertrend indicator, with the support zone positioned between ₹365-₹370.
EXIDEIND is currently sustaining below both the monthly and weekly pivot levels at ₹290. As long as the stock does not break above this pivot zone, the momentum is expected to remain weak.
If this level is suatin then ,we may see higher prices in EXIDEIND.
Thank you !!
Chartpatterntrading

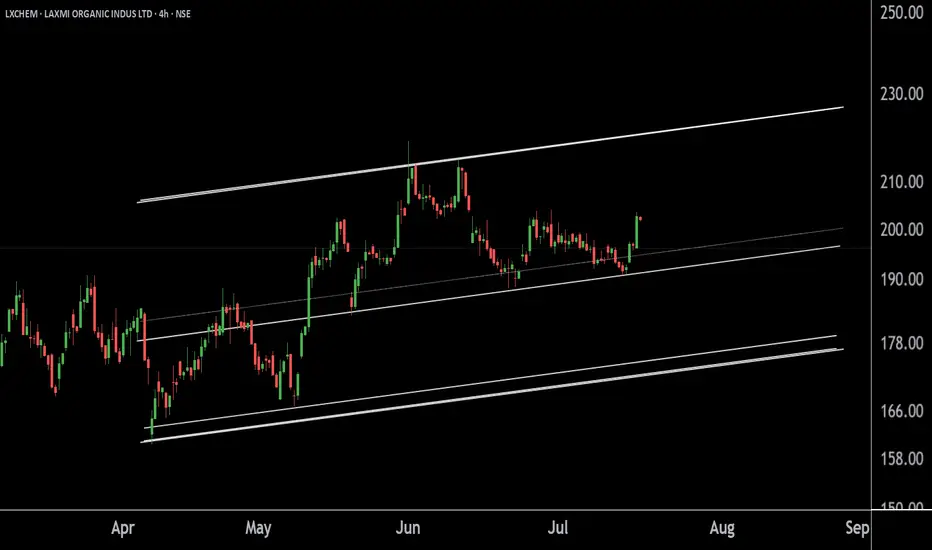
LAXMI ORGANIC INDUS LTD at Best Support !! LXCHEM 's Key level !This is the 4 hour chart of LXCHEM.
LXCHEM is moving in well defined parallel channel with support neat at 190-196 range.
If this level is sustain , then we may see higher prices in LXCHEM.
Thank You !!
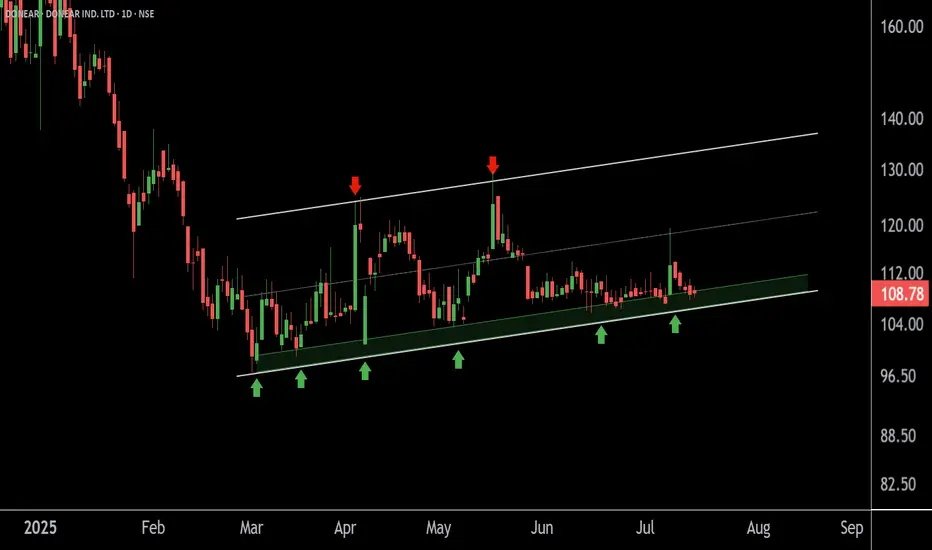
DONEAR at Best Support Zone !!This is the daily chart of Donear Industries.
Donear is moving in well defined parallel channel having a good support zone near 105 level.
if this level is sustain , then we may see higher prices in Donear .
Thank You !!
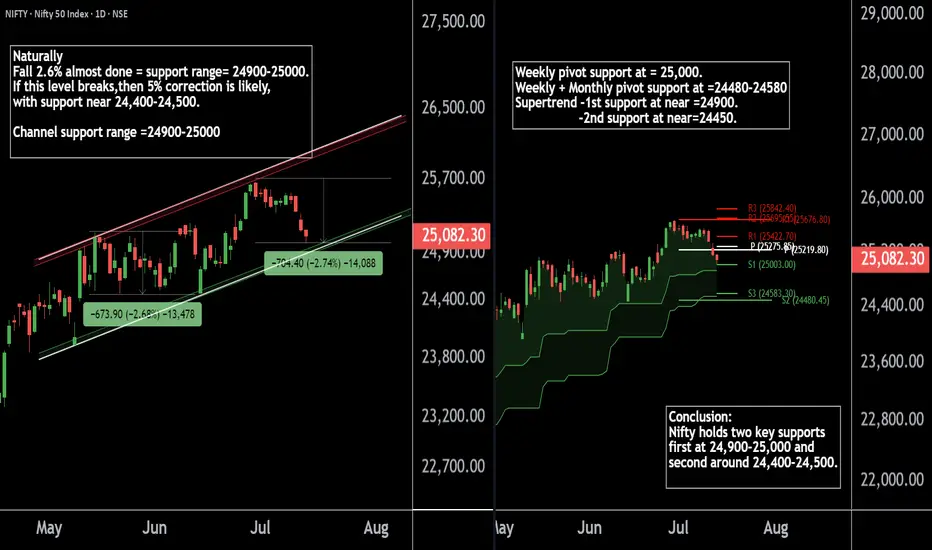
Nifty50's Key Level !! Keep an eye on these levels.Here are two Nifty charts, both on the daily timeframe.
Current Correction:
Nifty has naturally corrected by 2.7%, currently trading in the 24,900-25,000 range.
Weekly Pivot:
The weekly pivot support is positioned at 25,000, providing immediate support.
Support Levels:
First Support: 24,900-25,000 zone.
Second Support: If this level breaks, Nifty may see a 5% correction, with the next support around 24,400-24,500.
If this level sustain we may see higher prices in Nifty 50.
Thank You !!
GAIL at Best Support zone !! There are two chart of Gail on Daily timeframe.
On the first chart Gail is moving in well defined parallel channel with support near at 178-180 zone.
Daily RSI is also taking support and bouncing back, indicating a revival in short-term momentum and strengthening the overall bullish setup.
On the second chart , the stock is bouncing from the supertrend support around ₹180, reinforcing bullish sentiment. However, on the shorter timeframe, the supertrend indicator is acting as resistance near ₹192, which needs to be breached for further upside continuation.
Thank You !!

Descending Triangle Formation (GBPUSD)Here I can see a Descending Triangle Formation. I can see all the relevant characteristics such as the 4 touches, breakout and retest. Now it’s just a waiting game to see if it plays out.

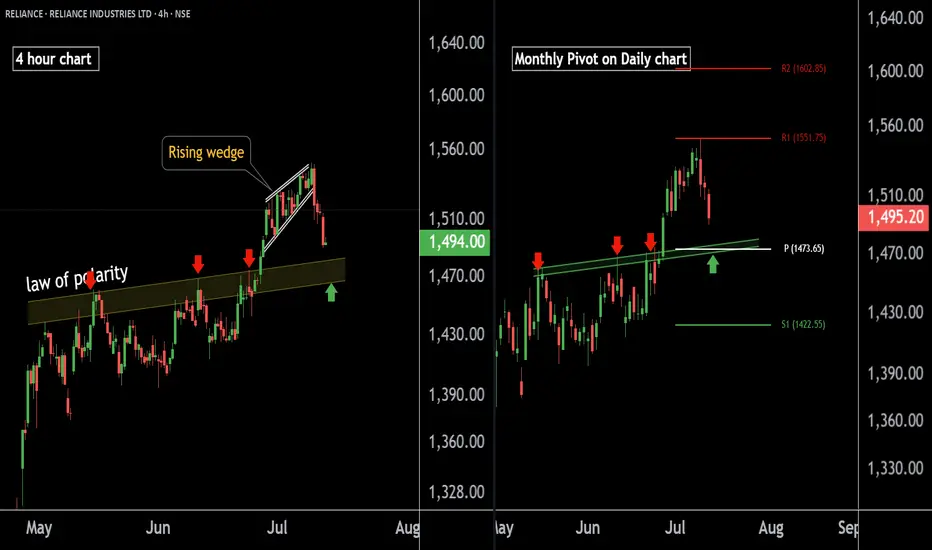
RELIANCE INDUSTRIES at Best Support !! Keep It On Your Radar !!There are two chart of RELIANCE INDUSTRIES on Daily and 4 hour Timeframe.
On the 4-hour timeframe, Reliance is likely to respect its LOP (Line of Polarity) as support, with the support range near 1460-1475.
On the Daily timeframe, the monthly pivot is also positioned around 1473, reinforcing this level as a potential halt or reversal zone.
If this level is sustain we may see higher prices in RELIANCE INDUSTRIES.
Thank You !!!
SUNDARAM FINANCE Near at Support Zone | Keep an eye on it ||There are two charts of Sundaram Finance —on the Weekly timeframe and Daily timeframe.
On the weekly timeframe, the stock is moving within an ascending parallel channel, with the support zone between 4650-4550.
On the daily timeframe, the stock is moving within a descending channel, with the support boundary near 4600-4650.
If this level is sustain then we may see higher prices in SUNDARMFIN
Thank You...

Titan at Best Support Zone !! This is the 4 hour chart of Titan Company.
Titan having a good support zone near 3400-3460 level.
If this level is sustain , then we may see higher prices in Titan company.
Thank You !!

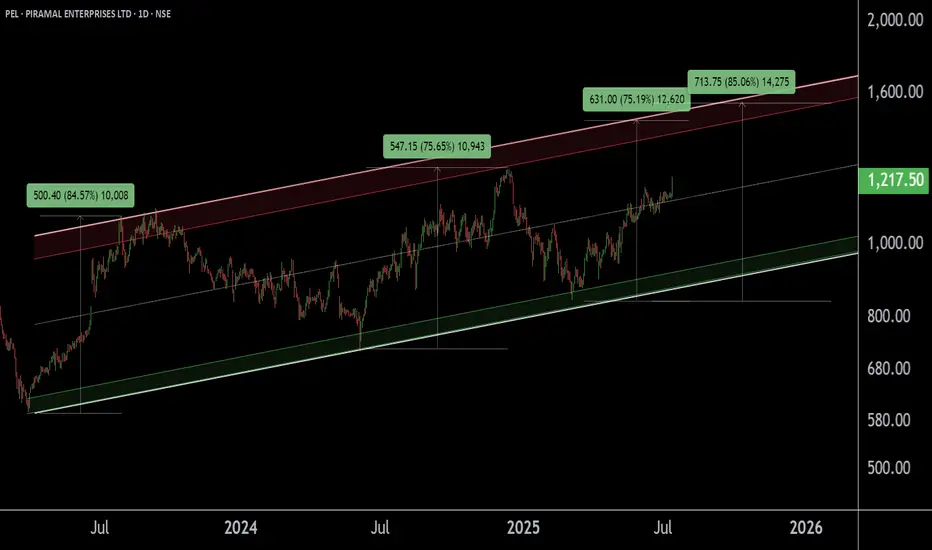
PEL !! PIRAMAL ENTERPRISES LTD appear to be in a Breakout phase This is the Daily Chart of PIRAMAL ENTERPRISES LTD.
PEL is trading above the midline of its ascending parallel channel, with strong support in the ₹1080–₹1150 zone. Historically, whenever it sustains above the midline, it tends to retest the upper boundary resistance of the channel near at 1500 -1540.
If this level is sustain then we may see higher prices in PEL.
Thank You !!
BF UTILITIES LTD 'S KEY LEVEL || BREAKDOWN OR BREAKOUT ??These are two charts of BF Utilities – one on the daily timeframe and the other on the weekly timeframe.
In the first chart : BF Utilities is sustaining near its Law of Polarity (LOP), which is acting as a resistance zone around the 880–890 range.
In the second chart : BF Utilities is forming a Rising Wedge pattern, with the resistance also lying in the 870–880 zone.
If this level is sustain ,then we may see lower price in BF Utilities.If this level is broken, the stock may move towards the upper boundary of the channel.
Thank you !!

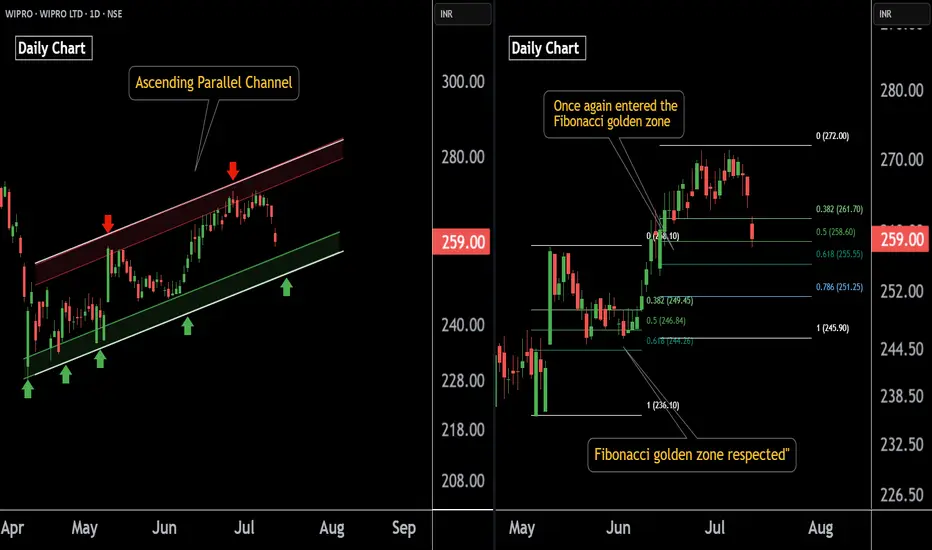
Wipro AT Best Support Zone These are two daily timeframe charts of Wipro .
In the first chart : Wipro is trading within an ascending parallel channel, with the lower boundary positioned around the ₹251–₹254 zone.
Wipro has previously respected the Fibonacci golden zone, and the stock is once again approaching this key retracement area. A potential bounce from this zone is likely if the level is respected again around 254 near .
If this level is sustain , then we may see higher Prices in Wipro.
Thank You !!
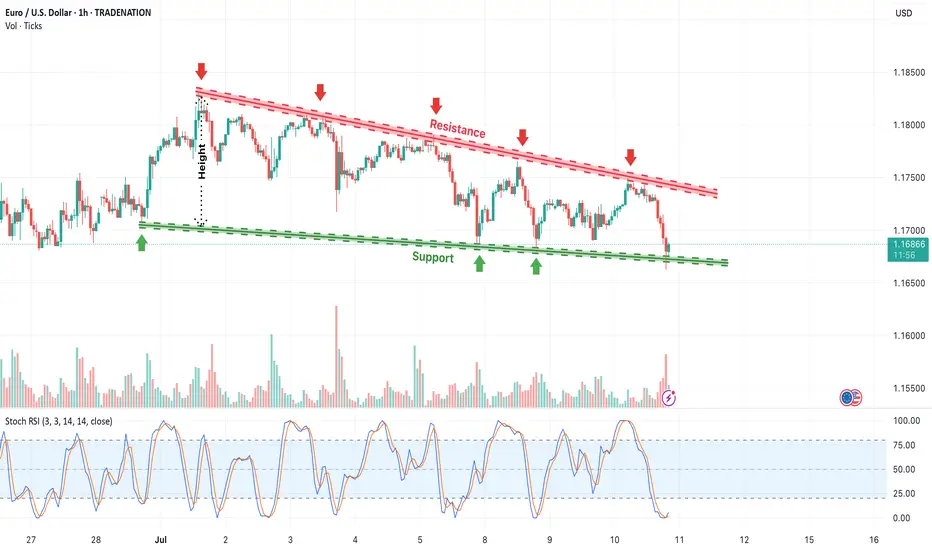
Descending Channel Pattern Forming in EUR/USDThe EUR/USD pair is currently trading within a well-defined descending channel on the 1-hour timeframe, as shown in the chart. The pair has been making consistent lower highs and lower lows, indicating a bearish trend. The red downward-sloping resistance line has been respected multiple times, while the green support line continues to act as a buying zone for bulls.
The resistance trendline has been tested five times (marked with red arrows), confirming strong selling pressure.
The support line has held three key touches (green arrows), suggesting buyers are still defending this level.
A breakout below the support zone could lead to further downside, while a reversal or breakout above resistance may trigger bullish momentum.
Traders should watch for volume confirmation and breakout direction before entering new positions.
=================================================================
Disclosure: I am part of Trade Nation's Influencer program and receive a monthly fee for using their TradingView charts in my analysis.
=================================================================
MAHANAGAR GAS at Best Support !! This is the 4 hour chart of MAHANAGAR GAS Ltd.
MGL has given a breakout and successfully completed a retest. The support zone is in the range of 1430 to 1450.
If this level is sustain then we may see higher in prices in MGL.
Thank You !!

Lupin At Best Support !! This is the 4 hour chart of Lupin .
Lupin appears to be forming a potential Three Drives bullish reversal pattern, with both drives terminating at the 1.27 Fibonacci extension level, indicating a possible exhaustion of the downtrend.
Lupin is trading within a well-defined descending channel. It has once again approached the lower boundary of the channel, which lies around the 1865–1880 zone, and is showing signs of a bounce.
If this level is sustain , then we may see higher prices in Lupin.
Thank You !!

AXIS BANK at Best Support !!This is the 1 hour chart of AXIS BANK .
Axis bank having a good law of polarity at 1200 level.
Axisbank is moving in well defined parallel channel with support range 1160-1180 .
If this level is sustain , then we may see higher prices in AXISBANK.

MANGALORE REFINERY & PETROCHEM 'S KEY LEVEL !! BREAKOUT !!This is the 4 hour chart of MRPL.
MRPL having a good law of polarity at 145 range.
MRPL is trading within a well-defined parallel channel, with support in the 135–140 range.
If this level is sustain , then we may see higher prices in MRPL .
THANK YOU !!

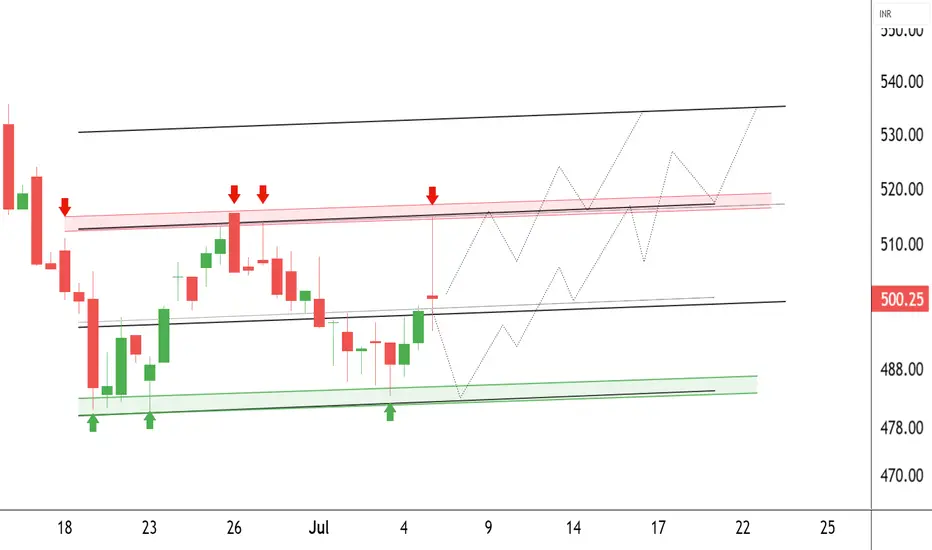
Avadh Sugar & Energy Limited at Best Support !! Breakout This is the 1 hour chart of Avadh Sugar & Energy Limited .
AVADHSUGAR is trading within a well-defined parallel channel and is currently positioned near its L.O.P boundary support zone around ₹495–₹500.
The lower boundary of the channel is 480-490 level and The upper boundary of the channel is positioned near ₹515 and 535, offering a favorable risk-reward setup.
Thank You !!
JSWSTEEL ' S Key Level | Big Breakout !This is the 4 hour chart of JSW STEEL.
JSWSTEEL having a good pattern support zone near at 980-1000 level .
JSW Steel has formed a Symmetrical Triangle pattern on the chart, and a breakout has occurred. The stock may retested the breakout level and then appears poised to move toward its projected target at 1180 - 1200 .
If the support zone level is sustain , then we may see higher prices in JSW Steel.
Thank You !!

Copper1! at Best Support !!This is the 2 chart of Copper1! .
Chart 1 Analysis:
The stock is trading near a parallel channel support zone in the 880–890 range. This zone also aligns with the monthly pivot and weekly pivot support around 882–880. Additionally, the percentage fall is nearly complete near 885, further strengthening this level as a potential support zone.
Chart 2 Analysis:
On the monthly Heikin Ashi chart, support is observed near 864, while the weekly Heikin Ashi support lies around 880.6. By connecting key levels, it indicates that Copper may find support in the 880–885 zone.
Thank You !!

CRUDEOIL1! at Best Support Zone !!This is the Daily Chart of CRUDEOIL1!.
CRUDEOIL1! having a good law of polarity at 5500-5600 level .
CRUDEOIL1! is currently trading between its quarterly pivot 5603 level and monthly pivot 5805 levels , indicating a range-bound movement."
Once the Crudeoil1! sustains above the monthly pivot, it may trigger a potential upside rally."
If this lop is sustain , then we may see higher prices in CRUDEOIL1!
Thank You !!

FSN E COMMERCE VENTURES at Best Support Level | NYKAA !!This is the 4 hour Chart of Nykaa.
Nykaa having a good law of polairty near at 195-190 range.
Nykaa is forming ascending boradening wedge pattern with support at 190-195 range .
If this level is sustain , then we may see higher prices in Nykaa .
Thank You !!

NATURALGAS1! 's key Level |This is the 4 hour chart of NATURALGAS1!
NATURALGAS1! has once again started sustaining above
its LOP (Law of Polarity) zone near at 290-295
If This level is sustain then ,we may see higher prices again in NATURALGAS1!.
Thank You !!
