Symmetrical Triangle on EUR/CHF @ H4The 4-hour chart of EUR/CHF is showing a a symmetrical triangle pattern. It can be used for a trend continuation breakout setup. My potential entry is marked with the cyan line, which is located at 10% of the triangle's base width below the lower border. My take-profit will be at the green line, which is located at 100% of the triangle's base width below the lower border. I will set my stop-loss to the triangle's upper angle (0.93490). I will ignore bullish breakouts from this trend-continuation formation.
Chartpatterntrading

XAUUASD1HThe price is trading within the descending channel. I expect gold may test the resistance, liquidity is in the area 2040-2050. and rollback and go down to retest the support level.
MY goal is the support level at 2020-2015

AUD USD TRADE SET UP AUD USD has broken out of a falling wedge pattern and closes above with 2 candle stick confirmation patterns
But there is USD News coming at NY session
Anyways i will keep holding my longs.

[INTRADAY] #BANKNIFTY PE & CE Levels (11/01/2024) Today will be gap up opening in BANKNIFTY. After opening if banknifty sustain above 47550 level then possible upside rally of 400-500 points upto 47950 level. Any Major downside only expected in case banknifty starts trading below 47450 level.

Last hour recovery till 21800 levelsNifty shows sign of bounce with volume and may hit ~ 21800 level and then chances to reverse and stay in consolidation zone..
An observation study only not for trades

[INTRADAY] #BANKNIFTY PE & CE Levels(10/01/2024)Today will be gap down opening in BANKNIFTY . After opening if banknifty start trading below 47450 level then possible downside rally of 400-500 points upto 47050 Level & this rally can extend another 400 points if market gives breakdown 46950 level in todays session.Any Major upside only expected in case banknifty starts trading above 47550 level.also possible reversal upside 47050 level.

Phoenix Mills ready for quick 5 % gainsThe stock has compressed and poised to move out of the compression zone. One may consider to enter at around 2600, target 2720 and further trail.

EUR USD TRADE SET UP EUR USD has formed the Head and Shoulders Pattern on the 4hr timeframe
We are looking to go short from the second shoulder which acts as a strong resistance level.
What do you see on EUR USD ?

DOHOME| ABC bullish pattern - Breakout Position EntryAfter a long mega bull flag formation breakout and retesting its support
Now a potential ABC wave bullish pennant in progress
Entry: Pennant breakout confirmation
SL: Below pennant
T1: 100% ext. Fibonacci - 15+ baht
T2: 161.8% - 18+ baht
Indicator: RSI week bullish divergence breakout
Always trade with affordable risk, respect your stop

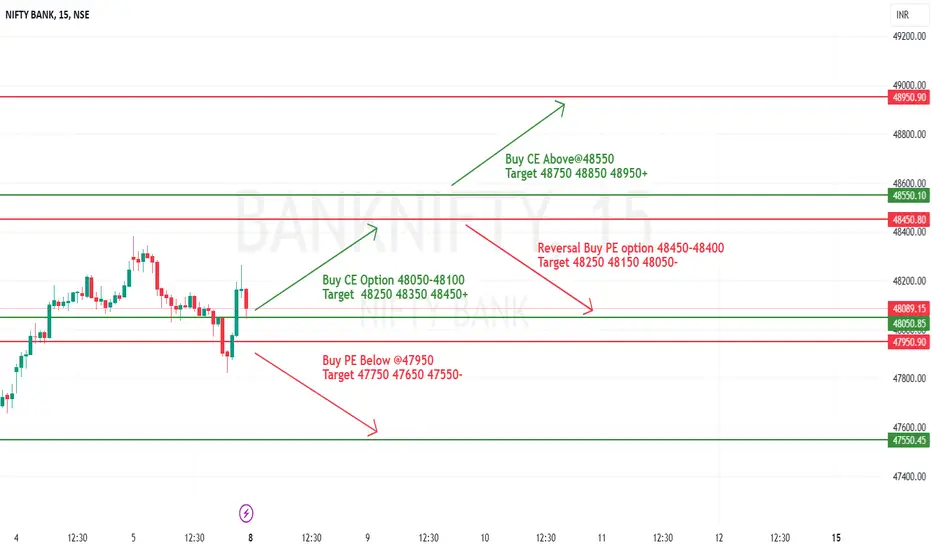
[INTRADAY] #BANKNIFTY PE & CE Levels(08/01/2024) Today will be gap up opening in BANKNIFTY . After opening if banknifty sustain above 48050 level then possible upside rally of 400-500 points upto 48450 & this rally can extend another 400 points if market gives breakout 48550 level.Any Major downside only expected in case banknifty starts trading below 47950 level.Also Possible Reversal Downside 48450 level.
GBP JPY TRADE SETUP GBP JPY has formed a falling wedge pattern on the 4hr timeframe
The market has broken out of the pattern we are now waiting for the retest of the broken LH level for BUY entries.

Gets a good Break out need to accumulate this share Gmdc stock gives a very good Breakout from current lavel we can watch this stock and accumulated lower level as well we can see 572 in few weeks as well at double in Months

RUNEUSDT in 4H wants to rune !!ascending pattern created...
Although the market situation is not clear, you can think about this

⤴️⤴️EURUSD BULLISH MOMENTUM Fullbacks)🚀🚀🚀The dollar edger higher on Friday but is set to end 2023 with its first yearly loss since 2020 against the euro and a basket of currencies, on expectations the U.S. Federal Reserve will begin cutting rates next year as inflation moderates.
Questions for 2024 will be when the Fed begins cuts, and whether the first rate reduction is made to avoid over-tightening as inflation drops, or due to slowing U.S. economic growth.
With markets already pricing in aggressive cuts, debate is also focused on how much further the dollar is likely to fall.
“We’ve already weakened quite a bit in anticipation of a Fed cut cycle to come,” said Brad Bechtel, global head of FX at Jefferies in New York.
The dollar's decline accelerated after the Fed adopted an unexpectedly dovish tone and forecast 75 basis points in rate reductions for 2024 at its December policy meeting.
Markets are pricing in even more aggressive cuts, with the first reduction seen likely in March and 158 basis points in cuts expected by year-end. (FEDWATCH)
The Fed’s tone contrasted with other major central banks, including the European Central Bank (ECB) and Bank of England (BoE), which maintained they will hold rates higher for longer.
But “I do think they will capitulate. European growth is just struggling too much and inflation’s coming down relatively fast … same in the U.K. in many ways,” said Bechtel. “If all three central banks are cutting, it's going to be very hard for the dollar to weaken significantly."
Against a basket of currencies, the greenback on Friday gained 0.13% to 101.32
DXY
, rising from a five-month trough of 100.61 reached on Thursday. It is on track to lose 2.10% this year and is down 4.62% this quarter, the worst performance in a year.
The euro
EURUSD
dipped 0.19% to $1.1040, hovering just below a five-month peak of $1.11395 reached on Thursday. It is heading for a 3.04% gain for the year, its first positive year since 2020.
"Markets are looking for a cut earlier in the U.S. and are less certain that the European Central Bank will cut as quickly, so that's why the dollar is very soft," said Niels Christensen, chief analyst at Nordea.
"We also have positive risk appetite which is another negative for the dollar. Going into 2024, the soft dollar will be a theme towards the March central bank meetings," Christensen added.
Policymakers at the ECB and the BoE did not signal any imminent rate cuts at their policy meetings this month, but traders are pricing in 162 bps of cuts by the ECB next year, with the probability of two cuts by April. The BoE is also expected to cut rates by 148 bps in 2024.
"While it feels like the market might have moved too far too fast, the facts are that growth is non-existent in Europe, slowing in the U.S., and inflation is falling globally," said CJ Cowan, portfolio manager at Quilter Investors.
"The ECB is famously slow to change policy course so almost two cuts priced by April looks aggressive, even if it might be the right thing to do."
Sterling
GBPUSD
rose 0.08% to $1.2745 and was on track for a 5.39%

BEYOND DROP N POPbeyond meat is dealing with a lot of internal things battling debt but based off of technical analysis it's due for a pop.
i'm currently holding calls out to 4/19/2024 no telling where it could go with volume but i can see it retesting $11.

NVDA: Beware of these Support / Resistance Levels (H & D charts)NVDA shares are losing momentum after a powerful upward reaction this morning. It seems that as it approaches its resistance area, it is becoming difficult for NVDA to maintain its upward trajectory.
We had a good reaction near the Fibonacci retracements, which, as we warned in our last public study, was our main area of support. Now the price is trying to recover, but there are still some challenges ahead. The link to our previous analysis is below this post, as usual.
It's interesting to note that despite losing momentum, the price could still seek out the $487.61 region, a secondary resistance and previous top that can be seen on the hourly chart:
At the moment, there is no clear sign of a bearish reversal, but we should remain vigilant as the price is finding it difficult to break through the resistance of its Ascending Channel, as evidenced by the purple lines.
A correction down to the 21 EMA is plausible, but if the price loses this support, then we could see NVDA near the support of its channel again.
So, in the short term, it's all about the Ascending Channel, and in which direction there will be a breakout, as well as the 21 EMA. In the medium term, we should focus on the Fibonacci retracements, and the resistance at $487.
I must admit that I would like to see the price at $487 again, since that point has been a personal target for me since the first buy signal at $469: Ignition Bar + above the support of the ascending channel + breaking a pivot point + breaking the 21 ema on the 1h chart = Clear buy signal (to me, at least). However, depending on how the price reacts today, maybe the bullish thesis will be thwarted.
I’ll keep you updated on this, so remember to like this idea, and follow me for more analysis like this.
All the best,
Nathan,

EUR JPY TRADE SET UP EUR JPY falling wedge pattern.
We had a break and retest and exhausted at the lower timeframe based on candlesticks formations on the retest level

AUDCHF AUDCHF Making Inverted Head & Shoulder If Break The Resistance Area Wait For Retest And Go Up As Planing

🚀⤴️⤴️GOLD FULLBACK 2100)⏫️hello trader’s what do you think about gold)
gold fullbacks support levels 2047)
Gold if breakoutdown and this weekend looks better news CPI trader’s 2047) support levels and gold mowing fullback 2100)resistance levels)my position 2047) lounges 2100)
key levels 2080
key levels 2090
key levels 2100
Gold finished the year at $2,063 an ounce, climbing more than 13% in 2023 for its first annual gain in three years, and logging a new record high within the year mostly supported by expectations that the major central banks will start cutting interest rates early next year.
After implementing an aggressive rate-hiking cycle that started in early 2022, the US Federal Reserve is now expected to begin easing as soon as next March amid signs that inflation in the US is cooling.
Moreover, heightened geopolitical tensions in the Middle East and the prospect of a prolonged war in Gaza spurred safe-haven demand for gold.

BTCUSD 15min Ascending Triangle Breakout Loading...Bitcoin on 15min timeframe forming an ascending triangle pattern. Breakout is not confirmed however my best guess is that it breaks out, retraces back to breakout level before heading higher.

OGVUSDT Breakout Loading...Origin Governance (OGV) has been trading in a range for 1.5+ years, unable to maintain a level beyond $0.010. Recently started forming higher lows forming an ascending triangle pattern. its in the LSDFi category and has a very low market cap of around 7m. It also has a high TVL of 104m giving it a TVL ratio of just 0.44. So both fundamentals and technicals are lining up for OGV. One to watch for sure!

Bullish Livermore Accumulation Cylinder on ZapexLivermore accumulation cylinder forming on the Zapex chart. You can clearly see the widening mouth pattern where price moves back and forth between the two nonparallel lines. Currently at only about 1 million market cap this CEX/DEX Aggregator looks like it is about to explode to the upside.

💥 USD JPY bearish moving) 4H )Hello trader’s what do you think about usdjpy)?
Usdjpy bearish moving retest rsl levels same Bak sell zone 138.570
The US dollar declined against its major trading partners early Friday, except for a gain versus the euro, ahead of the release of the New York Federal Reserve's Empire State survey for December, the first manufacturing reading for the month, at 8:30 am ET.
November industrial production data are set to be released at 9:15 am ET, followed by S&P Global's flash estimates of manufacturing and services conditions for December at 9:45 am ET.
With the Fed's pre-meeting "quiet period" now lifted, appearances by officials should pick up in the coming week before the holidays begin.
A quick summary of foreign exchange activity heading into Friday:
USDEUR
fell to 1.0966 from 1.0992 at the Thursday US close but was above a 1.0928 level at the same time Thursday morning. The European Central Bank held its target rate steady Thursday, as expected, and said that rates will need to remain elevated "as long as is necessary," according to ECB President Christine Lagarde. There was no discussion of rate cuts at the meeting, Lagarde said. The next ECB meeting is scheduled for Jan. 25. The Eurozone manufacturing and services sectors continued to contract in December, a preliminary purchasing managers' index released earlier Friday showed.
GBPUSD
rose to 1.2774 from 1.2766 at the Thursday US close and 1.2664 at the same time Thursday morning. UK manufacturing PMI showed continued contraction in December, but the services reading moved further above the breakeven point to signal faster expansion, preliminary data released earlier Friday showed. The next Bank of England meeting is scheduled for Feb. 1 after the BoE maintained its target rate Thursday and said rates will need to remain elevated for some time.
USDJPY
fell to 141.6480 from 141.8862 at the Thursday US close but was above a level of 141.5921 at the same time Thursday morning. Preliminary Japanese manufacturing PMI for December showed further contraction while the services sector expanded at a faster rate than in the previous month, data released overnight showed. The next Bank of Japan policy meeting is scheduled for Dec. 18-19, with the statement released in US time Monday evening.
USDCAD
fell to 1.3381 from 1.3406 at the Thursday US close and 1.3448 at the same time Thursday morning. Canada housing starts data for November are scheduled for release at 8:15 am ET, followed by wholesale sales data for October at 8:30 am ET. The next Bank of Canada meeting is set for Jan. 24. BoC Governor Tiff Macklem is scheduled to speak at 12:40 pm ET.
