Breakout in Dow Jones Industrial Average (DJI)...Chart is self explanatory. Levels of breakout, possible up-moves (where stock may find resistances) and support (close below which, setup will be invalidated) are clearly defined.
Disclaimer: This is for demonstration and educational purpose only. This is not buying or selling recommendations. Please consult your financial advisor before taking any trade.
Chartpatterntrading

5PAISA CAPITAL 42% gaindouble cup with handle pattern in 5PAISA CAPITAL. It is a good buy for this new year and in election times both paisa and capital is important.

NZD USD TRADE SETUP NZD USD has formed an ascending channel
which consist of Higher Highs and Higher Lows.
the market has broken out of the channel and also broke the HL market structure
now we must wait for a retest of the broken Higher Low to get a sell entry.

GBPJPY DIAMOND BOTTOM🎄 Hello Traders, Merry Christmas and Happy New Year! 🎉
As we embrace the festive spirit, let's also dive into an exciting trading opportunity that's shaping up in the Forex market.
📚 Introduction to the Diamond Bottom Pattern:
What is a Diamond Bottom? It's a unique and relatively rare chart formation that signals a potential bullish reversal. This pattern is characterized by a broadening price range followed by a narrowing one, forming a diamond-like shape.
Why It Matters: For technical traders, spotting a Diamond Bottom can be like finding a gem – it often leads to significant price movements if confirmed.
🔎 Analysis of GBPJPY's Diamond Bottom Pattern:
Current Scenario: The GBPJPY has formed a distinctive Diamond Bottom on its hourly chart, hinting at a possible shift in momentum.
Breakout Point: The key level to watch is the breakout point at 180.366. A sustained move above this level could signal the start of a bullish phase.
Risk Strategy: As always, managing risk is crucial. Placing stops below the low prior to the breakout can help mitigate potential downside risks.
Target Zones:
Primary Target Zone:
62% Retracement: 181.202
79% Retracement: 181.440
Extended Target Zone:
127% Extension: 182.092
162% Extension: 182.573
🎁 Trading Insights:
Confirmation is Key: Wait for a confirmed breakout above the Diamond Bottom for a higher probability trade.
Market Context: Keep an eye on overall market trends and news, especially those affecting the GBP and JPY.
🌟 Conclusion:
Opportunity Awaits: The Diamond Bottom pattern in GBPJPY offers a promising setup as we head into the new year. With careful analysis and prudent risk management, this could be a great way to start your trading year.
Here's to a profitable and joyous trading journey ahead! 🥂

[INTRADAY] #BANKNIFTY PE & CE Levels (29/12/2023) Today will be gap up opening in BANKNIFTY . After opening if banknifty sustain above 48550 level then possible upside rally of 400-500 points upto 48950 level.Any Major downside only expected in case banknifty starts trading below 48450 level.

AUD USD TRADE SET UP 3hr Timeframe AUD USD is moving in an ascending channel,
The price has reached the Higher High Level of the channel for the 3rd time, which is also a strong resistance level
Upon reaching the HH level the market has formed a Doji candlestick pattern with a close below which is a good confirmation for a sell.
What do you think ?

Rising Wedge pattern breakout in CONCORCONTAINER CORPORATION OF INDIA LTD
Key highlights: 💡⚡
✅On 1 Hour Time Frame Stock Showing Breakout of Rising Wedge Pattern.
✅Strong Bullish Candlestick Form on this timeframe.
✅It can give movement up to the Breakout target of 874+.
✅Can Go Long in this stock by placing a stop loss below 838-.

EURUSD) bearish on the market) analysis)💥💯💯The US dollar fell against its major trading partners early Thursday ahead of a trio of economic releases at 8:30 am ET.
The third estimate of Q3 gross domestic product is scheduled for release at 8:30 am ET, at the same time as weekly jobless claims and the Philadelphia Federal Reserve's manufacturing reading for December.
Later, the Conference Board's leading indicators report for November is due at 10:00 am ET, followed by weekly natural gas stocks data at 10:30 am ET and the Kansas City Fed's manufacturing reading at 11:00 am ET.
A quick summary of foreign exchange activity heading into Thursday:
USDEUR
rose to 1.0982 from 1.0943 at the Wednesday US close and 1.0937 at the same time Wednesday morning. There are no EU data on Thursday's calendar but European Central Bank policy board member Philip Lane is scheduled to speak at 11:00 am ET. The next ECB meeting is set for Jan. 25.
GBPUSD
rose to 1.2663 from 1.2639 at the Wednesday US close and 1.2655 at the same time Wednesday morning. The UK CBI distributive trade survey showed expectations of a large contraction in retail spending in December, data released overnight showed. The next Bank of England meeting is scheduled for Feb. 1.
USDJPY
fell to 142.6838 from 143.5636 at Wednesday US close and 143.4100 at the same time Wednesday morning. There were no Japanese data released overnight. The next Bank of Japan meeting is scheduled for Jan. 22-23.
USDCAD
fell to 1.3343 from 1.3368 at the Wednesday US close but was up from a level of 1.3338 at the same time Wednesday morning. Canada retail sales and average weekly earnings data for October are scheduled to be released at 8:30 am ET. The next Bank of Canada meeting is set for Jan. 24.

COACH VS BOSS / RECOGNIZING COACH FORMATION ON CHART 📊Hello Traders!
I want to show you the importance of Coach formation in trading, and how to recognize this formation on a chart.
Traders, if you liked my idea or if you have a different vision related to this trade, write in the comments. I will be glad to see your perspective.
____________________________________
Follow, like, and comment to see my content:
www.tradingview.com

COACH VS BOSS / RECOGNIZING BOSS FORMATION ON CHART 📊Hello Traders!
I want to show you the importance of Boss formation in trading, and how to recognize this formation on a chart.
Traders, if you liked my idea or if you have a different vision related to this trade, write in the comments. I will be glad to see your perspective.
____________________________________
Follow, like, and comment to see my content:
www.tradingview.com

Learn to identify some useful Chart patterns, Merry Christmas🎄 Unlocking the Secrets of Chart Patterns: Navigating Market Trends 📈
Season's Greetings to all our readers! As we celebrate the spirit of the holidays, let's delve into the fascinating world of financial markets. In our journey to understand and navigate the complexities of trading and investing, we've touched upon essential chart patterns that can serve as invaluable guides for market enthusiasts.
In the midst of the festive cheer, let's revisit some of these powerful indicators: the Double Bottom, Flag and Pole, Bullish Pennant, Rising Wedge, Falling Wedge, Triple Top, and Inverted Head and Shoulders. Understanding these patterns can be akin to unwrapping gifts of insight into potential market movements.
So, grab a cup of cocoa, settle into your favorite chair, and join us as we explore the significance of these chart patterns and share practical tips on incorporating stop-loss strategies to enhance your trading toolkit.
Wishing you a Merry Christmas filled with joy, warmth, and prosperous insights in the financial markets! 🎅🎁🚀
Double Bottom:
Description: Imagine a smiley face turned upside down. A double bottom is a chart pattern that looks like two rounded troughs (bottoms) next to each other.
Interpretation: Indicates a possible reversal of a downtrend. The price has tried to go down twice but failed, suggesting a potential upward movement.
Stop-Loss Tip: One can place a stop-loss slightly below the lowest point of the double bottom. If the price falls below this level, it may invalidate the pattern.
Flag and Pole:
Description: Think of a flag on a flagpole. The "pole" is a strong, quick price movement, and the "flag" is a rectangular-shaped consolidation pattern.
Interpretation: The flag and pole pattern often signals a continuation of the previous trend. The flag represents a brief pause before the price resumes its original direction.
Stop-Loss Tip: One should set a stop-loss just below the lower end of the flag. If the price drops below this level, it might suggest a reversal of the trend.
Bullish Pennant:
Description: Similar to the flag and pole but with a small symmetrical triangle (pennant) instead of a rectangle.
Interpretation: Indicates a temporary consolidation after a strong upward movement. It suggests that the bullish trend might continue after the brief pause.
Stop-Loss Tip: Place a stop-loss under the lower trendline of the pennant. A break below this line could signal a potential trend reversal.
Rising Wedge:
Description: Picture a triangle with its top side steeper than the bottom side. The price makes higher highs and higher lows but in a narrowing range, with indicator making Lower Highs (Bearish Divergences).
Interpretation: This pattern can indicate a potential reversal to the downside. It suggests that the buying interest is weakening, and the price may soon decline.
Stop-Loss Tip: Place a stop-loss just above the last price swing high of the wedge. If the price drops below this line, it may suggest a potential reversal.
Falling Wedge:
Description: Similar to the rising wedge but inverted. The top side is less steep than the bottom side.
Interpretation: Represents a potential reversal to the upside. It suggests that selling pressure is weakening, and the price may be ready to move higher.
Stop-Loss Tip: Place a stop-loss just below the last price swing low of the wedge. If the price drops below this line, it may suggest a potential reversal.
Triple Top:
Description: Visualize a horizontal line touching the tops of three consecutive peaks.
Interpretation : Indicates a possible reversal of an uptrend. The price has failed to break above a certain level three times, suggesting a potential downturn.
Stop-Loss Tip: One should set a stop-loss slightly above the highest point of the triple top. If the price rises above this level, it may negate the pattern.
Inverted Head and Shoulders:
Description: Picture three troughs, where the middle one (head) is lower than the two on either side (shoulders).
Interpretation: This pattern suggests a potential reversal from a downtrend to an uptrend. It signifies a shift in momentum from bearish to bullish.
Stop-Loss Tip: One should place a stop-loss just below the neckline (the line connecting the highs of the pattern). If the price falls below this line, it might indicate a failed reversal.
I am not Sebi registered analyst. My studies are for educational purpose only.
Please Consult your financial advisor before trading or investing. I am not responsible for any kinds of your profits and your losses.
Most investors treat trading as a hobby because they have a full-time job doing something else.
However, If you treat trading like a business, it will pay you like a business.
If you treat like a hobby, hobbies don't pay, they cost you...!
Hope this post is helpful to community
Thanks
RK💕
Disclaimer and Risk Warning.
The analysis and discussion provided on in.tradingview.com is intended for educational purposes only and should not be relied upon for trading decisions. RK_Charts is not an investment adviser and the information provided here should not be taken as professional investment advice. Before buying or selling any investments, securities, or precious metals, it is recommended that you conduct your own due diligence. RK_Charts does not share in your profits and will not take responsibility for any losses you may incur. So Please Consult your financial advisor before trading or investing.

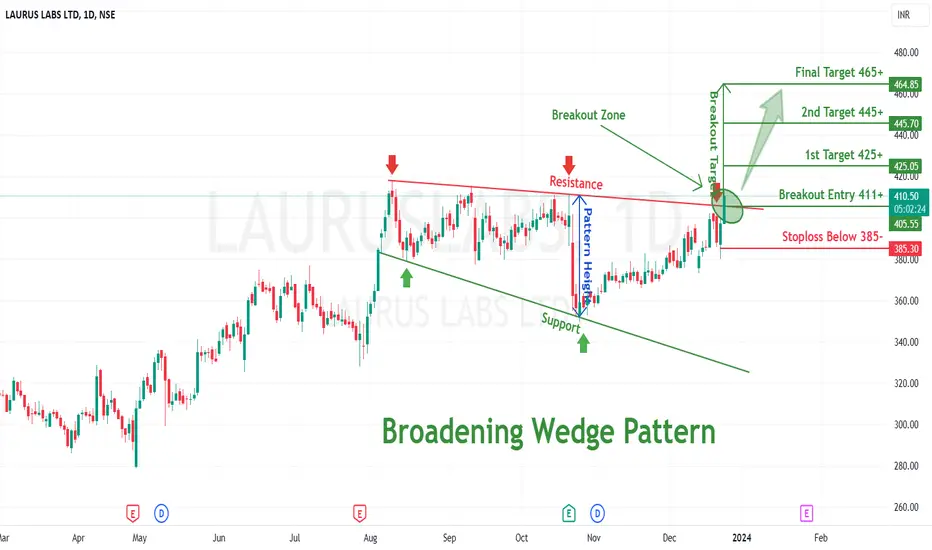
Broadening Wedge pattern breakout in LAURUSLABSLAURUS LABS LTD
Key highlights: 💡⚡
✅On 1Day Time Frame Stock Showing Breakout of Broadening Wedge Pattern.
✅Strong Bullish Candlestick Form on this timeframe.
✅It can give movement up to the Breakout target of 465+.
✅Can Go Long in this stock by placing a stop loss below 385-.
GBPJPY) 4H) tame frame ) analysis)Speculation about when the Bank of Japan will end its negative interest rate policy (NIRP) has been rife, but seen as more likely to come in January than December.
Price action in JPY-related FX option markets isn't offering many clues, with increased demand and high volatility risk premiums for both meetings, and also for a speech by BoJ Governor Kazuo Ueda on Dec. 25.
Deutsche shares sentiment with other banks who expect the Bank of Japan to maintain its current monetary policy framework in December, while hinting at an end to the NIRP at its Jan. 23 meeting. Deutsche attribute a 60% probability to hints being made.
In terms of fundamentals, Deutsche believe that ending NIRP in January is appropriate because the forecast in the outlook report will change since the data already imply a virtuous circle in wages and prices. In terms of practicalities, it is because financial institutions would have sufficient time to prepare for it.
Deutsche suspect that the BoJ will hint at the upcoming policy revision by including some key points in its statement; that it will assess and confirm the virtual circle between wages and prices by the January meeting, with the results to be published at the same time as the outlook report; and that, as a result of this assessment, the policy revision will be judged appropriate and it will continue to emphasize an accommodative policy stance and stable JGB markets even after the revision.
Overnight expiry FXO implied volatility

ULTRACEMCO - Has a Very tight Squeeze ULTRACEMCO - Has a Very tight Squeeze and if there is any BO to the upside we could expect for an Continuation of the rally. This can give a move of 4-6% in a couple of week - IF THERE IS A CLEAR BO WITH HIGH VOLUME'S

PVRLooking good for short term . blockbuster new tollywood movies releasing in Dec & trend also positive .

💥💯 btc uSdt ) breakdown) 👇👇Hello trader’s what do you think about Btcusd) ?
Guys are you expected btc uSdt go down ) btc uSdt breakdown support levels 41k ifberakout to Next move 40k 39k 38k ) I’m looking 👀 down)

TSLA: Pay Close Attention to These Chart Patterns (D & W charts)Today we see an important move in TSLA's share price, a break of the resistance level of its previous top at $252.75.
Now, after the breakout, we see that this area is serving as intraday support, which is in line with the principle of polarity (former supports can become future resistances and vice versa).
Since our last analysis last week, we see that the price has broken through its most important resistances, which we mentioned in our previous analysis, and is committed to a clear uptrend. The link to the latest study is below this post, as always. What’s more, after our analysis, TSLA performed a clear “Hammer” candlestick pattern above its support line, as evidenced on the chart above. According to Bulkowski’s studies, a Hammer acts as a bullish reversal roughly 60% of the time (Encyclopedia of Candlestick Charts, chapter 40: Hammer, p. 348).
What's even more interesting is that the price has thwarted a possible reversal pattern called Head and Shoulders, as we can see in detail in the chart below. By not triggering the neckline by closing a candle below $230, and reacting to the point of breaking through the top of the head, TSLA has completely rejected any bearish thesis.
Another important point that reinforces the bullish sentiment is the breaking of an important resistance on the weekly chart, breaking a bearish channel, frustrating the price's downward sequence and triggering a bullish reversal for the long term. As we see in the image below, such a pattern could be interpreted as a Bullish Flag as well.
Now, TSLA shares could reverse the long-term trend and finally turn bullish. Could it follow the example of the Nasdaq index, which made a similar pattern recently, also on the weekly chart?
QQQ chart:
It's a plausible move with a good technical basis, but as always, we need to be aware of a few risk points.
Firstly, if the price loses a lot of strength, to the point of making a bearish pattern on the weekly, closing below the resistance of the bearish channel, the bullish thesis loses strength.
Secondly, if a reversal pattern is observed on the daily, and the price loses its supports, we have a rejection of the uptrend in the medium term. Especially if the 21 EMA is lost. Although the price has breached the average a few times, at no time since November 10 have we seen a close below the 21 EMA on the daily chart. If this happens, the bullish thesis described in the analysis could be thwarted.
I'll keep you updated, so if you like the content, please support me, and follow me to receive more analysis like this, with technically grounded ideas.
Best regards,
Nathan.

GOLD → Narrowing the fluctuation. The fall may continue!
FOREXCOM:XAUUSD XAUUSD can create a pattern of narrowing the fluctuation range in this area, then rapidly decreasing.
XAUUSD (H4)
Sell Stop at: 2015.5
Stop Loss at: 2026
Take Profit 1 at: 1997
Take Profit 1 at: 1980
Note: capital management 2%

📊 AUDUSD) bearish analysis)💥💥hello trader’s what do you think about audusd)?
Audusd a breakdown of resistance levels and bake down said support levels wait for channel breakout go down)
key levels 0.66605
Key levels 0.66932
Key levels 0.65767
Key levels 0.65519
(Follow me don’t miss next ideas)

EURUSD Double Top OpportunityHi Traders!
EURUSD is forming a potential double-top pattern, and there is great risk-reward potential for shorting opportunities near the resistance.
Here are the details:
The market tested the previous month's high of 1.10173, but the bears are holding very strongly around this level, which has currently formed a double-top pattern on the chart.
Preferred Direction: Sell
Entry Level: 1.09960
Stop Level: 0.65089
Target Level: 1.10771
Technical Indicators: 20 EMA
Please make sure to click on the like/boost button 🚀 as your support greatly helps.
Trade safely and responsibly.
BluetonaFX

NZD USD TRADE SET UP 4HNZD USD has formed a bullish pennant continuation pattern.
A breakout has occurred we are now waiting for a retest of the broken LH for a buy entry.

[INTRADAY] #BANKNIFTY PE & CE Levels(14/12/2023) Today will be gap up opening in BANKNIFTY . After opening if banknifty sustain above 47050 level then possible upside rally of 400-500 points upto 47450 Level & this rally can extend another 400 point if market gives breakout 47550 level. Any Major downside only expected in case banknifty starts trading below 46950 level.

Reversal Double Bottom pattern in PELPIRAMAL ENTERPRISES LTD
Key highlights: 💡⚡
📈 On 1 Hour Time Frame Stock Showing Reversal of Double Bottom Pattern.
📈 It can give movement upto the Reversal Final target of Above 953+.
📈 There have chances of breakout of Resistance level too.
📈 After breakout of Resistance level this stock can gives strong upside rally upto Above 1022+.
📈 Can Go Long in this stock by placing a stop loss Below 850-.
