CRV/USDT 1-Day TF: Bullish Momentum ResurfacesBINANCE:CRVUSDT
CRV/USDT has recently shown renewed bullish momentum on the 1-day timeframe. This suggests that market sentiment is shifting, with bulls gaining control.
It is important to monitor this development closely, as it may present a favorable opportunity for traders and investors.
Traders who are bullish on CRV/USDT may want to consider taking a long position with a stop loss below the recent swing low.
Risk Management
It is important to note that all investments carry risk, and there is no guarantee of profit. It is important to do your own research before making any investment decisions, and to risk only what you can afford to lose.
Disclaimer: This is not financial advice.
Chartpatterntrading

[INTRADAY] #BANKNIFTY PE & CE Levels(26/10/2023) Today will be gap down opening in BANKNIFTY . After opening if banknifty start trading below 42950 level then possible downside rally of 400-500 points upto 42550 Level. And this rally can extend for another 400 points if it gives breakdown of 42450 level. Any Major upside only expected in case banknifty starts trading above 43050 level.

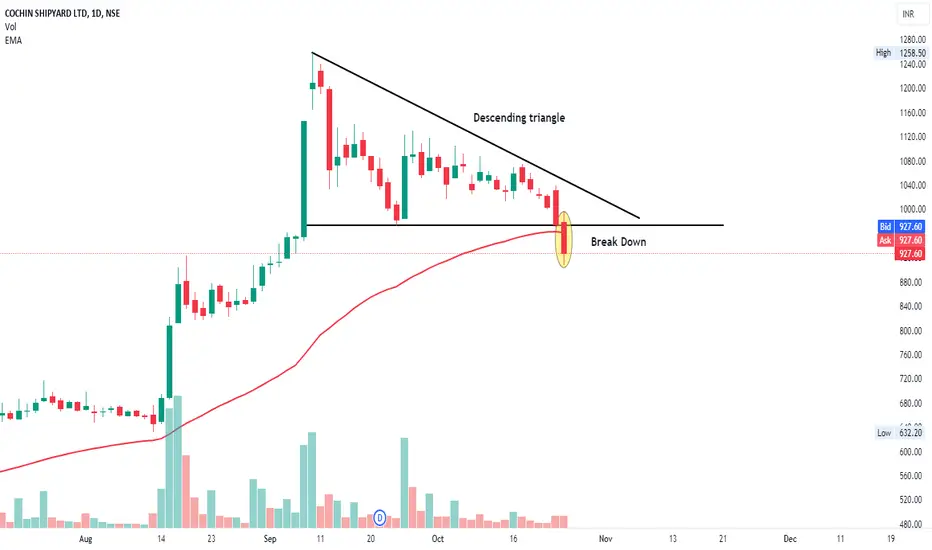
COCHINSHIP BREAK DOWNCOCHINSHIP BREAK DOWN
1. Descending triangle
2. Support Breakout
3.Below The 50EMA
TV18 BROADCAST breakodownTV18 BROADCAST breakodown
1. Descending Triange
2. Volume Buildup
3.Neck brakdown

Uptrend Channel breakdown in INDUSINDBKINDUSIND BANK LTD
Key highlights: 💡⚡
✅On 1Hour Time Frame Stock Showing Breakdown of Uptrend Channel Pattern .
✅ Strong bearish Candlestick Form on this timeframe.
✅It can give movement up to the Breakdown target of 1369-.
✅Can Go short in this stock by placing a stop loss above 1443+.

btc short setupbtc formate bearish triangle dump is coming first target is 32k support if not rejected from this area wi will see 30k

Rising Wedge breakdown in BHARTIARTLBHARTI AIRTEL LTD
Key highlights: 💡⚡
✅On 1Hour Time Frame Stock Showing Breakdown of Rising Wedge Pattern .
✅ Strong bearish Candlestick Form on this timeframe.
✅It can give movement up to the Breakdown target of 894-.
✅Can Go short in this stock by placing a stop loss above 953+.

Reversal Bearish Flag pattern in GNFCGujarat Narmada Valley Fertilizers & Chemicals Limited
Key highlights: 💡⚡
📈 On 1week Time Frame Stock Showing Reversal of Bearish Flag Pattern.
📈 It can give movement upto the Reversal Final target of Below 562-.
📈 There have chances of breakdown of Resistance level too.
📈 After breakdown of Resistance level this stock can gives strong downside rally upto below 142-.
📈 Can Go short in this stock by placing a stop loss Above 738+.

[INTRADAY] #BANKNIFTY PE & CE Levels(25/10/2023Today will be gap down opening in BANKNIFTY . After opening if banknifty start trading below 42950 level then possible downside rally of 400-500 points upto 42550 Level. Any Major upside only expected in case banknifty starts trading above 43050 level.

KASUSDT Ascending Triangle BreakoutKASUSDT Daily is about to break out of a nice ascending triangle pattern. A fairly new crypto so no overhead resistance. Also breakout coincides with a market cap of around 1 billion.

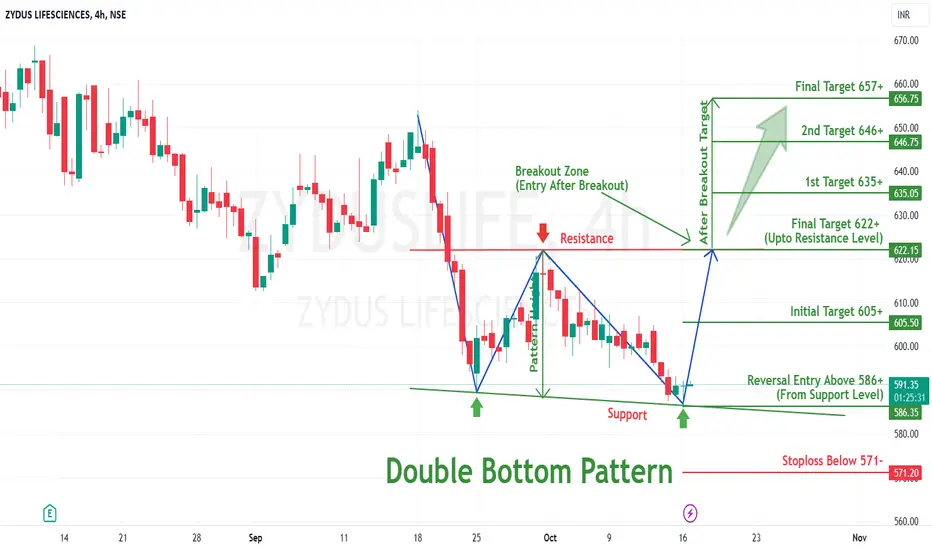
Double Bottom Pattern Reversal in ZYDUSLIFEZYDUS LIFESCIENCES LTD
Key highlights: 💡⚡
📊On 4 hour Time Frame Stock Showing Reversal of Double Bottom Pattern.
📊 It can give movement upto the Reversal target of Above 622+.
📊There have chances of Breakout of Resistance level too.
📊 After Breakout of Resistance level this stock can gives strong upside rally upto above 657+.
📊 Can Go long in this stock by placing stop loss below 571- or last swing Low.
Head & Shoulder breakdown in JSWSTEELJSW STEEL LTD
Key highlights: 💡⚡
✅On 1Hour Time Frame Stock Showing Breakdown of Head & Shoulder Pattern .
✅ Strong bearish Candlestick Form on this timeframe.
✅It can give movement up to the Breakdown target of 751-.
✅Can Go short in this stock by placing a stop loss above 781+.

[INTRADAY] #BANKNIFTY PE & CE Levels(23/10/2023) Today will be gap up opening in BANKNIFTY. After opening if banknifty sustain above 43550 level then possible upside rally of 400-500 points upto 43950 Level. And this rally can extend for another 400 points if it gives breakout of 44050 level. Any Major downside only expected in case banknifty starts trading below 43450 level. also possible Reversal Downside 43950 level.

Bullish Trend Perspective
Weekly analysis indicates a sustained bullish trend for EURUSD.
Trading Strategy:
Monitoring the 1-hourly chart for a potential Bullish Bat Pattern with an entry point at 1.0533.
Cautionary Note:
It's crucial to observe that point C touches point A in the formation of the Bat Pattern. This warrants caution and prevents me from placing a pending order to engage the trade.
Remember to conduct your own due diligence and manage risks appropriately. Happy Trading!

#EURAUD H&S pattern confirmationHello, traders. I hope you all had a great week.
Let's take a closer look at the EURAUD chart, which currently appears to be forming a reverse Head and Shoulders pattern.
One positive aspect of this chart pattern is that the price has formed it within a strong support zone, including the Daily Bullish trendline and the previous Daily market top, which is now acting as support for the price. You can observe both of these elements when you review the Daily time frame.
The presence of a bullish chart pattern around a significant low or support area certainly enhances the likelihood of the formation moving in the expected direction.
Now, to execute this trade, I would recommend patiently waiting for a retest of the broken neckline and then targeting the minimum one-to-one price target of the head and shoulders target. However, it might be a good strategy to consider taking partial profits along the way up.

BCH Bitcoin Cash Possible Breakout Of Ascending TriangleBCHUSD / BitcoinCash forming an ascending triangle pattern. Target around $326.00 based on vertical triangle measurement, which coincides with the top set back in June.

Rising Wedge breakdown in ESCORTSESCORTS KUBOTA LTD
Key highlights: 💡⚡
✅On 1Day Time Frame Stock Showing Breakdown of Rising Wedge Pattern .
✅ Strong bearish Candlestick Form on this timeframe.
✅It can give movement up to the Breakdown target of 2555-.
✅Can Go short in this stock by placing a stop loss above 3468+.

[INTRADAY] #BANKNIFTY PE & CE Levels(20/10/2023) Today will be gap down opening in BANKNIFTY . After opening if banknifty start trading below 43950 level then possible downside rally of 400-500 points upto 43550 Level. And this rally can extend for another 400 points if it gives breakdown of 43450 level. Any Major upside only expected in case banknifty starts trading above 44050 level. also possible Reversal upside 43550 level.

Rising Wedge breakdown in POLYCABPOLYCAB INDIA LTD
Key highlights: 💡⚡
✅On 1Day Time Frame Stock Showing Breakdown of Rising Wedge Pattern .
✅ Strong bearish Candlestick Form on this timeframe.
✅It can give movement up to the Breakdown target of 4566-.
✅Can Go short in this stock by placing a stop loss above 5498+.

NIFTYBANK WEEKLY TIME FRAMEThe Structure looks good to us, waiting for this instrument to correct and then give us these opportunities as shown on this instrument (Price Chart).
Note: Its my view only and its for educational purpose only. Only who has got knowledge about this strategy, will understand what to be done on this setup. its purely based on my technical analysis only (strategies). we don't focus on the short term moves, we look for only for Bullish or Bearish Impulsive moves on the setups after a good price action is formed as per the strategy. we never get into corrective moves. because it will test our patience and also it will be a bullish or a bearish trap. and try trade the big moves.
we do not get into bullish or bearish traps. We anticipate and get into only big bullish or bearish moves (Impulsive Moves). Just ride the Bullish or Bearish Impulsive Move. Learn & Know the Complete Market Cycle.
Buy Low and Sell High Concept. Buy at Cheaper Price and Sell at Expensive Price.
Keep it simple, keep it Unique.
please keep your comments useful & respectful.
Thanks for your support....
Tradelikemee Academy

#NIFTY Intraday Support and Resistance Levels - 19/10/2023Nifty will be gap down opening in today's session. After opening nifty start trading below 19600 level and then possible downside rally up to 19530 in today's session. in case nifty trades above 19700 level then the upside target can go up to the 19820 level.

BluetonaFX - USDCAD Descending Triangle SHORT IdeaHi Traders!
There is a descending triangle forming on the USDCAD 4H chart, and there may be possible opportunities for short entries leading to a potential support trendline break.
Price Action 📊
The market has had lower market swings filled with lower highs and lower lows since, along with a recent upside rejection candle and break below the 20 EMA, creating a descending triangle pattern on the chart.
We are looking for further bearish momentum to break and close the trendline support line and continue to the downside.
Fundamental Analysis 📰
Though the market's outlook on the USD is still very positive due to very strong data recently released along with continued positive statements from the Federal Reserve, there is possibility that traders are profit-taking on USD pairs meaning that new waves of buyers will be needed for any bullish momentum to take over.
Support 📉
1.35693: TRENDLINE SUPPORT
Resistance 📈
1.36743: TRENDLINE RESISTANCE
Risk ⚠️
No more than 2% of your capital.
Reward 💰
At least 4% of your capital.
Please make sure to click on the like/boost button 🚀 as your support greatly helps.
Trade safely and responsibly.
BluetonaFX

Ascending Triangle pattern breakout in GODREJCPGODREJ CONSUMER PRODUCTS LTD
Key highlights: 💡⚡
✅On 1Hour Time Frame Stock Showing Breakout of Ascending triangle Pattern.
✅Strong Bullish Candlestick Form on this timeframe.
✅It can give movement up to the Breakout target of 1012+.
✅Can Go Long in this stock by placing a stop loss below 979-.
