GALA USDT 1 Day TF Bullish MomentumBINANCE:GALAUSDT
GALA USDT 1 Day TF Analysis. Bullish Momentum Shows
Examining the GALA USDT price action, we notice promising indications of bullish momentum. After a 10-day consolidation period,
Currently break the H.L that is also good sign for price move upward direction in coming days.
(RSI) is also showing a bullish divergence on the charts, further supporting the bullish case. Traders may consider long positions with a tight stop loss (SL) strategy.
Disclaimer: It's essential to emphasize that this information is not intended as financial advice. Conduct thorough research and due diligence before making any trading decisions. Financial markets carry inherent risks due to their volatility, and the provided information is for informational purposes only.
Chartpatterntrading

Double Bottom Pattern Reversal in INDUSTOWERINDUST TOWER LTD
Key highlights: 💡⚡
📊On 1Day Time Frame Stock Showing Reversal of Double Bottom Pattern.
📊 It can give movement upto the Reversal target of Above 195+.
📊There have chances of Breakout of Resistance level too.
📊 After Breakout of Resistance level this stock can gives strong upside rally upto above 212+.
📊 Can Go Short in this stock by placing stop loss below 168- or last swing Low.

Bitcoin Cash / BCH Ascending Triangle BreakoutBCH on the daily forming an ascending triangle pattern. Will confirm when candle closes above the horizontal resistance level.

GRSE Looks good for 5-10% ROI SwingThe stock is poised for an up move after a consolidation of 1 month, it would move up to the supply zones marked in black lines.
Entry can be 780 - 792 zone. SL DCB - 180 Targets could be 5 - 10 % as per Risk management.

Ascending Triangle pattern breakout in TORNTPHARMTORRENT PHARMA LTD
Key highlights: 💡⚡
✅On 1Hour Time Frame Stock Showing Breakout of Ascending triangle Pattern.
✅Strong Bullish Candlestick Form on this timeframe.
✅It can give movement up to the Breakout target of 1970+.
✅Can Go Long in this stock by placing a stop loss below 1885-.

#NIFTY Intraday Support and Resistance Levels - 13/10/2023Nifty will be gap down opening in today's session. After opening nifty start trading below 19780 level and then possible downside rally up to 19660 in today's session. in case nifty trades Above 19830 level then the upside target can go up to the 19950 level.

[INTRADAY] #BANKNIFTY PE & CE Levels(13/10/2023) Today will be gap down opening in BANKNIFTY . After opening if banknifty start trading below 44450 level then possible downside rally of 400-500 points upto 44050 Level. And this rally can extend for another 400 points if it gives breakdown of 43950 level. Any Major upside only expected in case banknifty starts trading above 44550 level. also possible Reversal upside 44050 level.

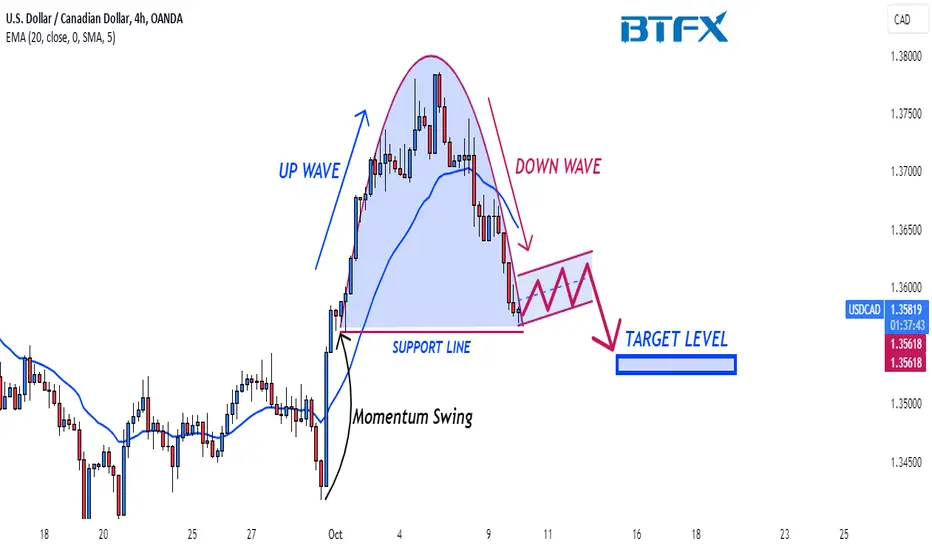
BluetonaFX - USDCAD Cup & Handle Pattern SHORT IdeaHi Traders!
There is a potential cup and handle pattern forming on the 4H USDCAD chart, and there is potential for further moves to the downside depending on whether we get an important support price break.
Price Action 📊
The market has had an up wave to start the cup pattern and a down wave to finish the cup pattern. The market has now almost reached our support level at 1.35618, and there is potential here for a market consolidation period, which will be the cup handle.
We are looking for a momentum price break and a close below the support line at 1.35618 for further continuation to the downside.
Fundamental Analysis 📰
Traders are currently nervous about the US dollar. With the Fed Minutes meeting tomorrow, the market will be looking for hawkish statements from the Fed in response to the very strong economic data recently published.
Support 📉
1.35618: SUPPORT LINE
Resistance 📈
1.36022: PREVIOUS DAY'S HIGH
Risk ⚠️
No more than 2% of your capital.
Reward 💰
At least 4% of your capital.
Please make sure to click on the like/boost button 🚀 as your support greatly helps.
Trade safely and responsibly.
BluetonaFX
Head & Shoulder pattern breakout in SBILIFESBI LIFE INSURANCE COMPANY LTD
Key highlights: 💡⚡
✅On 1 Hour Time Frame Stock Showing Breakout of Head & Shoulder Pattern.
✅ Strong Bullish Candlestick Form on this timeframe.
✅It can give movement up to the Breakout target of 1355+.
✅Can Go Long in this stock by placing a stop loss below 1295-.

Ethusdt ... Technical analyst After the pullback, I expect growth up to 21 zones, based on Fibonacci and price action

Symmetrical Triangle on EUR/GBP @ D1EUR/GBP has entered a symmetrical triangle pattern on its daily chart. It can be used for a trend continuation breakout setup. My potential entry is marked by the cyan line, which is located at 10% of the triangle's base width above the upper border. My take-profit will be at the green line, which is located at 100% of the triangle's base width above the upper border. I will set my stop-loss to the triangle's lower angle (0.86141). I will ignore bearish breakouts from this formation.

#NIFTY Intraday Support and Resistance Levels - 12/10/2023Nifty will be gap up opening in today's session. After opening nifty sustain above 19830 level and then possible upside rally up to 19950 in today's session. in case nifty trades below 19790 level then the downside target can go up to the 19670 level.

Broadening Wedge Pattern Reversal in DISHTVDISH TV INDIA LTD
Key highlights: 💡⚡
📊On 1Day Time Frame Stock Showing Reversal of Broadening Wedge Pattern.
📊 It can give movement upto the Reversal target of Above 23+.
📊There have chances of Breakout of Resistance level too.
📊 After Breakout of Resistance level this stock can gives strong upside rally upto above 30+.
📊 Can Go Long in this stock by placing stop loss below 14- or last swing Low.

Head & Shoulder pattern breakout in TRENT TRENT LTD
Key highlights: 💡⚡
✅On 1 Hour Time Frame Stock Showing Breakout of Head & Shoulder Pattern.
✅ Strong Bullish Candlestick Form on this timeframe.
✅It can give movement up to the Breakout target of 2170+.
✅Can Go Long in this stock by placing a stop loss below 2065-.

Dr copper potential more downside moveHello traders, lets take a look at copper which testing an important resistance area and see what can possibly happen and what are the consequences of possible bearish move in other markets like us equities.
first lets talk technical, price overall bearish Daily move in copper formed a standard #head_and_shoulder pattern in form of consolidation in downtrend move and as we know this chart pattern in the middle of a move showing continuation. As it can be seen price formed clear H&S pattern and now forming possible LH at key resistance area below Daily EMA and at the 4H timeframe 200 EMA. more importantly price failed to close above 3.80$ in the past 3 days.
Also we know that copper as one of the most important commodities is very sensitive on economic data, and since central banks are in raising interest rate campaign in order to take control inflation this can be interpreted as lower economic growth and as a result les demand for industrial commodities like copper which can bring prices lower.
so now obvious chart pattern and a valid downtrend, price testing important resistance area and failed to break above it and more importantly we have fundamental aspect inline with technical analysis which all together gives good odd to find a trigger to short.

#NIFTY Intraday Support and Resistance Levels - 10/10/2023Nifty will be gap up opening in today's session. After opening nifty sustain above 19530 level and then possible upside rally up to 19650 in today's session. in case nifty trades below 19490 level then the downside target can go up to the 19370 level.

[INTRADAY] #BANKNIFTY PE & CE Levels(10/10/2023) Today will be gap up opening in BANKNIFTY . After opening if banknifty sustain above 44050 level then possible upside rally of 400-500 points upto 44450 Level.Any Major downside only expected in case banknifty starts trading below 43950 level.

Buy Trap
The charts are pretty explanatory.
Price has formed Triple Tops
Price is on a Supply Zone.
I wouldn't advise buying until Price breaks above the supply zone
I would love to hear your thoughts 🤔 on this, so feel free to leave a comment ✍.
Please like 👍❤ this idea 💡 if you agree, and follow me for more updates ❕❕❕

Head & Shoulder pattern breakout in NIFTYNIFTY 50 INDEX
Key highlights: 💡⚡
✅On 15 Minutes Time Frame Stock Showing Breakout of Head & Shoulder Pattern.
✅ Strong Bullish Candlestick Form on this timeframe.
✅It can give movement up to the Breakout target of 19815+.
✅Can Go Long in this stock by placing a stop loss below 19500-.

Rising Wedge Reversal in BALRAMCHINBALRAMPUR CHINI MIL LTD
Key highlights: 💡⚡
📊On 1Day Time Frame Stock Showing Reversal of Rising Wedge Pattern .
📊 It can give movement upto the Reversal target of Above 465+.
📊There have chances of Breakout of Resistance level too.
📊 After Breakout of Resistance level this stock can gives strong upside rally upto above 520+.
📊 Can Go Long in this stock by placing stop loss below 405- or last swing Low.

Descending Triangle breakdown in JINDALSTELJINDAL STEEL & PWR
Key highlights: 💡⚡
✅On 1Hour Time Frame Stock Showing Breakdown of Descending Triangle Pattern .
✅ Strong bearish Candlestick Form on this timeframe.
✅It can give movement up to the Breakdown target of 645-.
✅Can Go short in this stock by placing a stop loss above 690+.

BluetonaFX - NZDJPY Rising Wedge SHORT IdeaHi Traders!
There is a rising wedge pattern on NZDJPY, which signals a possible reversal of the bullish trend we have seen over the past few months.
Price Action 📊
There was an aggressive upside price rejection candle followed by a momentum break below the 20 EMA. This shows that there may be new waves of bearish volume entering the market.
We are looking for a bearish break and a close below the support trendline.
Fundamental Analysis 📰
New Zealand left their interest rates unchanged, and the dovish statement from the RNBZ has left the NZD under some selling pressure.
Support 📉
87.094: PREVIOUS DAY'S LOW
Resistance 📈
89.251: PEVIOUS DAY'S HIGH
Risk ⚠️
No more than 2% of your capital.
Reward 💰
At least 4% of your capital.
Please make sure to click on the like/boost button 🚀 as your support greatly helps.
Trade safely and responsibly.
BluetonaFX

[INTRADAY] #BANKNIFTY PE & CE Levels(04/10/2023) Today will be gap down opening in BANKNIFTY . After opening if banknifty start trading below 44450 level then possible downside rally of 400-500 points upto 44050 Level. Any Major upside only expected in case banknifty starts trading above 44550 level. also possible Reversal upside 44050 level.
