Mount Fuji Series- Old runners waking upMount Fuji Series- Old runners waking up -
TARC - started running after 50-70 levels.. hope getting ready again.
Realty company with good land holding. Funda strong company.
Chartpatterntrading

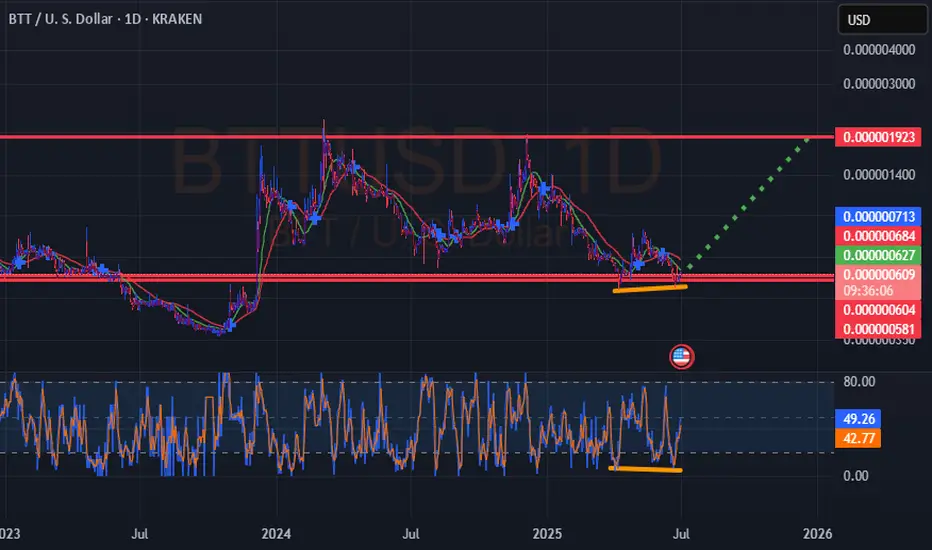
BTT USD Double BottomHi everyone. BTT in a double bottom pattern . Playing out the famous W. Let's hope it breaks through top resistance. Keep an eye for updates. Not financial advice, but probable.
MAHANAGAR GAS LTD ' S Key Level .This is the 4 hour chart of Mahanagar gas ltd.
MGL having a good law of polarity near at 1420 Range.
If this level is sustain , then we may see higher prices in MGL.
Thank You !!

SJVN 's Key level for Swing .This is the 4 hour chart of SJVN.
SJVN is forming a broadening pattern with support near at 90 range.
SJVN is forming a descending broadening pattern within a larger ascending broadening structure with support at near 91 range.
If this level is sustain then ,we may see higher prices in SJVN.

TITAN ' s Key Point | Breakout | Swing.This is the 4 hour Chart of the TITAN COMPANY.
Titan has formed a Cup and Handle pattern and given a breakout .
Two possible scenarios:
If the breakout sustains with volume, the rally may continue.
If it retests the breakout level, it would offer a safer entry before the next leg up.
If this level is sustain then we may see higher prices in Titan.

Narayana Hrudayalaya - Strong Fundamental & TechnicalFundamental plus Technical Analysis on a Financially Strong Company:
Narayana Hrudalaya Ltd is engaged in providing economical healthcare services. It has a network of multispecialty and super specialty hospitals spread across multiple locations.
Focus
Company plans to add 700 plus beds for the next 3-4 years at Bangalore Health City. It intends to invest upto Rs. 1,000 Cr in the West Bengal for setting up a superspecialty hospital.
Capex Plan
Company has planned a total capex of 1136 Cr for FY24 and till Q3 FY24 it has spent 477 Cr.
Stock P/E - 31.7
Industry PE - 56.3
EPS growth 5Years - 67.8 %
Buy Score - 4.56 (Buy Score above 0 for me, is considered very good and above 1, excellent.)
ROCE 5Yr - 19.6 %
Please note that this idea is meant to spread awareness and should NOT be considered a buy recommendation. Do your own research before making any financial commitments.

NATURALGAS at Best Support Zone This is the 4 hour chart of Natural Gas.
Natural Gas having a good Support Zone at 290-295 range.
Natural Gas has shown a reversal from its support zone.
Natural Gas is trading within a parallel channel support at 293 level Natural Gas.
Thank You !!

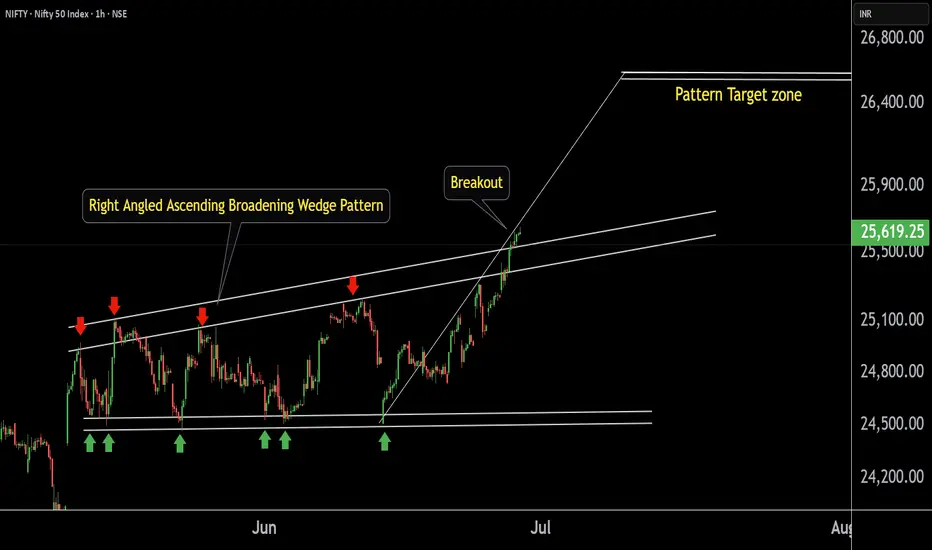
NIFTY 50 key level This is the 1 hour chart of NIFTY 50 .
NIFTY 50 has formed Right Angled Ascending Broadening Wedge Pattern.
Nifty 50 has given a breakout from its pattern.
If Nifty 50 sustains after a successful retest post-breakout, we may see higher prices in Nifty 50.
The target for this pattern is projected near the 26,600 level.
Thank You !!
RELIANCE INDUSTRIES at Key Zone !!This is the 1 hour Chart of RELIANCE INDUSTRIES.
Stock has formed a large Broadening Wedge pattern, with a projected target around the 1560 range.
Stock has formed a ascending triangle patterrn with a projected target around the 1560 range.
stock has given a breakout at 1460 range. If it successfully retests and holds this level as support , then we may see higher prices in RELIANCE INDUSTRIES.
Thank you !!

TUBE INVEST OF INDIA at Best Support This is the 4 hour Chart of TIINDIA.
TIINDIA is holding within the Fibonacci retracement golden zone.
If this level is sustain , then we may see higher prices in TIINDIA.
Thank You !!

ALLCARGO LOGISTICS at Best Support !!This is the 4 hour Chart of ALLCARGO LOGISTICS.
ALLCARGO is having good law of polarity at 33 range .
Price action confirms a retest of the support zone at 33 range.
Price action indicates a bullish HH-HL formation.
If the support level sustains, the stock has the potential to make a new high.
Thank You !!

BAJAJ FINANCE LTD at Best Support !!This is the 4 hour Chart of BAJFINANCE.
BAJFINANCE having a good support at 880-900 range.
BAJFINANCE is currently trading within an ascending channel pattern, indicating a structure of higher highs and higher lows, which reflects a sustained uptrend.
If this level is sustain, then we may see higher prices again BAJFINANCE.
Thank You !!

BERGEPAINT at Best Support !!This is the Daily Chart of BERGEPAINT .
BERGEPAINT having good law of polarity at 540-545 range.
EMA is also providing support for the stock around the 545 range.
If this level is sustain the , We may see higher price in BERGEPAINT.
Thank You !!

RAIN INDUSTRIES at Good Support.This is 4 hour chart of RAIN INDUSTRIES.
Stock is forming a Symmetrical Triangle Pattern.pattern lower boundary expected to act as a strong support level 142-145.
IF this level is sustain , then we may see higher prices in Rain industries.
Thank You !!

BEST XAUUSD BUY AND SELL SETUP FOR TODAY 📉📊 Gold (XAU/USD) Analysis – Key Levels in Focus! 📈🧐
Gold is currently trading around the 3,326 zone after a recent pullback. Price is approaching the key support level at 3,310, where a potential bullish bounce may occur, targeting the next resistance near 3,350. 🛑 However, if price fails to hold above 3,310, we may see further downside movement towards the 3,293 support. 📉 Traders should watch for reaction and confirmation around these zones before taking entries. ⚠️💡 A bullish reversal could trigger strong buying momentum, while a bearish break may lead to deeper correction. 🎯💰

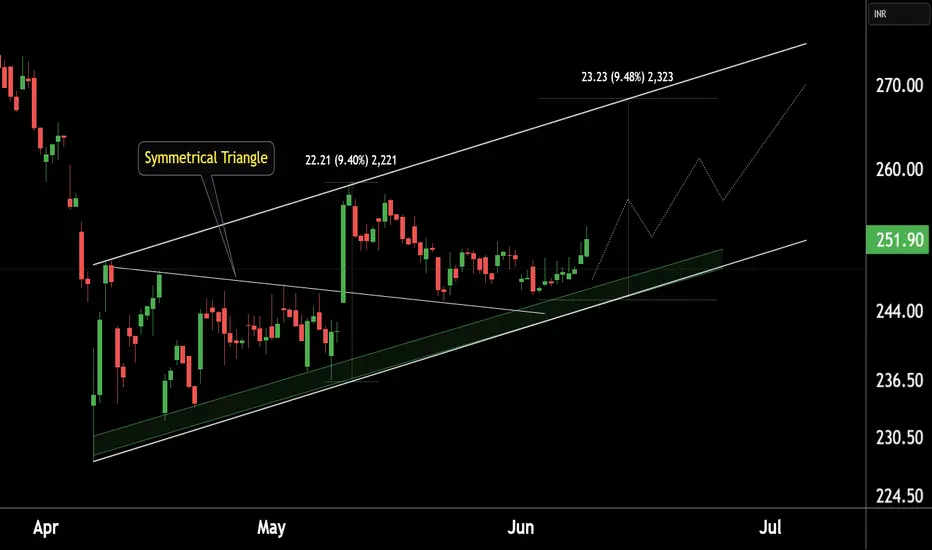
WIPRO at Best Support !!This is the 4 hour chart of Wipro ltd.
WIPRO has a strong support zone in the 245–248 range.
WIPRO is forming a symmetrical triangle pattern, with a potential target of 268, which also aligns with the channel's resistance zone at 268-270."
If this level is sustain , we may see higher prices in Wipro !!
Thank You
ETH Bullish | Inverse H&S | Cup and Handle PatternEthereum is still dragging its feet towards a new ATH, or at least, towards a high. But there are some positive signs showing up on the chart.
Make sure to check out yesterday's update on Bitcoin:
____________________________
BINANCE:ETHUSDT

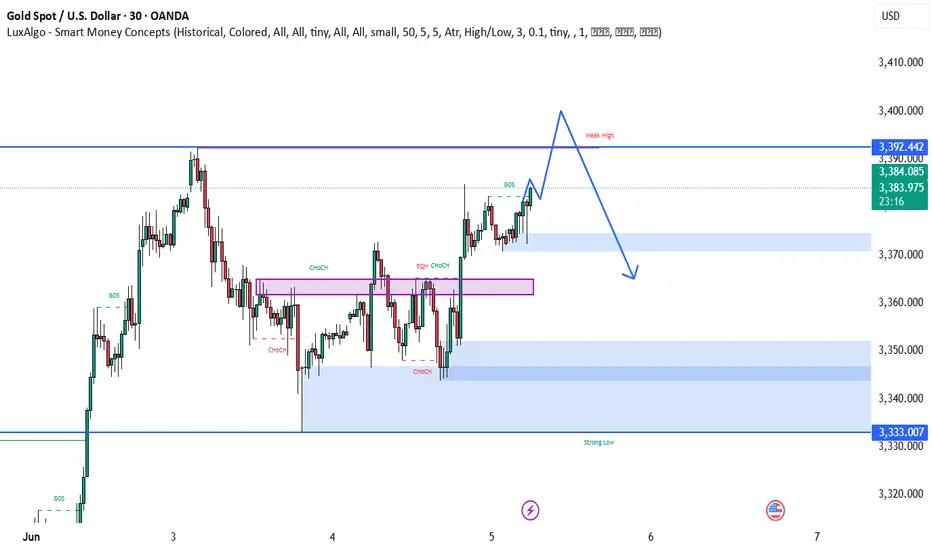
BEST XAUUSD M30 BUY AND SELL SUTUP FOR TODAY📊 Gold is currently showing bullish strength with a break above key structure levels and multiple CHoCH confirmations. Price is approaching a weak high near 3,392, which may act as a liquidity target before potential reversal. 🔄 After sweeping this high, a bearish move could unfold, aiming for the demand zones between 3,350–3,333 where buyers may step back in. 🧠 Traders should prepare for a liquidity grab scenario, with bullish continuation likely invalidated if price closes below the strong demand. ⚠️ Watch price action closely near the weak high and key imbalance zones. 🚀🔁📉
BEST XAUUSD M30 SELL SETUPNFOR TODAY 📉 Gold Analysis Summary – Bearish Setup Alert ⚠️
Gold is currently showing signs of weakness after a strong bullish push. A Change of Character (CHOCH) has confirmed a potential shift in trend. Price is approaching a supply zone (highlighted in purple), and rejection from this level could trigger a downward move. 🔄 The projected path suggests a potential lower high formation, followed by a drop towards the 3,348 and 3,331 key demand levels. 🧠 Watch for bearish confirmation near resistance before entering short positions. 📊💥

EURJPY SHORTwith safe haven assets expected to be bullish, i expect JPY to be strong against risk on currency like euro. EURJPY is expected to fall to complete a triange formation in the coming weeks before the bullish impulsive leg.

BEST XAUUSD M30 BUY & SELL SETUP FOR TODAY 📉📊 Gold (XAU/USD) Technical Outlook – Key Decision Zone Incoming! ⚠️📈
Gold prices are currently testing a crucial support zone around 3,251, following a strong bearish momentum. As shown on the M30 chart, the market is now at a make-or-break level, where two potential scenarios could unfold: either a bullish reversal toward the 3,280–3,300 area if price holds and confirms support ✅, or a bearish continuation if the level breaks, pushing price lower toward 3,220 or beyond ❌. Traders should watch for price action signals and wait for a clear breakout or strong bounce confirmation before entering any trades 🧠🔍. This is a high-volatility reaction zone — trade smart! 🎯📉📈

BEST GOLD M30 BUY SETUP FOR TODAY📉 Gold is currently showing signs of a potential pullback towards the key demand zone around 3,290–3,285 marked in purple. This area has previously acted as a strong support and could trigger a bullish reversal if price reacts positively here. 🟪 Once the price enters this zone and forms a bullish confirmation (like a rejection wick or bullish engulfing candle), we could see a strong upward move targeting 3,320+ 📈. Traders should stay alert for buying opportunities from this zone and avoid chasing the price before a clear confirmation! 🎯⚡

ZAGGLE : Chart Pattern Breakout ( Swing Pick )#ZAGGLE #breakoutstock #flagbreakout #chartpatternbreakout #flagandpole
ZAGGLE : Swing Trade
>> Chart pattern Breakout
>> Flag and pole breakout visible
>> Trending stock
>> Low Risk , High Reward Trade
>> Good Strength & Decent Volumes Building up
Swing Traders can Lock Profit at 10% and keep trailing
Disclaimer : Stock Charts shared are for Learning Purpose and not a Trade Recommendation. Do your Own Analysis or Consult ur Financial advisor or a SEBI Registered Advisor
